Heatmap Volume Profile
- Indicadores
- Olexandr Savchuk
- Versión: 4.70
- Actualizado: 14 agosto 2023
- Activaciones: 8
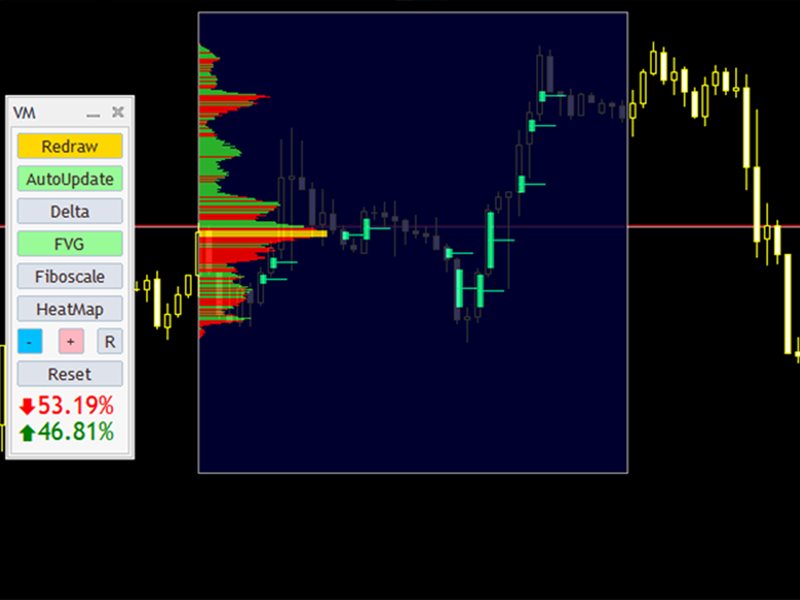
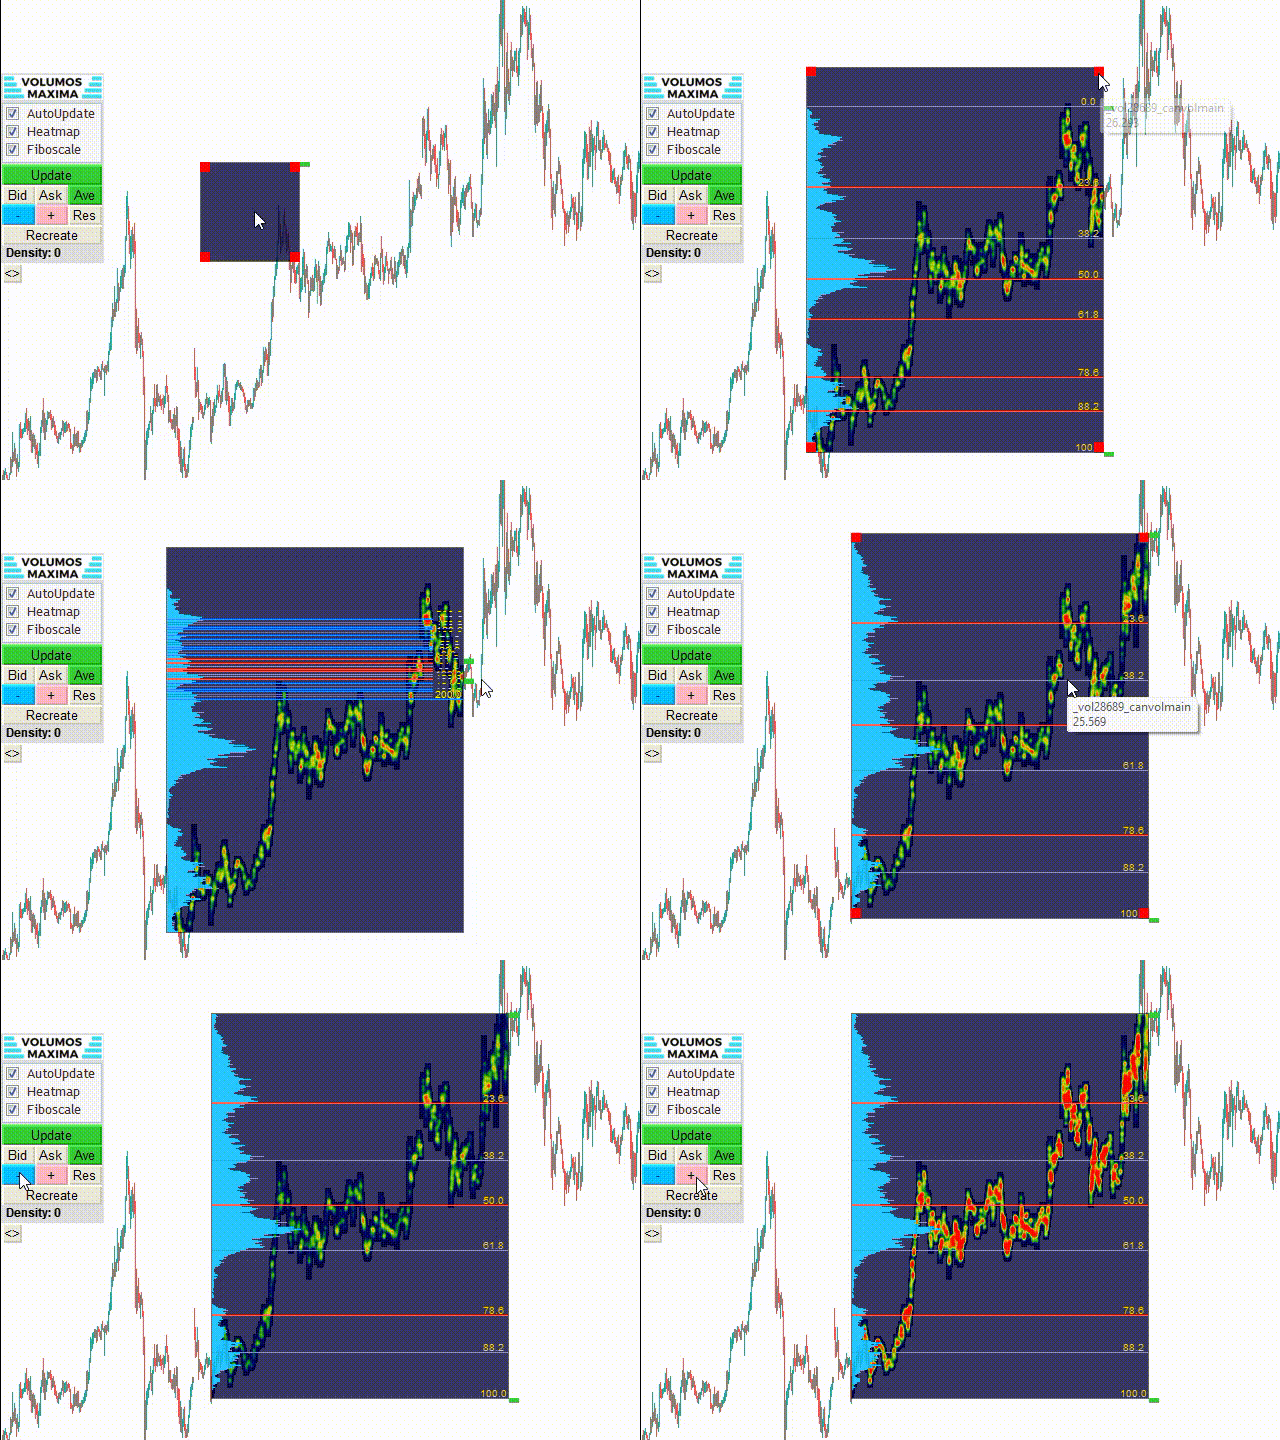
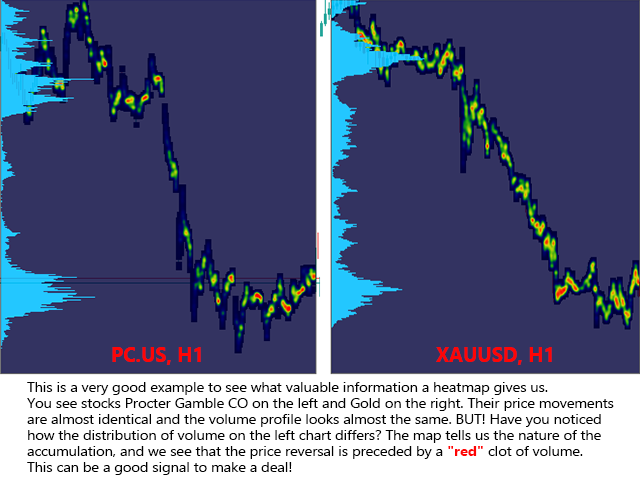
A Heatmap with a Volume Profile is like a thermal imager or x-ray machine. It will help you to estimate the relative distribution of volume during the price movement and to understand the relationship between volume and price. Indicator Volume Profile "Volumos Maxima" is a powerful tool for analyzing this relationship.
After simple experimentation with heatmap, you can find that each trading instrument has its own “characteristic” way of distributing volume. And this will help you to make a better analysis in making trading decisions.
Also, the indicator has the ability to display the Fibonacci grid. This will help to assess the harmony of the price movement. Fibanacci lines are automatically drawn relative to the "high" and "low" of the price range. This feature is implemented primarily to measure the corrective movement.
For more details please visit [our blog]
We plan to improve our indicator. We want to make it work more stable and faster.
Help us make it better - if you find a bug or have suggestions - PLEASE contact us. We will be very happy!
Benefits of the indicator
- Building a histogram of horizontal volume with POC - point of control.
- Building a delta colored profile. It helps to see the dominance of bulls or bears at some levels.
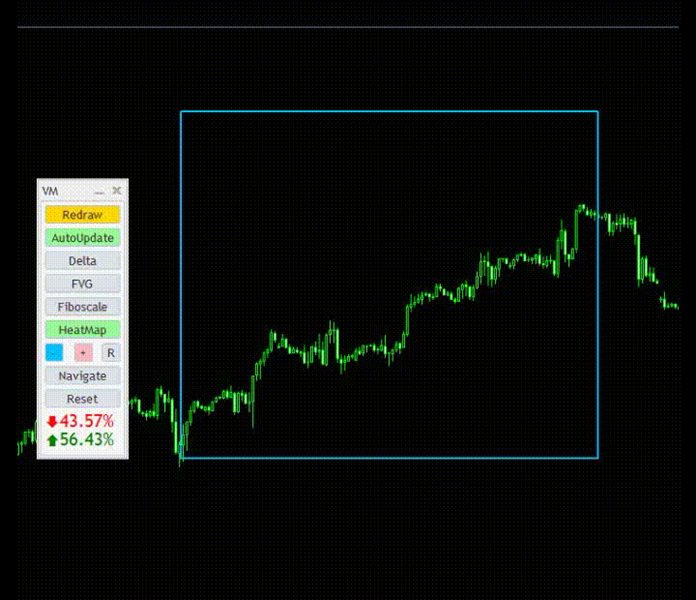
- Display of "heatmap" of volume distribution.
- Dynamic Fibonacci grid, which allows you to quickly identify potential price movement targets. Especially if the Fibonacci lines coincide with the "red spots" on the heat map.
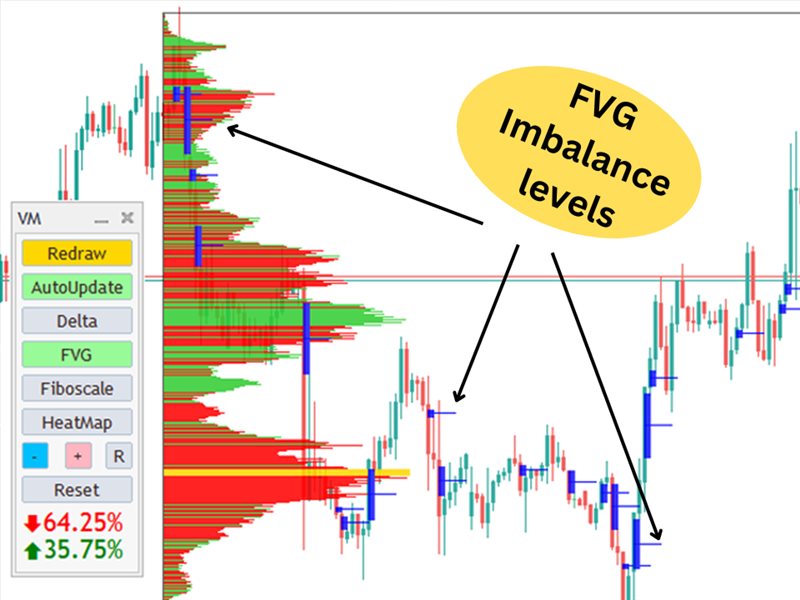
- Display FVG - fair value gap. In other words - imbalance.
- Percentage market dominance. The indicator calculates and shows the percentage dominance of buyers and sellers. A significant difference in values may indicate a change in trend.
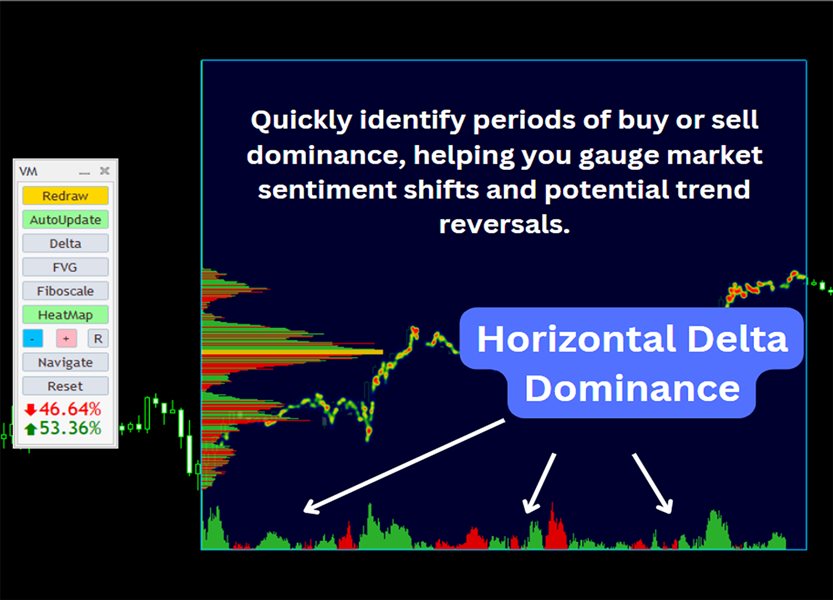
- Dominance of the horizontal delta. Quickly identify periods of buy or sell dominance, helping you gauge market sentiment shifts and potential trend reversals.
Panel
The panel allows you to do the following things:
- Use the "AutoUpdate" button to activate automatic profile recalculation. A very important option. If it is selected, then the indicator will start recalculation every time you drag it, or change the scale of the chart. On timeframes up to 4 hours, these updates are not critical and take up to 1 second. But on larger timeframes, these delays can be noticeable and uncomfortable. Therefore, you can simply disable auto-update. And start the recalculation manually with the "Redraw" button.
- Button "Redraw" for manual recalculation.
- Button to switch between Simple Profile/Delta Profile.
- Buttons "Heatmap" and "Fiboscale" allows you to show/hide the Heatmap and Fibonacci retracement accordingly. After cheking click "Redraw" button!
- Button to show "FVG" (fair value gap or imbalance).
- Buttons "+", "-" and "R". These are the buttons to increase/decrease and reset the gradient value for the heatmap. A useful thing when you need to display volumes peaks more expressively.
- Button "Navigate". When you have lost the indicator somewhere - just click and the chart will move to a rectangle.
- Button "Reset". It allows you to recreate the "rectangle" of the indicator again. This feature is useful if you lose the indicator while scrolling. Then you can just recreate it again.
- The bottom area of the panel. Percentage market dominance.
Input settings
The indicator has settings that relate to its design and display. You can change as you like. At the moment, it is possible to choose a light and dark style.
- Color mode
- Background color
- Background transparency, in %
- Spawn X and Y
- Spawn width and heigth
- Profile width, in %
- Profile color
- POC color
- FVG color
- Color of 0% and 100% Fibos lines
- Color Fibos lines
- TextScaleColor for 0%-100% fiborange
- TextScaleColor for rest of range
IMPORTANT SETTINGS:
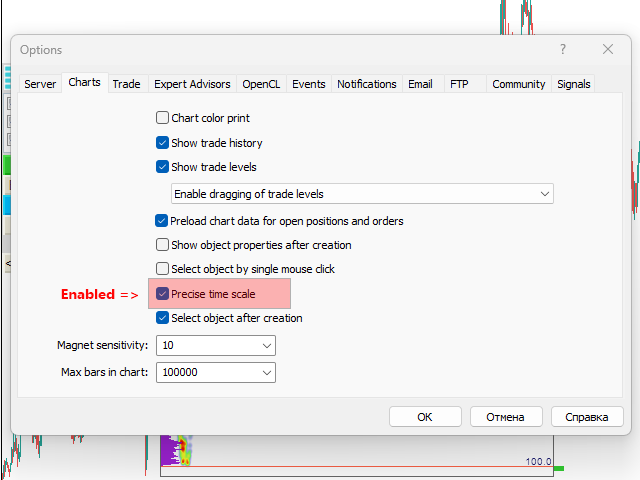
For the correct display of the "drawing window" of indicator, terminal must have "Precise time scale" option enabled. To do this, open the settings: Tools -> Options -> Charts -> Precise time scale (should be active). Or you can use Ctrl+O.
TECHNICAL LIMITATIONS:
- The work of the indicator is related to the processing of a large amount of data. Namely, information about the volumes. Therefore, the indicator needs time to download data (tick history) from your broker's server and to complete the calculations. It usually takes 1-3 seconds (with ping ~40ms).
- The indicator’s range window will update the data only when it is completely on the visible part of the chart.
- At the moment, we have implemented only the processing of tick volumes. And in the next updates we will add the ability to work with real volumes.
- In this version of the indicator, it is possible to work with only one “range window”. We are considering adding more of these “windows” in future updates. We do not recommend more than one instance of the indicator per chart!
What to do if the indicator does not show anything?
This can happen when the indicator is first launched on a trading chart. Perhaps the indicator has not yet downloaded the required data from the broker. Wait a couple of seconds and click the "Redraw" button on the panel. And it should work.
Also, the indicator may not display anything, or display partially if there is simply no data for calculation. This can happen if you use the indicator on a deep history. This means that your broker's server does not save tick information for this time range.



Hi, it is a veeeery promising Indicator, but there are minor things that I'd suggest as enhancements, the thing that bothers me more is that there is no way to "hide" the rectangle, unless you completely remove the indicator from the Chart, I would like to see a (button?) that enables me to toggle them without having to attach/detach from the chart, Secondly, the support for multi-rectangles would be amazing (even required, I would say). Thank you, even with the pending enhancements, it is going to be probably the best volume profile indicator soon.