• Información general
  • Comentarios
  • Discusión

Price Rectifier Signals

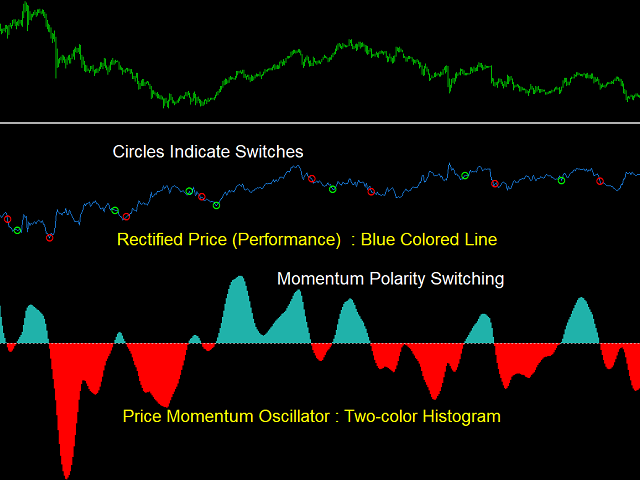
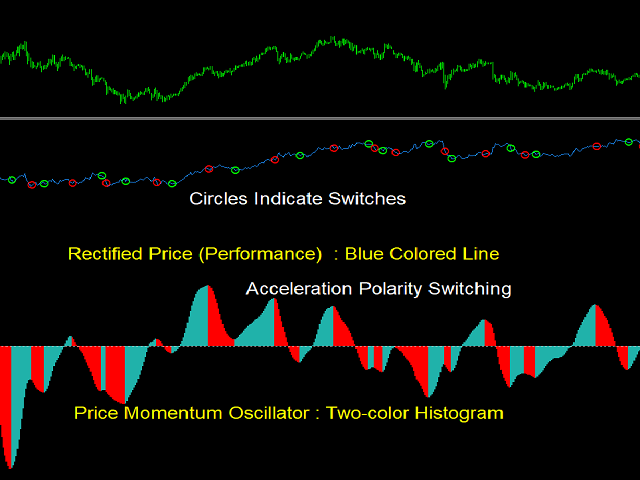
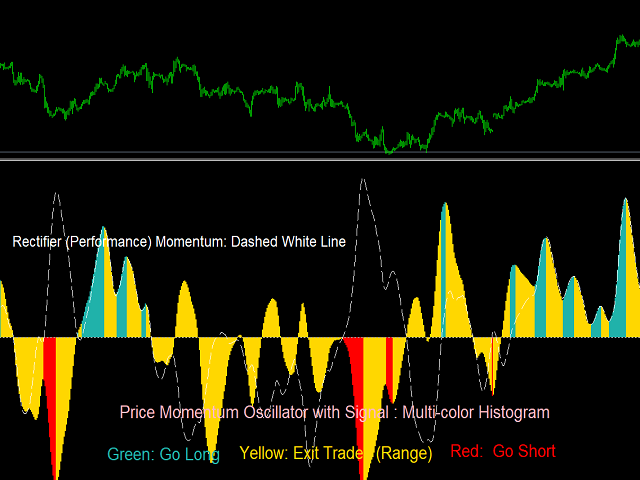
This indicator provides trading signals based on the polarity of the dynamical parameters of two digital signals. The dynamical parameters (momentum-acceleration) are derived by applying a high quality momentum oscillator, MTEMA LPD ( see Top Gun Oscillators) to two digital signals. The MTEMA momentum oscillator is first applied to the price itself. Then, a rectification procedure is applied to the price based on the signals from the momentum oscillator yielding a rectified price signal. This switching procedure is very similar to the process of calculating the performance based on alternating buy and sell signals. Then the MTEMA LPD is applied to the rectified price. The idea is this: We want to filter the price momentum trading signals by using only those we expect to increase the performance - based on its dynamics- while discarding those that reduce the performance.

Screenshots 1  and 2 show the rectified price and the price momentum signals used to calculate them in each of the two possible cases based on the input "Rectification_Source". 

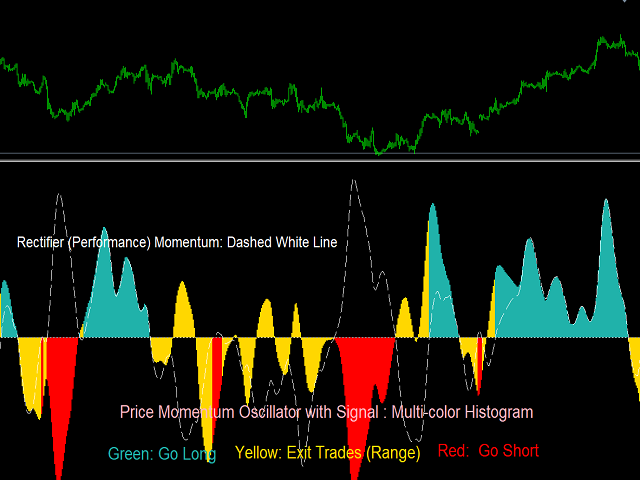
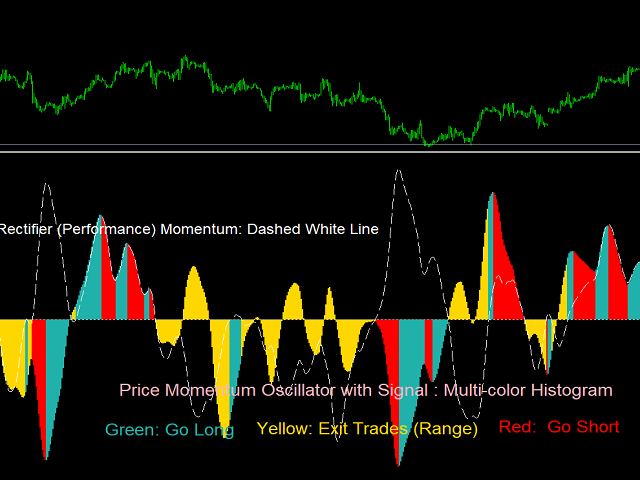
There are a total of eighteen unique combinations of dynamical paremeters based on polarity that can be use to derive trading signals. With additional options including the input price and changing the periods of the MTEMA LPD's . Strategy testing is critical to select the best performing signals for the pair and time-frame.  Some of these are plotted in the screenshots that follow.

The first buffer of the indicator (not plotted) is a trading signal. +10 for going long, and -10 for going short, or zero for exiting trades. This signal is accessed by using the iCustom function call.


Productos recomendados
YOU CAN NOW DOWNLOAD FREE VERSIONS OF OUR PAID INDICATORS . IT'S OUR WAY OF GIVING BACK TO THE COMMUNITY ! >>>    GO HERE TO DOWNLOAD Momentum channel is a simple momentum based system yet with a great degree of accuracy in detecting turning points. The market momentum are defined by Average True Range Channels . When price breaks these channels most times , it is an indication of a shift in market momentum and thus a possible new trend formation. The system can be traded on any time frame an
FREE
Color Macd Tf
Syarif Nur Arief
MACD is well known indicator that still can be use for prediction where price will go next few minutes, hours or even weekly  With colored bar of Macd, your eyes can easily catch when color is changed based what market price movement to find any early trend on market. here is the parameter of the indicator: TF_MACD , default is 1 Hour , this mean you can see clearly MACD of 1 Hour TimeFrame on Lower TimeFrame. InpPrice , default is Price Close , this is original MACD parameter from Metaquotes st
FREE
TIbors Timer
Tibor Hartmut Sturm
Indikator zur klaren Anzeige im Metatrader Dieser Indikator wurde von mir Entwickelt damit die Anzeige der relevanten Parameter klar und deutlich im Chart auf einen Blick zu sehen ist.  Er dient zur Information und ist ohne Gewähr.  Folgende Parameter werden angezeigt: -   Der  Aktuelle Kurs - Das Aktuelle Handelspaar - Die Restzeit zur nächsten Kerzenbildung / Zum Abschluss der Aktuellen Kerze - Die Kontonummer des Handelskontos - Die Frei Verfügbare Margin - Die Margin auf 1 Lot - Der Akt
FREE
High Pass Filter Candlesticks
Safwan Rushdi Khalil Arekat
This indicator applies the  biquad high pass filter to the price-chart data, and displays the filter output for the OHLC as candlesticks. The candlesticks corresponds to the actual calculations of the filter value  during the formation of each price bar (not from all historical highs lows or closes). The shape of the bars therefore corresponds directly to the shape of each price bar. High pass filters are an underappreciated type of oscillator that are seldom used in technical analysis in the st
FREE
FisherYur4ik by Yuri
Nnamdi Kennedy Ifeorah
Fisher Yur4ik Indicator is a momentum indicator originated by Yuri Prokiev (Russian). I combined the Fisher Test indicator with other indicators to sieve/filter signals. It is not used as a standalone indicator but in combination to filter out Price Action signals.  I have uploaded this indicator (Fisher test) for download alongside the 3Bar_Play signal indicator for signals to appear. It is free.
FREE
FFx MACD
Eric Venturi-Bloxs
4.44 (9)
El objetivo de esta nueva versión del indicador MT4 estándar, incluido en el suministro de la plataforma, es mostrar en una subventana varios marcos temporales de un mismo indicador. Ver el ejemplo mostrado en la figura de más abajo. Sin embargo, el indicador no se representa como un indicador MTF simple. Es la representación real del indicador en su marco temporal. Ajustes disponibles en el indicador FFx: Elección del marco temporal a mostrar (desde M1 hasta MN) Ajuste de la anchura (cantidad d
FREE
YOU CAN NOW DOWNLOAD FREE VERSIONS OF OUR PAID INDICATORS . IT'S OUR WAY OF GIVING BACK TO THE COMMUNITY ! >>>    GO HERE TO DOWNLOAD This system is an Heiken Ashi system based on RSI calculations . The system is a free open source script originally published on TradingView by JayRogers . We have taken the liberty of converting the pine script to Mq4 indicator . We have also added a new feature which enables to filter signals and reduces noise on the arrow signals. Background HEIKEN ASHI
FREE
Email Drawdown Alert
Roman Starostin
5 (15)
Free informative Indicator-helper. It'll be usefull for traders who trade many symbols or using grid systems (Averaging or Martingale). Indicator counts drawdown as percent and currency separate. It has a number of settings: Count deposite drawdown according equity value and send e-mail or notifications to user if DD more than set; Sending e-mail when max open orders reached; Shows price and remaining pips amount before MarginCall on current chart and Account generally; Display summary trade lot
FREE
TG Macd 2 Line MT4
Daciana Elena Chirica
The MACD 2 Line Indicator is a powerful, upgraded version of the classic Moving Average Convergence Divergence (MACD) indicator. This tool is the embodiment of versatility and functionality, capable of delivering comprehensive market insights to both beginner and advanced traders. The MACD 2 Line Indicator for MQL4 offers a dynamic perspective of market momentum and direction, through clear, visually compelling charts and real-time analysis. Metatrader5 Version |  How-to Install Product | How-t
FREE
MACD Line 2 MT4
MASTERBROK NEXUS SRL
The MACD 2 Line Indicator is a powerful, upgraded version of the classic Moving Average Convergence Divergence (MACD) indicator. This tool is the embodiment of versatility and functionality, capable of delivering comprehensive market insights to both beginner and advanced traders. The MACD 2 Line Indicator for MQL4 offers a dynamic perspective of market momentum and direction, through clear, visually compelling charts and real-time analysis. Metatrader5 Version   |   All Products   |   Contac
FREE
RSI With Alert Relative strength index (RSI) indicator is a popular technical indicator in the family of oscillators. RSI oscillates between 0 and 100 and traders use it to spot overbought and oversold states in the market. Typically, a value above 70 means that the instrument is overbought and due to a retracement. A value below 30 means that the trading instrument is oversold. RSI indicator strategies This indicator allows you to get notifications when some conditions trigger. You c
FREE
This indicator calculates average speed of moving average indicator. Here is parameters: BarsToProcess - indicator calculating period; MaPeriod - period of Moving Average indicator; AveragingPeriod - period (MA values) of the basis of which the average value is calculated; MA_Method, MA_Apply_to - using to set MA indicator parameters; Thats all! Good luck.
FREE
Rainbow MT4
Jamal El Alama
Rainbow MT4 is a technical indicator based on Moving average with period 34 and very easy to use. When price crosses above MA and MA changes color to green, it’s a signal to buy. When price crosses below MA and MA changes color to red, it’s a signal to sell. The Expert advisor ( Rainbow EA MT4) based on Rainbow MT4 indicator, as you can see in the short video below is now available here .
FREE
Commodity Channel Index Corrected
Safwan Rushdi Khalil Arekat
5 (1)
This indicator resolves an unrecognised defect in the Commodity Channel Index Oscillator (CCI). The CCI is based on a high pass filter calculated by subtracting the p-period simple moving average of a price signal (usually typical value) from the price signal itself. Then, the result is divided by the absolute mean deviation of the same period. The frequency response of a signal minus its simple moving average is shown in the first screen shot (in Blue). (see my free indicator : Q n D Frequency
FREE
Starting Points
Muhammed Emin Ugur
The Starting Points indicator for MetaTrader 4 is a technical analysis tool that shows the monthly, weekly, and daily starting points, as well as the 1000-point and 500-point levels, in the forex market. The indicator is displayed as a series of horizontal lines that represent the starting points and levels. Benefits of Using the Starting Points Indicator Identify potential trend changes:   The Starting Points indicator can help traders identify potential trend changes by highlighting areas wher
FREE
Mr Beast Indicator
Luis Mariano Vazquez Marcos
Indicador Gratuito desarrollado por Mr Beast Inversiones Mr Beast : Gestión de riesgo profesional. Brindo a la comunidad la entrada a productos de M Beast. Echar un vistazo a mis señales y expert advisors. Descuentos de hasta 70% Diclaimer: La negociación en Forex, CFD y Opciones conlleva un riesgo de pérdida sustancial y no es adecuada para todos los inversores. El alto grado de apalancamiento puede actuar en su contra y también en su favor, Antes de decidirse a operar en productos tan apalanca
FREE
FFx Force Index
Eric Venturi-Bloxs
5 (4)
The purpose of this new version of the MT4 standard indicator provided in your platform is to display in a sub-window multiple timeframes of the same indicator. See the example shown in the picture below. But the display isn’t like a simple MTF indicator. This is the real display of the indicator on its timeframe. Here's the options available in the FFx indicator: Select the timeframes to be displayed (M1 to Monthly) Define the width (number of bars) for each timeframe box Alert pop up/sound/ema
FREE
Volatility Limit Trend
Safwan Rushdi Khalil Arekat
5 (1)
Volatility Limit Trend Indicator (VLT), an original indicator by this developer,  is a trend indicator based on setting a fixed volatility limit as a percentage of price. Volatile price is allowed to wander between two channel lines defining the fixed volatility about a central line. The price crossing one of the channel lines defines an exceeding of the allowed volatility, and ushering in one of two situation : either a continuation or a reversal of trend. The first buffer of the indicator (not
FREE
El Capturador de Tendencias: La Estrategia del Capturador de Tendencias con Indicador de Alerta es una herramienta versátil de análisis técnico que ayuda a los traders a identificar las tendencias del mercado y los posibles puntos de entrada y salida. Presenta una Estrategia dinámica del Capturador de Tendencias, adaptándose a las condiciones del mercado para una clara representación visual de la dirección de la tendencia. Los traders pueden personalizar los parámetros para que se ajusten a s
FREE
Adjustable Fractal MT4
Dmitry Timin
4.63 (30)
Adjustable Fractal MT4 is a modification of Bill Williams' Fractals indicator. The fractal consists of a two sets of arrows - up (upper fractals) and down (lower fractals). Each fractal satisfies the following conditions: Upper fractal - maximum (high) of a signal bar exceeds or is equal to maximums of all bars from the range to the left and to the right; Lower fractal - minimum (low) of a signal bar is less or equal to minimums of all bars from the range to the left and to the right. Unlike a s
FREE
Key Price Levels
Wafa Mohammed Omar Abou Alwafa
Key Price Levels Indicator Indicator that shows the highs and lows for the significant price levels for past periods that could be potentially considered as reaction levels. The indicator displays the following price levels: Yesterday high and low The day before yesterday high and low Two days back high and low Last week high and low Last month high and low Last three month high and low (Quarter) Last year high and low
FREE
PastProjection
Gabriele Tedeschi
5 (1)
Quante volte ti è capitato di aver bisogno di avere a grafico i livelli chiave di una candela chiusa del time frame precedente? Con PastProjection potrai far disegnare i livelli di Apertura, Chiusura, Massimo e Minimo della candela chiusa al time frame superiore scelto. I livelli sono spesso importanti e diventano supporti o resistenze, o entrambi. La prima volta che vengono raggiunti spesso fanno reagire la quotazione. I pattern su questi livelli sono spesso più efficaci. Tali livelli sono sign
FREE
Updates 9/12/2023 - If you are looking for the Spock EA, I don't sell it anymore. DM me for more info. 24/10/2023  -  Check out my other products. Starting to roll out some EAs & indicators based on this range. Currently there is no MT5 version. I am using MT4 myself. So I will spend my time mostly to develop more extensive stats for the Stats version and maybe even an EA. But I might  develop a MT5 version. All depends on the demand. Meaning, the more people request it, the bigger the
FREE
Sto Signal AM
Andriy Matviyevs'kyy
5 (1)
This indicator displays Stochastic osc signals on the price chart and allows the user to receive notifications of such signals. The Stochastic indicator is a classic and proven indicator of the technical analysis of the markets. Despite its age, it is still relevant today. Depending on the settings, the indicator allows you to work effectively on various TFs and any markets. Signals are given on fully formed bars and are not redrawn. Custom Parameters: Stochastic_Price (0-1) - The applied pric
FREE
FFx Bollinger Bands
Eric Venturi-Bloxs
4.93 (14)
El objetivo de esta nueva versión del indicador MT4 estándar, incluido en el suministro de la plataforma, es mostrar en una subventana varios marcos temporales de un mismo indicador. Ver el ejemplo mostrado en la figura de más abajo. Sin embargo, el indicador no se representa como un indicador MTF simple. Es la representación real del indicador en su marco temporal. Ajustes disponibles en el indicador FFx: Elección del marco temporal a mostrar (desde M1 hasta MN) Ajuste de la anchura (cantidad d
FREE
TrendPlus
Sivakumar Subbaiya
4.21 (14)
Trend Plus   Trendplus  Indicator   Time Frame: Suitable for any time frame.  Purpose: Trend Prediction. Blue and red candle indicate the buy and sell call respectively. Buy: When the blue candle is formed buy call is initiated. close the buy trades when the next red candle will formed.   Sell: When the Red candle is formed Sell call is initiated. close the Sell trades when the next blue candle will formed.   Happy trade!!
FREE
SuperMac Free
Agus Wahyu Pratomo
4 (1)
FREE VERSION ONLY USE LOT SIZE 0.01 TO UNLOCK IT GO HERE  https://www.mql5.com/en/market/product/61498 SuperMac EA is a trading robot  for the trading on forex and trades  Scalping  Strategy and Tren Follower. This is a Trend Following system that trades in all session.   It use Multi Complex Algorithm to determine tren behaviour.  EA optimized on EURUSD, GBPUSD and NZDUSD (Use together) but can be use on other pair  Use PAIR can use 3 pairs (recommended to maximize profit) at the same tim
FREE
Vanexio
Sayan Vandenhout
5 (1)
VANEXIO USES THE TREND WAVE INDICATOR AND IT CAN IDENTIFY THE BEGINNING AND THE END OF A NEW WAVE TREND MOVEMENT. AS AN OSCILLATOR, THE INDICATOR IDENTIFIES THE OVERBOUGHT AND OVERSOLD ZONES. IT WORKS GREAT TO CATCH THE SHORT TERM PRICE REVERSALS AND USES A MARTINGALE STRATEGY TO CLOSE ALL TRADES IN PROFIT. USE DEFAULT SETTINGS ON H1 OR HIGHER TIME FRAME ON ANY PAIR FOR MORE ACCURATE TRADES WHY THIS EA : Smart entries calculated by 5 great strategies The EA can be run on even a $20000
FREE
With the MACD Multi Time Frame indicator, you can spot divergences of higher timeframes while you are searching for pinpointed entries on lower timeframes. This FREE version of the indicator works only on EURUSD and GBPUSD. The full version of the indicator can be found here: MACD Multi Time Frame This blog post gives you REAL-TIME MACD Divergence Analysis for FREE and tips how to trade the divergences: REAL-TIME MACD Divergence Analysis The MACD Multi Time Frame gives you a very good overview o
FREE
FFx Fractals
Eric Venturi-Bloxs
4.6 (5)
The purpose of this new version of the MT4 standard indicator provided in your platform is to display in a sub-window multiple timeframes of the same indicator. See the example shown in the picture below. But the display isn’t like a simple MTF indicator. This is the real display of the indicator on its timeframe. Here's the options available in the FFx indicator: Select the timeframes to be displayed (M1 to Monthly) Define the width (number of bars) for each timeframe box Alert pop up/sound/ema
FREE
Los compradores de este producto también adquieren
Gann Made Easy
Oleg Rodin
4.88 (100)
Gann Made Easy es un sistema de comercio de Forex profesional y fácil de usar que se basa en los mejores principios de comercio utilizando la teoría del Sr. W. D. Gann. El indicador proporciona señales precisas de COMPRA y VENTA, incluidos los niveles de Stop Loss y Take Profit. Puede comerciar incluso sobre la marcha utilizando notificaciones PUSH. ¡Por favor, póngase en contacto conmigo después de la compra! ¡Compartiré mis consejos comerciales con usted y excelentes indicadores de bonificació
Trend Punch
Mohamed Hassan
4.92 (24)
This indicator is unstoppable when combined with our other indicator called  Support & Resistance . After purchase, send us a message and you will get it   for  FREE as a BONUS! Introducing Trend Punch , the revolutionary forex trend indicator that will transform the way you trade! Trend Punch is uniquely designed to provide precise buy and sell arrows during strong market trends, making your trading decisions clearer and more confident. Whether you're trading major currency pairs or exotic sym
Gold Stuff
Vasiliy Strukov
4.9 (270)
Gold Stuff: un indicador de tendencia diseñado específicamente para el oro, también se puede usar en cualquier instrumento financiero. El indicador no se vuelve a dibujar ni se retrasa. El marco de tiempo recomendado es H1. Este indicador está escrito por EA Gold Stuff Advisor, puede encontrarlo en mi perfil.  Puede obtener una copia gratuita de nuestro indicador Strong Support y Trend Scanner, por favor envíe un mensaje privado. ¡a mí! IMPORTANTE! Póngase en contacto conmigo inmediatamente d
FX Power MT4 NG
Daniel Stein
5 (13)
Obtenga su actualización diaria del mercado con detalles y capturas de pantalla a través de nuestro Morning Briefing aquí en mql5 y en Telegram ! FX Power MT4 NG es la nueva generación de nuestro popular medidor de fuerza de divisas, FX Power. ¿Y qué ofrece este medidor de fuerza de nueva generación? Todo lo que le encantaba del FX Power original PLUS Análisis de fuerza de ORO/XAU Resultados de cálculo aún más precisos Períodos de análisis configurables individualmente Límite de cálculo persona
¡LEA LA INFORMACIÓN A CONTINUACIÓN ANTES DE COMPRAR EL PRODUCTO! ¡Apollo Pips PLUS SP es un producto único! ¡ES PARA AQUELLOS QUE QUIEREN OBTENER MI NUEVO INDICADOR "APOLLO PIPS" MÁS BONO "SUPER PACK" CON ACCESO A TODOS MIS INDICADORES COMERCIALES! Al comprar el producto Apollo Pips PLUS SP, en realidad está comprando una versión absolutamente nueva de mi indicador Apollo Pips. Esta versión del indicador tiene un algoritmo mejorado y un parámetro fácil de usar que le brinda la oportunidad de uti
TPSproTREND PrO
Roman Podpora
4.79 (19)
TPSpro TREND PRO   es un indicador de tendencia que analiza automáticamente el mercado y proporciona información sobre la tendencia y cada uno de sus cambios, además de dar señales para ingresar operaciones sin volver a dibujar. El indicador utiliza cada vela, analizándolas por separado. refiriéndose a diferentes impulsos: impulso hacia arriba o hacia abajo. ¡Puntos de entrada exactos a transacciones de divisas, criptomonedas, metales, acciones e índices! Versión MT5                   DESCRIPCI
Trend Pulse
Mohamed Hassan
5 (5)
Please contact me after purchase to immediately get your PDF strategy + documentation for Trend Pulse !  Official release price of $89  (2 /50 copies left). Next price is $199 . Introducing Trend Pulse , a unique and robust indicator capable of detecting bullish, bearish, and even ranging trends! Trend Pulse uses a special algorithm to filter out market noise with real precision. If the current symbol is moving sideways, Trend Pulse will send you a ranging signal, letting you know that it'
Scalper Inside PRO
Alexey Minkov
4.75 (60)
An exclusive indicator that utilizes an innovative algorithm to swiftly and accurately determine the market trend. The indicator automatically calculates opening, closing, and profit levels, providing detailed trading statistics. With these features, you can choose the most appropriate trading instrument for the current market conditions. Additionally, you can easily integrate your own arrow indicators into Scalper Inside Pro to quickly evaluate their statistics and profitability. Scalper Inside
Atomic Analyst
Issam Kassas
5 (3)
En primer lugar, vale la pena enfatizar que este Indicador de Trading no repinta, no redibuja y no se retrasa, lo que lo hace ideal tanto para el trading manual como para el automatizado. Manual del usuario: configuraciones, entradas y estrategia. El Analista Atómico es un Indicador de Acción del Precio PA que utiliza la fuerza y el impulso del precio para encontrar una mejor ventaja en el mercado. Equipado con filtros avanzados que ayudan a eliminar ruidos y señales falsas, y aumentan el poten
Trend Screener
STE S.S.COMPANY
4.82 (92)
Indicador de tendencia, solución única e innovadora para el comercio y filtrado de tendencias con todas las funciones de tendencias importantes integradas en una sola herramienta. Es un indicador 100% sin repintar de marcos temporales y monedas múltiples que se puede usar en todos los símbolos/instrumentos: divisas, materias primas, criptomonedas, índices y acciones. Trend Screener es un indicador de seguimiento de tendencia eficiente que proporciona señales de tendencia de flecha con puntos en
Currency Strength Wizard es un indicador muy poderoso que le proporciona una solución todo en uno para operar con éxito. El indicador calcula el poder de este o aquel par de divisas utilizando los datos de todas las monedas en múltiples marcos de tiempo. Estos datos se representan en forma de índice de moneda fácil de usar y líneas eléctricas de moneda que puede usar para ver el poder de esta o aquella moneda. Todo lo que necesita es adjuntar el indicador al gráfico que desea operar y el indicad
- Real price is 80$ - 40% Discount ( It is 49$ now ) Contact me for instruction, any questions! Introduction The breakout and retest strategy is traded support and resistance levels. it involves price breaking through a previous level.  The break and retest strategy is designed to help traders do two main things, the first is to avoid false breakouts. Many false breakouts start with a candlestick that breaks out of a level but ends with an immediate candlestick that brings the price back into t
¡Actualmente 20% OFF ! ¡La mejor solución para cualquier novato o trader experto! Este software funciona con 28 pares de divisas. Se basa en 2 de nuestros principales indicadores (Advanced Currency Strength 28 y Advanced Currency Impulse). Proporciona una gran visión general de todo el mercado de divisas. Muestra los valores de Advanced Currency Strength, la velocidad de movimiento de las divisas y las señales para 28 pares de divisas en todos los (9) marcos temporales. Imagine cómo mejorar
Clear Breakout
Martin Alejandro Bamonte
5 (1)
El indicador "Breakout Buy-Sell" está diseñado para identificar y resaltar posibles oportunidades de compra y venta basadas en rupturas de precios durante diferentes sesiones del mercado (Tokio, Londres y Nueva York). Este indicador ayuda a los traders a visualizar claramente las zonas de compra y venta , así como los niveles de toma de ganancias (TP) y stop loss (SL). Estrategia de Uso El indicador se puede utilizar de la siguiente manera: Configuración Inicial : Selecciona la sesión del merc
ACTUALMENTE 26% DE DESCUENTO ¡La mejor solución para cualquier operador novato o experto! Este indicador es una herramienta única, de alta calidad y asequible porque hemos incorporado una serie de características propias y una nueva fórmula. ¡Con sólo UN gráfico puede leer la Fuerza de la Divisa para 28 pares de Divisas! Imagínese cómo mejorará su operativa porque podrá señalar el punto exacto de activación de una nueva tendencia o de una oportunidad de scalping. Manual del usuario: haga
El sistema PRO Renko es un sistema de trading de alta precisión especialmente diseñado para operar gráficos RENKO. Se trata de un sistema universal que se puede aplicar a diversos instrumentos de negociación. El sistema neutraliza eficazmente el llamado ruido de mercado, lo que le brinda acceso a señales de reversión precisas. El indicador es muy fácil de usar y solo tiene un parámetro responsable de la generación de señales. Puede adaptar fácilmente la herramienta a cualquier instrumento com
Gold Channel is a volatility-based indicator, developed with a specific timing algorithm for the XAUUSD pair, which consists of finding possible corrections in the market. This indicator shows two outer lines, an inner line (retracement line) and an arrow sign, where the theory of the channel is to help identify overbought and oversold conditions in the market. The market price will generally fall between the boundaries of the channel. If prices touch or move outside the channel it is a tra
Ante todo, vale la pena enfatizar que esta Herramienta de Trading es un Indicador No Repintado, No Redibujado y No Retrasado, lo que la hace ideal para el trading profesional. Curso en línea, manual del usuario y demostración. El Indicador de Conceptos de Acción del Precio Inteligente es una herramienta muy potente tanto para traders nuevos como experimentados. Combina más de 20 indicadores útiles en uno solo, combinando ideas avanzadas de trading como el Análisis del Trader del Círculo Interio
ACTUALMENTE 31% DE DESCUENTO Este indicador es una herramienta de transacción única, de alta calidad y asequible porque hemos incorporado una serie de características propias y una fórmula secreta. Con solo un gráfico, da Alertas para los 28 pares de divisas. ¡Imagina cómo mejorarás porque puedes identificar el punto de activación exacto de una nueva tendencia u oportunidad de crecimiento! Basado en nuevos algoritmos subyacentes , hace que sea aún más fácil identificar y confirmar operaciones po
NAM Order Blocks
NAM TECH GROUP, CORP.
5 (1)
Indicador de detección de Order Blocks multitimeframe para MT4. Características - Panel de control totalmente personalizable, proporciona una interacción completa. - Oculta y muestra el panel de control donde quieras. - Detecta OB en múltiples marcos de tiempo. - Permite seleccionar la cantidad de OB para mostrar. - Interfaz de usuario de diferentes OBs. - Diferentes filtros de OBs (regulares, rejection y sin capitalizar). - Alerta de proximidad de OBs. - Líneas ADR High y Low. - Servicio de not
RelicusRoad Pro
Relicus LLC
4.73 (141)
Ahora $ 147 (aumentando a $ 499 después de algunas actualizaciones) - Cuentas ilimitadas (PC o Mac) Manual de usuario de RelicusRoad + Videos de capacitación + Acceso al grupo privado de Discord + Estado VIP UNA NUEVA MANERA DE VER EL MERCADO RelicusRoad es el indicador comercial más poderoso del mundo para divisas, futuros, criptomonedas, acciones e índices, y brinda a los comerciantes toda la información y las herramientas que necesitan para mantenerse rentables. Brindamos análisis téc
PZ Trend Trading
PZ TRADING SLU
4.8 (5)
Trend Trading es un indicador diseñado para sacar el máximo provecho posible de las tendencias que tienen lugar en el mercado, mediante el cronometraje de retrocesos y rupturas. Encuentra oportunidades comerciales al analizar qué está haciendo el precio durante las tendencias establecidas. [ Guía de instalación | Guía de actualización | Solución de problemas | FAQ | Todos los productos ] Opere en los mercados financieros con confianza y eficiencia Aproveche las tendencias establecidas sin s
TPSpro RFI Levels
Roman Podpora
4.83 (24)
反转第一脉冲水平 (RFI)     指示     俄羅斯     -        ESP   Recomendamos utilizar con   el indicador -   TPSpro 趋势专业版 -   MT5版本 Un elemento clave importante en el comercio son las zonas o niveles a partir de los cuales se toman decisiones para comprar o vender un instrumento comercial. A pesar de los intentos de los grandes actores de ocultar su presencia en el mercado, inevitablemente dejan rastros. Nuestra tarea era aprender a encontrar estos rastros e interpretarlos correctamente. Funciones principales:
Break and Retest
Mohamed Hassan
4.17 (18)
This Indicator only places quality trades when the market is really in your favor with a clear break and retest. Patience is key with this price action strategy! If you want more alert signals per day, you increase the number next to the parameter called: Support & Resistance Sensitivity.  After many months of hard work and dedication, we are extremely proud to present you our  Break and Retest price action indicator created from scratch. One of the most complex indicators that we made with ove
Order Block Hunter
Noha Mohamed Fathy Younes Badr
5 (2)
Order block hunter indicator is the best indicator for  hunt the order blocks that area where there has been a large concentration of limit orders waiting to be executed Order blocks are identified on a chart by observing previous price action and looking for areas where the price experienced significant movement or sudden changes in direction .This indicator does that for you by using very complicated codes and helps you to take the best areas To buy and sell because it make marks at the best a
Scalper Vault
Oleg Rodin
5 (29)
Scalper Vault es un sistema profesional de reventa que le brinda todo lo que necesita para una reventa exitosa. Este indicador es un sistema comercial completo que puede ser utilizado por operadores de divisas y opciones binarias. El marco de tiempo recomendado es M5. El sistema le proporciona señales de flecha precisas en la dirección de la tendencia. También le proporciona señales superiores e inferiores y niveles de mercado de Gann. Los indicadores proporcionan todo tipo de alertas, incluidas
IX Power MT4
Daniel Stein
5 (6)
IX Power lleva por fin la insuperable precisión de FX Power a los símbolos que no son de Forex. Determina con exactitud la intensidad de las tendencias a corto, medio y largo plazo de tus índices, acciones, materias primas, ETF e incluso criptodivisas favoritas. Puede analizar todo lo que su terminal le ofrece. Pruébalo y experimenta cómo tu timing mejora significativamente a la hora de operar. Características principales de IX Power Resultados de cálculo 100% precisos y sin repintado -
Dibuja automáticamente los niveles de soporte y resistencia MÁS los gaps de las velas de propulsión en su gráfico, para que pueda ver hacia dónde es probable que el precio se dirija a continuación y/o potencialmente retroceda. Este indicador está diseñado para ser utilizado como parte de la metodología de negociación de posiciones que se enseña en mi sitio web (The Market Structure Trader) y muestra información clave para la orientación y entradas potenciales. Hay 2 características PRINCIPA
M1 Arrow
Oleg Rodin
4.73 (15)
Una estrategia intradía basada en dos principios fundamentales del mercado. El algoritmo se basa en el análisis de volúmenes y ondas de precios utilizando filtros adicionales. El algoritmo inteligente del indicador da una señal solo cuando dos factores de mercado se combinan en uno. El indicador calcula ondas de cierto rango en el gráfico M1 utilizando los datos del marco de tiempo más alto. Y para confirmar la onda, el indicador utiliza el análisis por volumen. Este indicador es un sistema come
Conviértase en un Breaker Trader y obtenga beneficios de los cambios en la estructura del mercado a medida que se invierte el precio. El indicador de ruptura de bloque de órdenes identifica cuándo una tendencia o movimiento de precio se acerca al agotamiento y está listo para revertirse. Le alerta sobre cambios en la estructura del mercado que generalmente ocurren cuando una reversión o un retroceso importante están a punto de suceder. El indicador utiliza un cálculo patentado que identific
Otros productos de este autor
True Momentum
Safwan Rushdi Khalil Arekat
5 (6)
This indicator represents a genuine momentum oscillator according to the true definition of "Momentum", and as realised by the techniques of digital filtering. ( Note : download a complete set of true momentum oscillators  here ). A scholarly paper on the subject   by the current developer can be found here , but in this description we shall borrow only the minimum of conceptual and mathematical framework needed. In the process, we expose some long-held myths about indicators supposedly measurin
FREE
Top Gun Oscillators
Safwan Rushdi Khalil Arekat
5 (3)
Note : New in 1.6: the indicator now exports the trade signal (but not displayed). Go long with light blue. Go short with red. Exit otherwise. Signal to be imported to your EA using iCustom. This indicator provides Best of the Best linear filter momentum oscillators that I am aware of (Low Pass Differentiators, LPD's) . All of them are  recent developments by this developer, or other researchers. The oscillator line is the first buffer of the indicator, and can be called  in other indicators or
FREE
Volatility Limit Trend
Safwan Rushdi Khalil Arekat
5 (1)
Volatility Limit Trend Indicator (VLT), an original indicator by this developer,  is a trend indicator based on setting a fixed volatility limit as a percentage of price. Volatile price is allowed to wander between two channel lines defining the fixed volatility about a central line. The price crossing one of the channel lines defines an exceeding of the allowed volatility, and ushering in one of two situation : either a continuation or a reversal of trend. The first buffer of the indicator (not
FREE
Latest Changes in 1.6 :  Added Signal Modes input. Mode 1 : HPF positive go long blue, HPF negative go short red. Mode 2 : slow envelope only, HPF above upper envelope go long blue, HPF below lower envelope go short red. Mode 3 : HPF above both upper envelopes - go long blue, HPF below both lower envelopes go short red. Mode 4 : Go long blue if HPF crosses above upper slow, but fast upper should be below slow upper at the time, exit when HPF crosses below upper fast, reverse logic for short re
FREE
Price Change Distributions
Safwan Rushdi Khalil Arekat
This indicator demonstrates that the price change of financial instruments is NOT a random walk process, as advocated by the "Random Walk Hypothesis", and as popularised by the bestselling book "A Random Walk Down Wall Street". I wish that were the case!  It is shown here that the real situation with price change is actually much worse than a random walk process!  Deceptive market psychology, and the bulls-bears tug of war, stack up the odds against traders in all instruments, and all time frame
FREE
High Pass Filter Candlesticks
Safwan Rushdi Khalil Arekat
This indicator applies the  biquad high pass filter to the price-chart data, and displays the filter output for the OHLC as candlesticks. The candlesticks corresponds to the actual calculations of the filter value  during the formation of each price bar (not from all historical highs lows or closes). The shape of the bars therefore corresponds directly to the shape of each price bar. High pass filters are an underappreciated type of oscillator that are seldom used in technical analysis in the st
FREE
Discrete Fourier Transform of Price
Safwan Rushdi Khalil Arekat
5 (1)
This indicator is a useful tool for visualising cyclic components in price. It calculates the Discrete Fourier Transform (DFT) of a price chart data segment selected by the user. It displays the cycles, the spectrum and the synthesised signal in a separate window.  The indicator is intended as a learning tool only, being unsuitable for providing actual trade signals. Download the file -  it is a free toy. Play with it to understand how signals can be transformed by controlling their cyclic comp
FREE
Commodity Channel Index Corrected
Safwan Rushdi Khalil Arekat
5 (1)
This indicator resolves an unrecognised defect in the Commodity Channel Index Oscillator (CCI). The CCI is based on a high pass filter calculated by subtracting the p-period simple moving average of a price signal (usually typical value) from the price signal itself. Then, the result is divided by the absolute mean deviation of the same period. The frequency response of a signal minus its simple moving average is shown in the first screen shot (in Blue). (see my free indicator : Q n D Frequency
FREE
This indicator does not process the price chart data and does not provide trading signals. Instead, it is  an application to compute and display the frequency response of many conventional indicators. Moving averages like the SMA, LWMA and EMA, and  oscillators like the MACD, CCI, Awsome Osc, all have the form of digital filters. Electronic engineers use a special method to characterise the performance of these filters by studying their frequency response. Two important quantities of the frequ
FREE
Jerk Indicator
Safwan Rushdi Khalil Arekat
5 (1)
In physics, "Jerk" is the third time-derivative of position, with acceleration being the second derivative and velocity the first derivative. In technical analysis, the first derivative of price is the price momentum, with the second derivative,acceleration, being seldom used and the third derivative virtually unknown. The magnitude frequency response of a digital differentiator is a positive-slope straight line passing through zero frequency. Therefore, every instance of a digital signal differ
FREE
MUST READ CAUTION BEFORE PURCHASE This  one-of-a-kind indicator displays the instantaneous high resolution High Time Frame Relative Strength Index  (HTF RSI), where  up to three higher time-frame RSI's can be displayed simultaneously on the current chart. The indicator differs drastically from previous multi-time-frame RSI indicators in that it displays  the high resolution bar-by-bar calculation of the HTF RSI - and not just the discrete values at the HTF bar closings. This allows for earlier
Filtro:
No hay comentarios
Respuesta al comentario