• Información general
  • Comentarios (1)
  • Discusión (1)
  • Novedades

Candle Colors

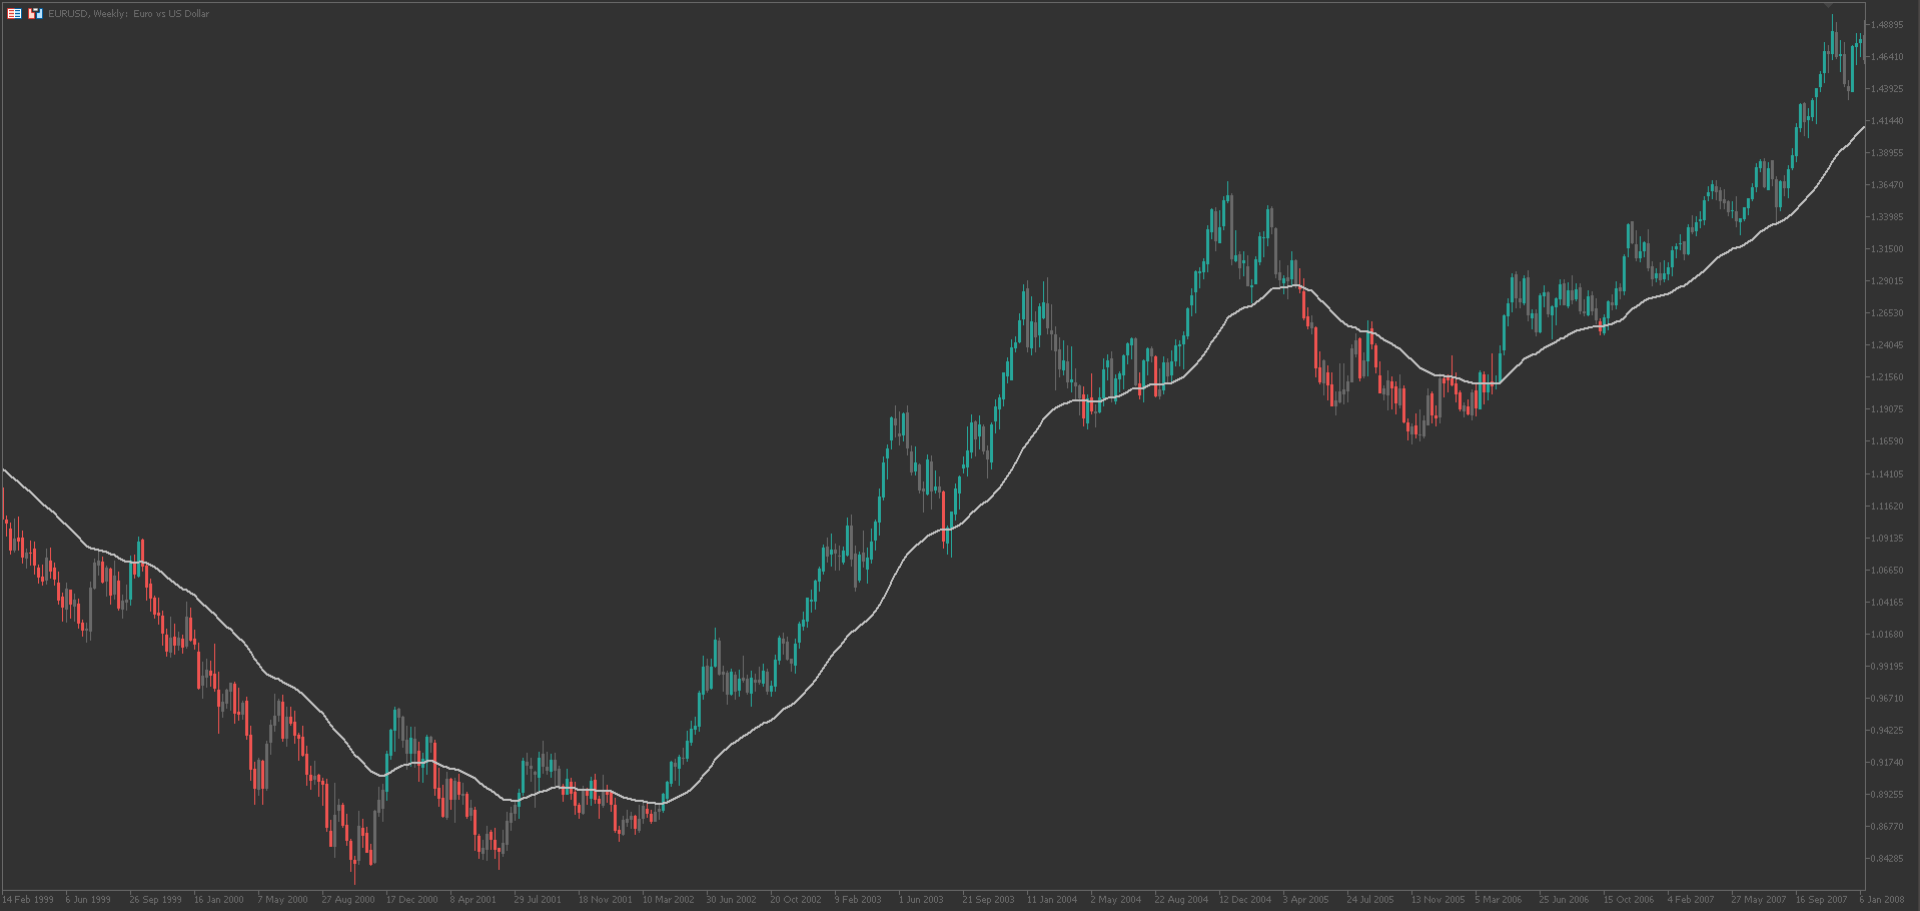
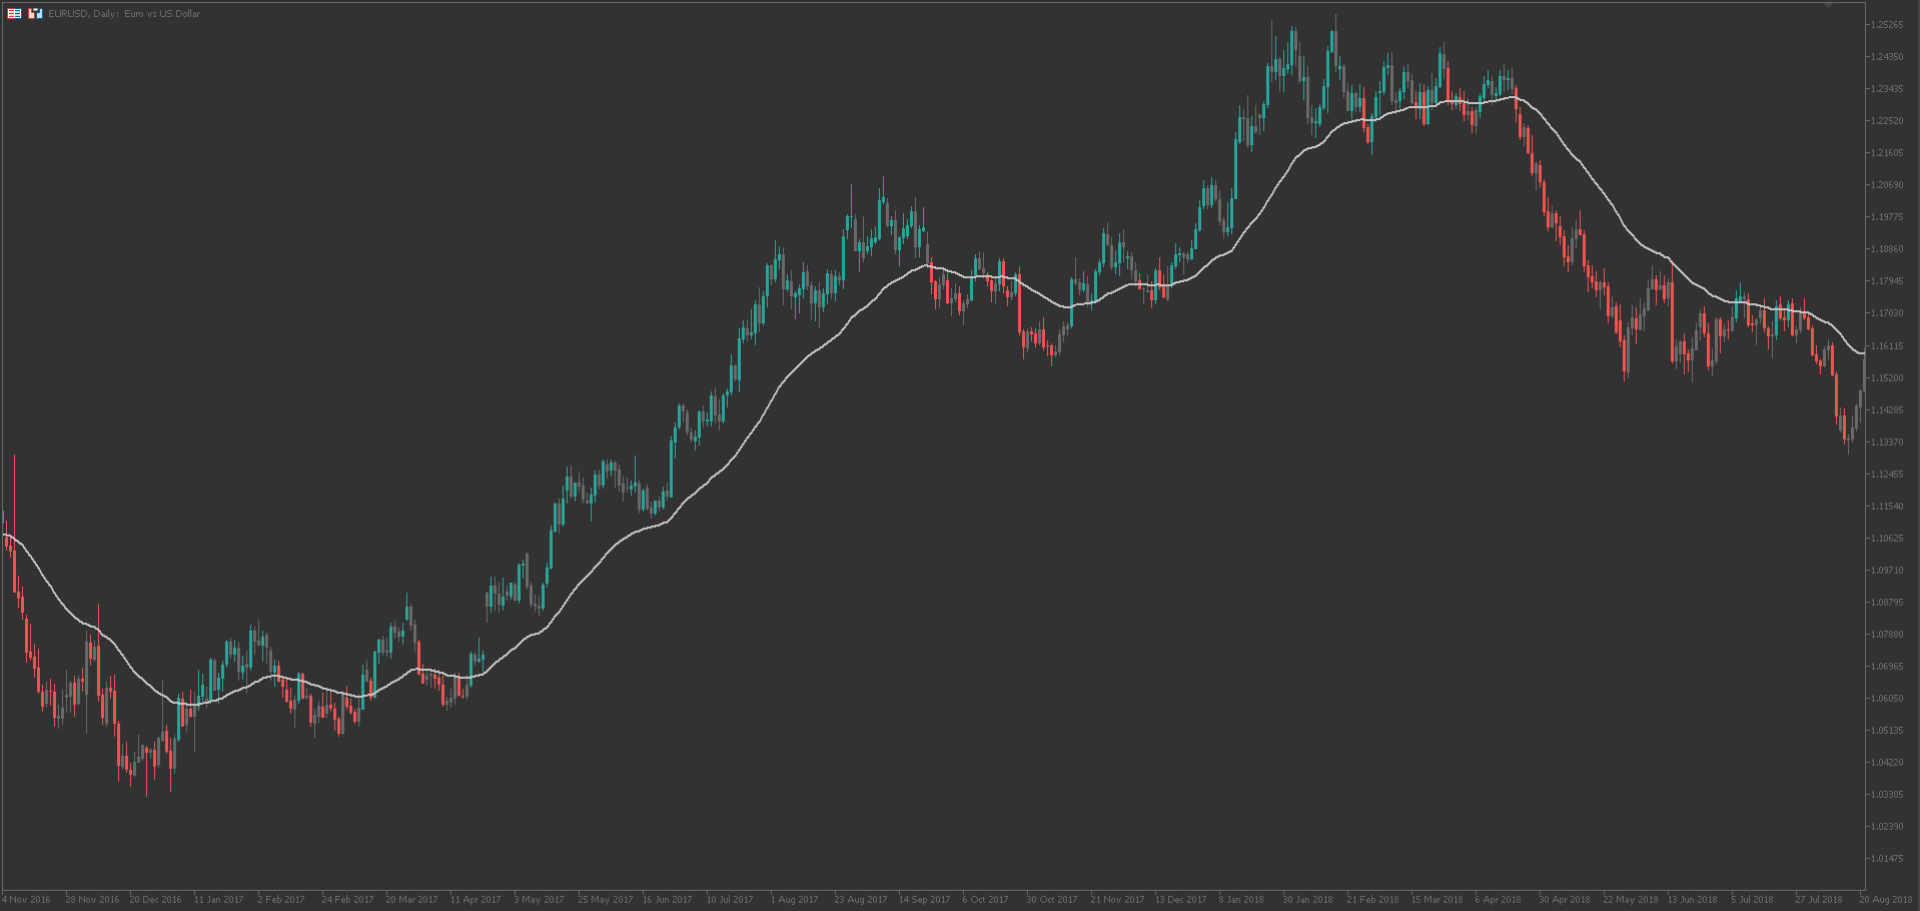
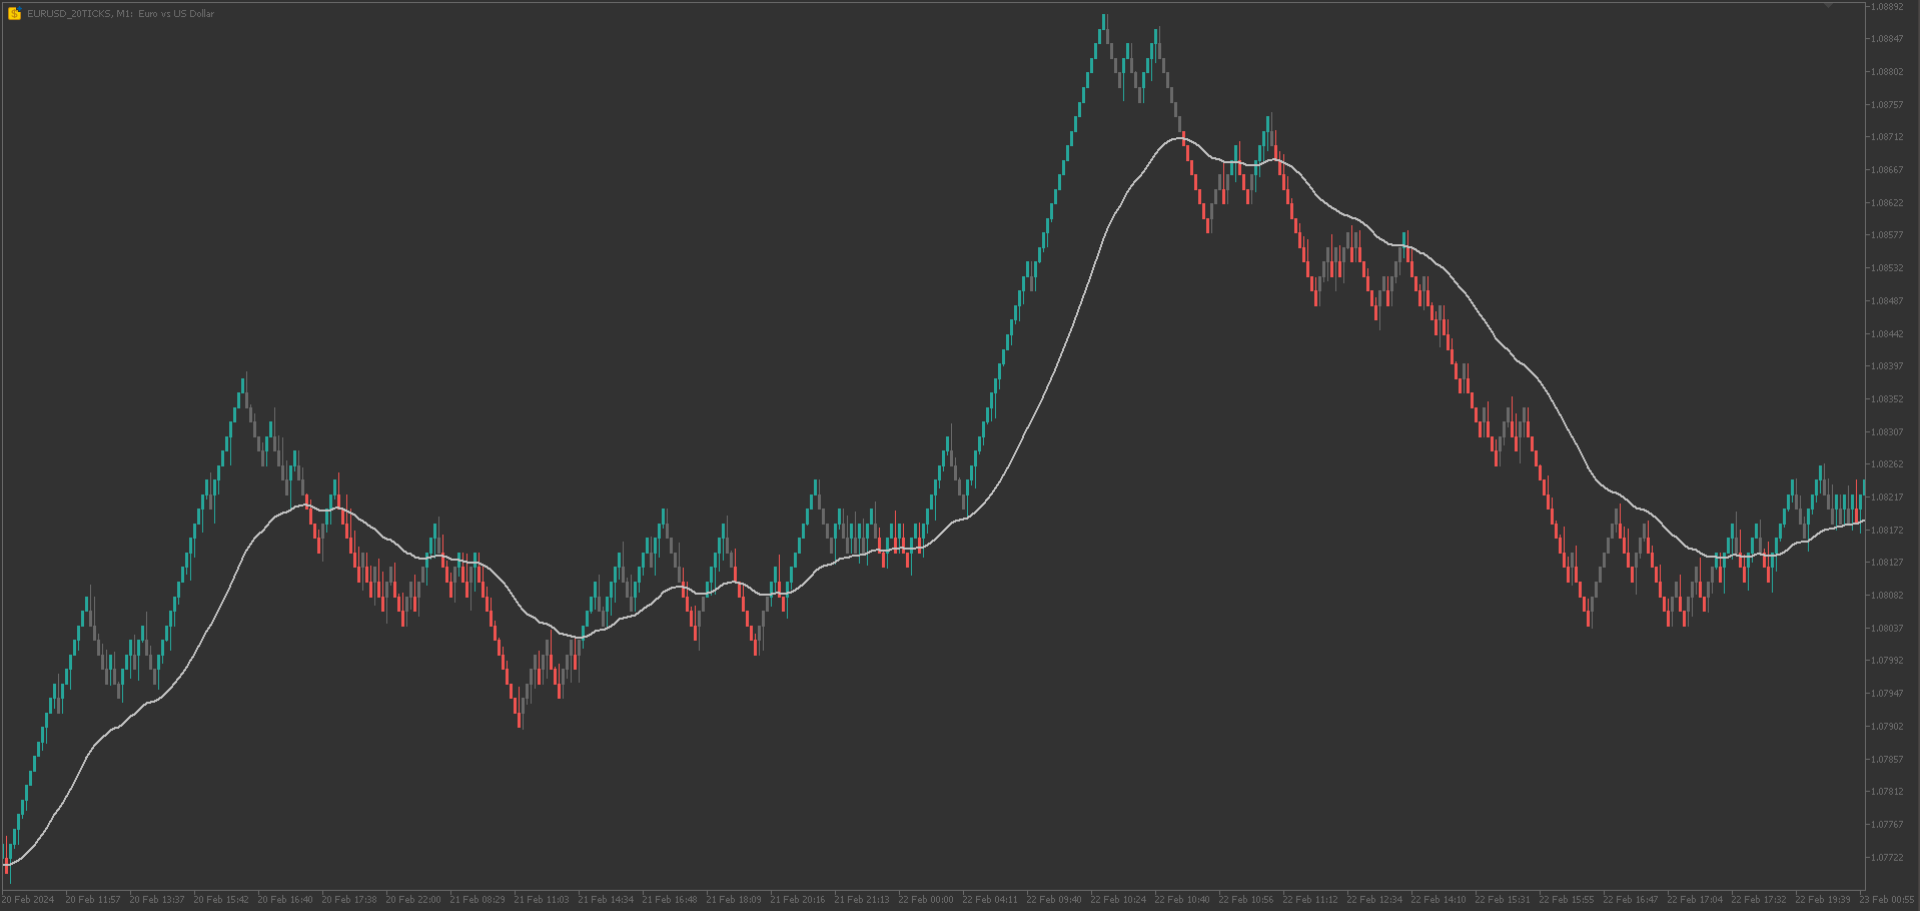
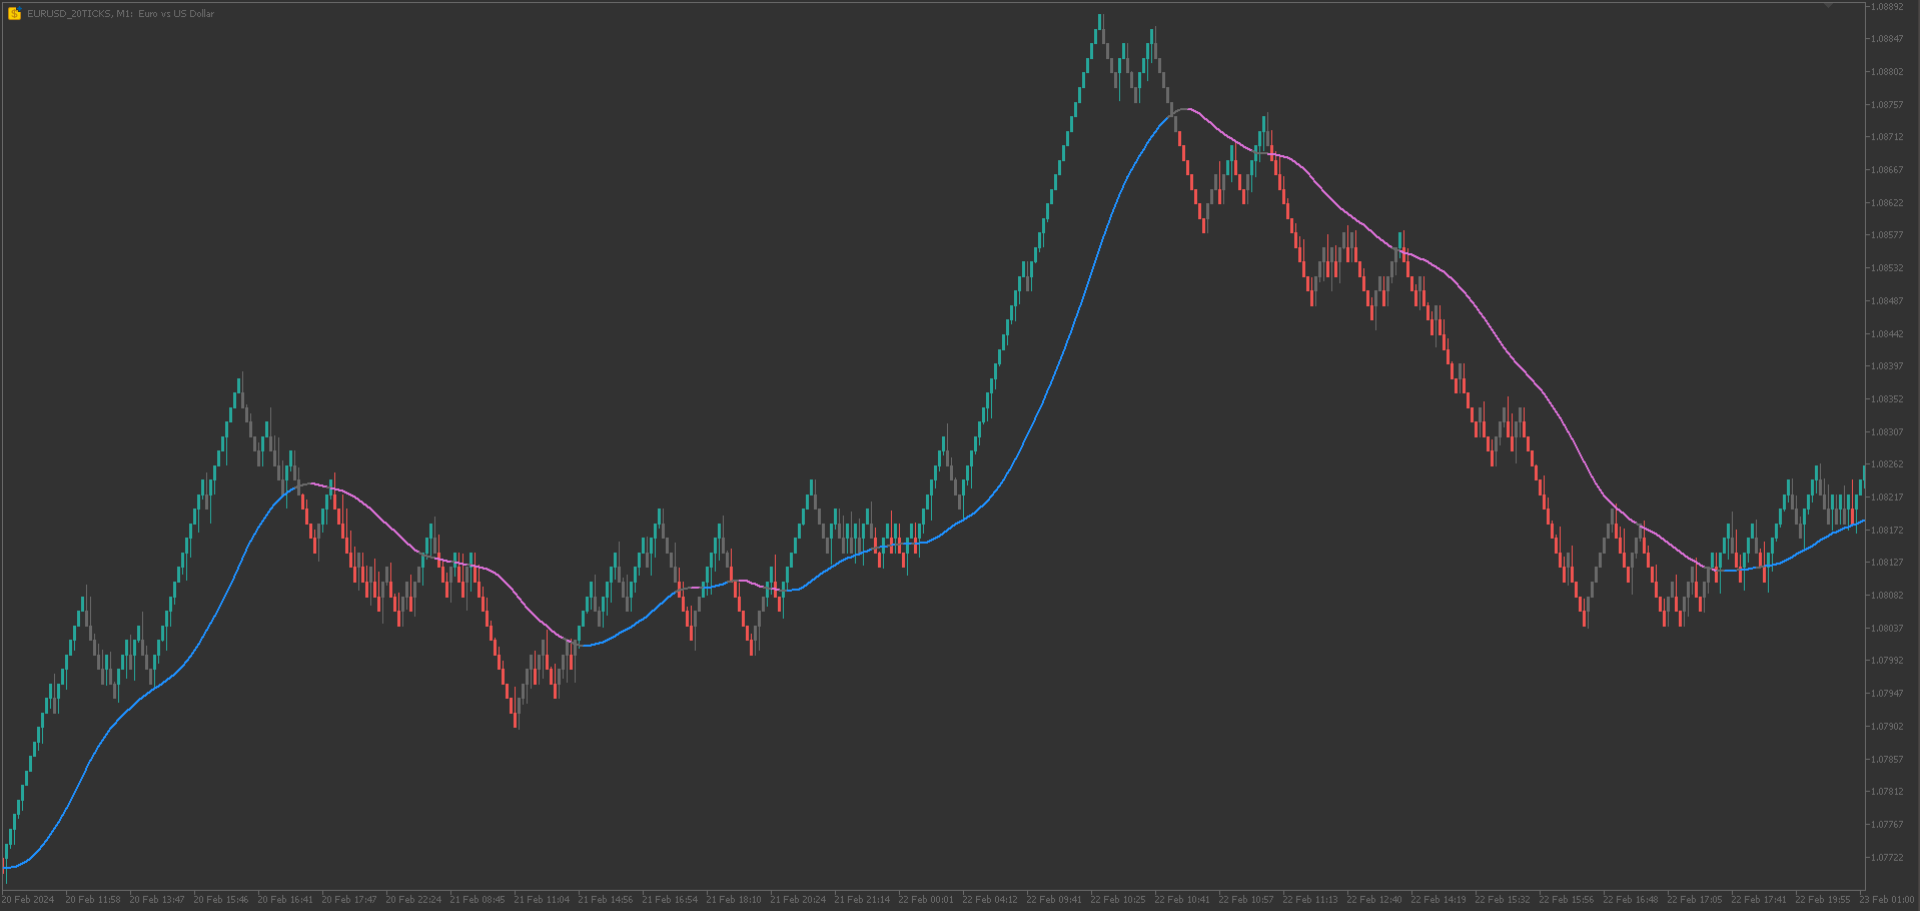
The Color Candles Indicator uses custom colors to highlight candles that follow the main market trend, based on the Moving Average. This simplifies the analysis of price movements, making it clearer and more direct.
  • When the price is above the rising Moving Average, candles are highlighted indicating a BUY opportunity.
  • When the price is below the declining Moving Average, candles are highlighted indicating a SELL opportunity.
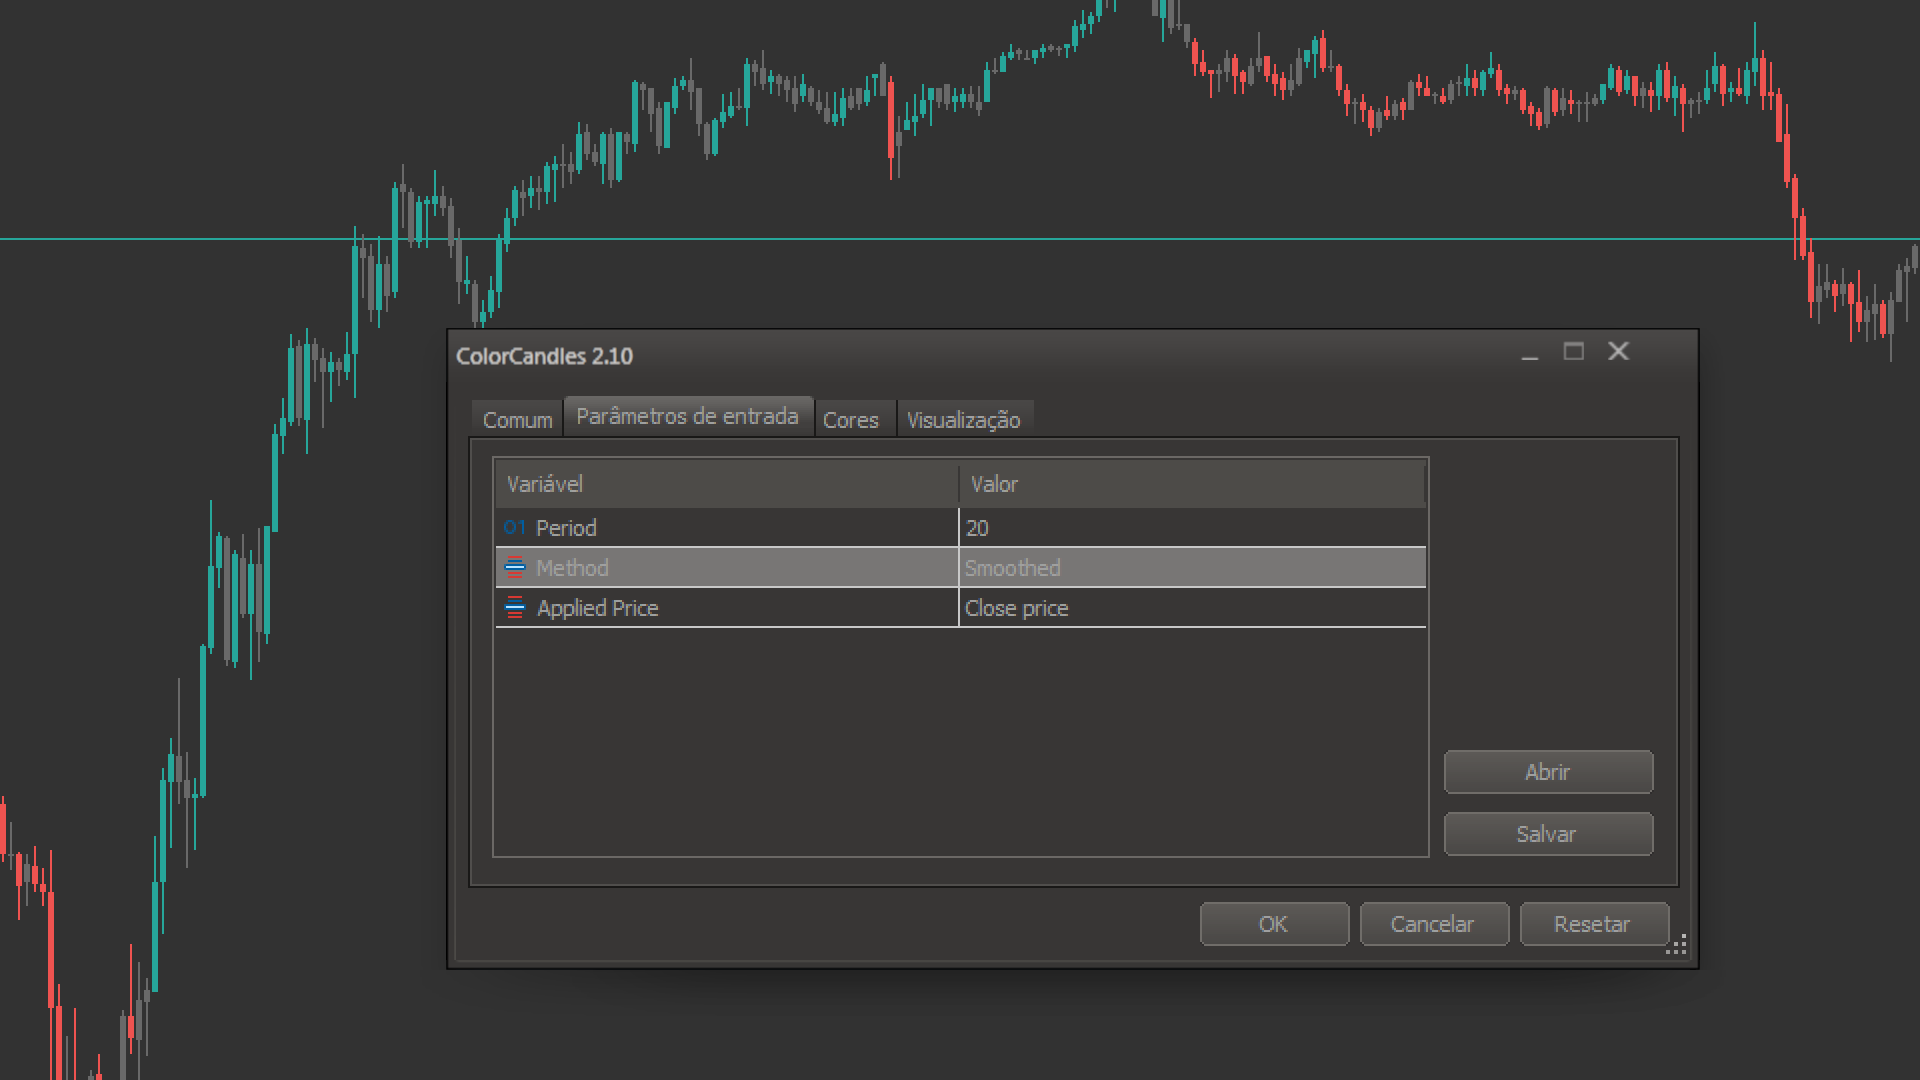

Input Parameters:

  • Period
  • Method
  • Applied Price


    The moving averages were included in the chart only to illustrate the calculation of the indicator and suggest their use together.


    Productos recomendados
    Big data Triple Average
    Cesar Afif rezende Oaquim
    This project did not reach the basic funding number, so I am abandoning it momentarily. The system is now free for other traders to continue the idea. You can follow my new project through my signals. A tool for institutional investor, now avaliable for Home users. We equip you like banks equip their analysts! How it works Focused on the Forex market, it takes advantage of the need of nations to control the value of their currency and the world exchange variations to analyze, through the
    FREE
    Tick Bars
    Henrique Helmuth Kreutz Pfeifer
    Indicator that show candlestick bars with an different sampling method than time fixed. Real time data is sourced to the indicator and it may be used as substitute of the default graph. Each bar is formed when a predefined amount of ticks is received, showing in the graph the OHLC of this clusteri of ticks. The input variable is the amount of ticks of each bar. It's a different approach of sampling, the amount of bars is proportional to the amount of negotiations insted of a sample in a fixed am
    FREE
    Value Chart Candlesticks
    Flavio Javier Jarabeck
    4.7 (10)
    The idea of a Value Chart indicator was presented in the very good book I read back in 2020 , " Dynamic Trading Indicators: Winning with Value Charts and Price Action Profile ", from the authors Mark Helweg and David Stendahl. The idea is simple and the result is pure genius: Present candlestick Price analysis in a detrended way! HOW TO READ THIS INDICATOR Look for Overbought and Oversold levels. Of course, you will need to test the settings a lot to find the "correct" one for your approach.
    FREE
    FractalEfficiencyIndicator   A ratio between 0 and 1 with the higher values representing a more efficient or trending market,  It is used in the calculation of Perry J. Kaufman Adaptive Moving Average (KAMA), dividing the price change over a period by the absolute sum of the price movements that occurred to achieve that change. The Fractal Efficiency or also known as Efficiency Ratio was first published by Perry J. Kaufman in his book   ‘Smarter Trading‘. This is mostly considered a filter for v
    FREE
    Indicators are professional data statistics, position orders, historical order analysis->>>>>> <This version is in Chinese -> English version please move> Necessary for traders: tools and indicators Waves automatically calculate indicators, channel trend trading Perfect trend-wave automatic calculation channel calculation , MT4 Perfect trend-wave automatic calculation channel calculation , MT5 Local Trading copying Easy And Fast Copy , MT4 Easy And Fast Copy , MT5 Local Trading copying For DE
    FREE
    AvgVolumes
    Marco Montemari
    5 (2)
    This indicator is based on Volumes standard indicator, calculates the average of Volumes based on the last N bars set by users, and if the value of the volume is bigger then a set % respect the average a different color will be used. The indicator is shown in a separate indicator window. This version has now a limitation in setting the % about the threshold. If you are interested to set threshold consider to buy the PRO version ( https://www.mql5.com/en/market/product/35925 ) If you want to use
    FREE
    Market Profile 3 ForexArby com
    Hussien Abdeltwab Hussien Ryad
    4.17 (12)
    Market Profile 3 MetaTrader 5 indicator  version 4.70— is a classic Market Profile implementation that can show the price density over time, outlining the most important price levels, value area, and control value of a given trading session. This indicator can be attached to timeframes between M1 and D1 and will show the Market Profile for daily, weekly, monthly, or even intraday sessions. Lower timeframes offer higher precision. Higher timeframes are recommended for better visibility. It is als
    FREE
    BoxInside MT5
    Evgeny Shevtsov
    5 (4)
    This indicator calculates the volume profile and places labels that correspond to the VAH, VAL and POC levels, for each candle individually. Indicator operation features The indicator works on the timeframes from M3 to MN, but it uses the history data of smaller periods: M1 - for periods from M3 to H1, M5 - for periods from H2 to H12, M30 - for the D1 period, H4 - for the W1 period, D1 - for the MN period. The color and location of the VAL, VAH and POC labels on the current candle are consider
    FREE
    FRB Support and Resistance
    Fernando Baratieri
    5 (2)
    FRB Trader - Our mission is to provide the best support to customers through conted and tools so that they can achieve the expected results FRB Support and Resistance - Indicator places lines on the chart to show Support and Resistance regions. - You can choose the timeframe you want to calculate, as well as the colors of the lines. - Algorithm calculates the points where the strengths of the asset are considered and are extremely important for decision making.
    FREE
    KeltnerChannelIndicatorMT5
    Todd Terence Bates
    3 (2)
    The Keltner Channel is a volatility-based technical indicator composed of three separate lines. The middle line is an exponential moving average (EMA) of the price. Additional lines are placed above and below the EMA. The upper band is typically set two times the Average True Range (ATR) above the EMA, and the lower band is typically set two times the ATR below the EMA. The bands expand and contract as volatility (measured by ATR) expands and contracts. Since most price action will be encompasse
    FREE
    ChannelRSI5
    Iurii Tokman
    5 (4)
    ChannelRSI5   El indicador de índice de fuerza relativa (RSI) con niveles dinámicos de zonas de sobrecompra y sobreventa. Los niveles dinámicos cambian y se ajustan a los cambios actuales en el indicador y los precios, y representan una especie de canal. Configuración del indicador period_RSI: período promedio para calcular el índice RSI. apply_RSI: el precio aplicado. Puede ser cualquiera de las constantes de precio: PRICE_CLOSE: precio de cierre, PRICE_OPEN: precio de apertura, PRICE_HIGH: p
    FREE
    Introduction This indicator detects volume spread patterns for buy and sell opportunity. The patterns include demand and supply patterns. You might use each pattern for trading. However, these patterns are best used to detect the demand zone (=accumulation area) and supply zone (=distribution area). Demand pattern indicates generally potential buying opportunity. Supply pattern indicates generally potential selling opportunity. These are the underlying patterns rather than direct price action. T
    FREE
    Gm Volumes
    Antonio Augusto Barreto De Melo
    4.2 (5)
    ¡Un simple indicador de volumen según el color de la vela! - ¡Fondo personalizado! - Soporta volumen por garrapatas o volumen real. El indicador de Volumen de Metatrader original no muestra los colores de la barra según el color de la Vela, solo cambia de color cuando el volumen de una vela es mayor que el anterior, esto a veces crea confusión para los principiantes y no conoce la real motivo del cambio de color. Indicador gratuito, ¡el soporte puede tardar un poco en responder!
    FREE
    ColorBars Indicator
    MetaQuotes Ltd.
    4.4 (5)
    The ColorBars Indicator paints bars with different colors depending on the volume changes. If the volume has increased, the color is green, overwise the color is red.
    FREE
    PZ The Zone MT5
    PZ TRADING SLU
    5 (1)
    This indicator displays buy or sell signals according to Bill Williams' definition of the Trading Zone. [ Installation Guide | Update Guide | Troubleshooting | FAQ | All Products ] Easy to use and understand Avoid trading flat markets Deterministic indicator with clear rules The indicator is non-repainting It implements alerts of all kinds It has straightforward trading implications. A blue arrow is a buy signal A red arrow is a sell signal According to Bill Williams trading in the zone helps t
    FREE
    Aggression Volume
    Flavio Javier Jarabeck
    3.91 (22)
    Aggression Volume Indicator is the kind of indicator that is rarely found in the MQL5 community because it is not based on the standard Volume data provided by the Metatrader 5 platform. It requires the scrutiny of all traffic Ticks requested on the platform... That said, Aggression Volume indicator requests all Tick Data from your Broker and processes it to build a very special version of a Volume Indicator, where Buyers and Sellers aggressions are plotted in a form of Histogram. Additionally,
    FREE
    The indicator draws a normal chart by coloring it in colors based on prices calculated by the Heiken Ashi indicator algorithm. That is, the shape of the candles does not change. In fact, this is the same Heiken Ashi that does not distort the price chart. Then there will be a drawing of a cat, because there is nothing more to write about the indicator. .                                                       
    FREE
    MW Volume
    Martin Bittencourt
    4 (5)
    El indicador de volumen Martinware traza un promedio móvil coloreado sobre las barras de volumen. La coloración utiliza tres colores y puede hacerse de diferentes maneras elegibles por el usuario y se aplica tanto al promedio como a las barras de volumen. Son posibles tres tipos de coloración: Ninguno: no se realiza ninguna coloración Aumentando o disminuyendo: cambia el color dependiendo de que el valor actual sea mayor o menor que el anterior Volumen relativo al promedio: los colores varí
    FREE
    Trend check USDCHF
    Vladimir Gotsulenko
    3.33 (6)
    This indicator gives full information about the market state: strength and direction of a trend, volatility and price movement channel. It has two graphical components: Histogram: the size and the color of a bar show the strength and direction of a trend. Positive values show an ascending trend and negative values - a descending trend. Green bar is for up motion, red one - for down motion, and the yellow one means no trend. Signal line is the value of the histogram (you can enable divergence sea
    FREE
    RSI Currencies MT5
    Fabio Cavalloni
    5 (1)
    RSI Currencies is an indicator that is based on the RSI concept but with a totally different approach. It calculates its values calculating all RSI values of all pairs related to the same currency and making an average between them: the goal is to obtain a more solid and trustable information about what each currency are doing lowering the impact of market noise and extreme euphory on a particular pair to analyze the whole basket. It works on 28 forex majors and minor pairs related to these curr
    FREE
    Waves Sizer
    Flavio Javier Jarabeck
    3.67 (6)
    Wyckoff fans, enjoy! Ideally to be used with the Weis Waves indicator, but it can be easily used alone, the Waves Sizer puts the range (in resulting Price movement) done by the Price on its market swings. You can control how accurate or loose will be the swings. This tool is very helpful for visually know how much the Price has traveled in your Timeframe. This way you can confront this level of effort with the resulting Volume, etc... Weis Waves indicator: https://www.mql5.com/en/market/pro
    FREE
    Free automatic Fibonacci is an indicator that automatically plots a Fibonacci retracement based on the number of bars you select on the BarsToScan setting in the indicator. The Fibonacci is automatically updated in real time as new highest and lowest values appears amongst the selected bars. You can select which level values to be displayed in the indicator settings. You can also select the color of the levels thus enabling the trader to be able to attach the indicator several times with differe
    FREE
    Are you tired of drawing trendlines every time you're analyzing charts? Or perhaps you would like more consistency in your technical analysis. Then this is for you. This indicator will draw trend lines automatically when dropped on a chart. How it works Works similar to standard deviation channel found on mt4 and mt5. It has 2 parameters: 1. Starting Bar 2. Number of bars for calculation The   starting bar   is the bar which drawing of the trend lines will begin, while the   number of bars for c
    FREE
    The Penta-O is a 6-point retracement harmonacci pattern which usually precedes big market movements. Penta-O patterns can expand and repaint quite a bit. To make things easier this indicator implements a twist: it waits for a donchian breakout in the right direction before signaling the trade. The end result is an otherwise repainting indicator with a very reliable trading signal. The donchian breakout period is entered as an input. [ Installation Guide | Update Guide | Troubleshooting | FAQ | A
    Bidu Position Count
    Victor Borring Vieira
    5 (1)
    Indicador que cria um painel para acompanhamento to total de posições abertas no ativo do gráfivo. São apresentados os dados: Ativo do gráfico Total de posições de venda em aberto Quantidade do volume de posições de venda em aberto Total de posições de compra em aberto Quantidade do volume de posições de compra em aberto. Painel simples mas eficiente para o equilíbrio das ordens
    FREE
    DALA Forecast
    Grigorii Matsnev
    About the indicator: DALA Forecast is a universal tool for predicting the dynamics of time series of any nature. For prediction, modified methods of nonlinear dynamics analysis are used, on the basis of which a predictive model is built using machine learning methods.  To get the trial version of the indicator, you can contact me in private messages. How to use the indicator: Apply the indicator to your chosen financial instrument or indicator with the settings you need. The prediction will b
    FREE
    LT Donchian Channel
    Thiago Duarte
    4.75 (4)
    Donchian Channel is an indicator created by Richard Donchian. It is formed by taking the highest high and the lowest low of the last specified period in candles. The area between high and low is the channel for the chosen period. Its configuration is simple. It is possible to have the average between the upper and lower lines, plus you have alerts when price hits one side. If you have any questions or find any bugs, please contact me. Enjoy!
    FREE
    Laguerre Filter
    Fernando Lahude Ritter
    5 (1)
    Laguerre Indicator with Gamma Input Overview: The Laguerre Indicator is a sophisticated financial analysis tool designed to provide traders and investors with a dynamic and responsive method to track market trends. Its core functionality is centered around a unique algorithm that adapts to market volatility, offering clearer insights compared to traditional indicators. Key Feature - Gamma Input: Gamma: The sole input for the Laguerre Indicator, 'gamma,' plays a pivotal role in calibrating the i
    FREE
    El Capturador de Tendencias: La Estrategia del Capturador de Tendencias con Indicador de Alerta es una herramienta versátil de análisis técnico que ayuda a los traders a identificar las tendencias del mercado y los posibles puntos de entrada y salida. Presenta una Estrategia dinámica del Capturador de Tendencias, adaptándose a las condiciones del mercado para una clara representación visual de la dirección de la tendencia. Los traders pueden personalizar los parámetros para que se ajusten a s
    FREE
    AdaptiveCCiMt5
    Francis Dube
    4 (4)
    The Commodity Channel Index computes the deviation of the typical price of each bar from the average price over a particular time period. Multiplying the median deviation by 0.015 facilitates normalization, which makes all deviations below the first standard deviation less than  -100, and all deviations above the first standard deviation more than 100. This adaptive version is based on the indicator described by John Ehlers, in the book Rocket Science for traders. The indicator uses the homodyne
    FREE
    Los compradores de este producto también adquieren
    Atomic Analyst MT5
    Issam Kassas
    4.78 (18)
    En primer lugar, vale la pena enfatizar que este Indicador de Trading no repinta, no redibuja y no se retrasa, lo que lo hace ideal tanto para el trading manual como para el automatizado. Manual del usuario: configuraciones, entradas y estrategia. El Analista Atómico es un Indicador de Acción del Precio PA que utiliza la fuerza y el impulso del precio para encontrar una mejor ventaja en el mercado. Equipado con filtros avanzados que ayudan a eliminar ruidos y señales falsas, y aumentan el poten
    Primero que todo, vale la pena enfatizar que este Sistema de Trading es un Indicador No Repintado, No Redibujado y No Retrasado, lo que lo hace ideal tanto para el trading manual como para el automatizado. Curso en línea, manual y descarga de ajustes preestablecidos. El "Sistema de Trading Inteligente MT5" es una solución completa de trading diseñada para traders nuevos y experimentados. Combina más de 10 indicadores premium y presenta más de 7 estrategias de trading robustas, lo que lo convie
    Gold Stuff mt5
    Vasiliy Strukov
    4.9 (182)
    Gold Stuff mt5: un indicador de tendencia diseñado específicamente para el oro, también se puede usar en cualquier instrumento financiero. El indicador no se vuelve a dibujar ni se retrasa. El marco de tiempo recomendado es H1. IMPORTANTE! Póngase en contacto conmigo inmediatamente después de la compra para obtener instrucciones y bonificación!   Puede obtener una copia gratuita de nuestro indicador Strong Support y Trend Scanner, por favor envíe un mensaje privado. ¡a mí! PARÁMETROS Draw
    Quantum Trend Sniper
    Bogdan Ion Puscasu
    4.92 (48)
    Introduciendo       Indicador Quantum Trend Sniper   , el innovador indicador MQL5 que está transformando la forma en que identificas y negocias los cambios de tendencia. Desarrollado por un equipo de comerciantes experimentados con experiencia comercial de más de 13 años,       Indicador de francotirador de tendencia cuántica       está diseñado para impulsar su viaje comercial a nuevas alturas con su forma innovadora de identificar cambios de tendencia con una precisión extremadamente alta.
    TPSproTREND PrO MT5
    Roman Podpora
    4.89 (9)
    TPSpro TRENDPRO  - is a trend indicator that automatically analyzes the market and provides information about the trend and each of its changes, as well as giving signals for entering trades without redrawing! The indicator uses each candle, analyzing them separately. referring to different impulses - up or down impulse. Exact entry points into transactions for currencies, crypto, metals, stocks, indices!  -  Version MT4               DETAILED DESCRIPTION               R ecommended to use with
    Trend Screener Pro MT5
    STE S.S.COMPANY
    4.88 (66)
    Desbloquee el poder del comercio de tendencias con el indicador Trend Screener: ¡su solución definitiva para el comercio de tendencias impulsada por lógica difusa y un sistema multidivisa!Mejore su comercio de tendencias con Trend Screener, el revolucionario indicador de tendencias impulsado por lógica difusa. Es un poderoso indicador de seguimiento de tendencias que combina más de 13 herramientas y funciones premium y 3 estrategias comerciales, lo que lo convierte en una opción versátil para co
    FX Power MT5 NG
    Daniel Stein
    5 (6)
    Obtenga su actualización diaria del mercado con detalles y capturas de pantalla a través de nuestro Morning Briefing aquí en mql5 y en Telegram ! FX Power MT5 NG es la nueva generación de nuestro popular medidor de fuerza de divisas, FX Power. ¿Y qué ofrece este medidor de fuerza de nueva generación? Todo lo que le encantaba del FX Power original PLUS Análisis de fuerza de ORO/XAU Resultados de cálculo aún más precisos Períodos de análisis configurables individualmente Límite de cálculo persona
    Este es un genial indicador para MT5 que ofrece señales precisas para entrar en una transacción sin redibujar. Se puede aplicar a cualquier activo financiero: fórex, criptomonedas, metales, acciones, índices. Nos dará valoraciones bastante precisas y nos dirá cuándo es mejor abrir y cerra una transacción. Eche un vistazo  al vídeo  (6:22), ¡contiene un ejemplo de procesamiento de una sola señal que ha amortizado el indicador! La mayoría de los tráders mejoran sus resultados comerciales durante l
    Ante todo, vale la pena enfatizar que esta Herramienta de Trading es un Indicador No Repintado, No Redibujado y No Retrasado, lo que la hace ideal para el trading profesional. Curso en línea, manual del usuario y demostración. El Indicador de Conceptos de Acción del Precio Inteligente es una herramienta muy potente tanto para traders nuevos como experimentados. Combina más de 20 indicadores útiles en uno solo, combinando ideas avanzadas de trading como el Análisis del Trader del Círculo Inte
    Este tablero muestra los últimos   patrones armónicos   disponibles para los símbolos seleccionados, por lo que ahorrará tiempo y será más eficiente /   versión MT4 . Indicador gratuito:   Basic Harmonic Pattern Columnas del indicador Symbol:   aparecerán los símbolos seleccionados Trend :   alcista o bajista Pattern :   tipo de patrón (gartley, mariposa, murciélago, cangrejo, tiburón, cifrado o ABCD) Entry :   precio de entrada SL:   precio de stop loss TP1:   1er precio de toma de benefici
    Introduciendo       Quantum Breakout PRO   , el innovador indicador MQL5 que está transformando la forma en que comercia con Breakout Zones. Desarrollado por un equipo de comerciantes experimentados con experiencia comercial de más de 13 años,       Desglose cuántico PRO       está diseñado para impulsar su viaje comercial a nuevas alturas con su innovadora y dinámica estrategia de zona de ruptura. El indicador de ruptura cuántica le dará flechas de señal en las zonas de ruptura con 5 zonas
    Reversal First Impulse levels (RFI)      INSTRUCTIONS        RUS       -       ENG              R ecommended to use with an indicator   -   TPSpro  TREND PRO -  Version MT4                 A key element in trading is zones or levels from which decisions to buy or sell a trading instrument are made. Despite attempts by major players to conceal their presence in the market, they inevitably leave traces. Our task was to learn how to identify these traces and interpret them correctly. Main functi
    IX Power MT5
    Daniel Stein
    4.17 (6)
    IX Power   lleva por fin la insuperable precisión de FX Power a los símbolos que no son de Forex. Determina con exactitud la intensidad de las tendencias a corto, medio y largo plazo de tus índices, acciones, materias primas, ETF e incluso criptodivisas favoritas. Puede   analizar todo lo   que su terminal le ofrece. Pruébalo y experimenta cómo   tu timing mejora significativamente   a la hora de operar. Características principales de IX Power Resultados de cálculo 100% precisos y sin rep
    AT Forex Indicator MT5
    Marzena Maria Szmit
    5 (4)
    The AT Forex Indicator MT5 is a sophisticated trading tool designed to provide traders with a comprehensive analysis of multiple currency pairs. This powerful indicator simplifies the complex nature of the forex market, making it accessible for both novice and experienced traders. AT Forex Indicator uses advanced algorithms to detect trends, patterns and is an essential tool for traders aiming to enhance their forex trading performance. With its robust features, ease of use, and reliable signal
    Gartley Hunter Multi
    Siarhei Vashchylka
    5 (7)
    Gartley Hunter Multi - An indicator for searching for harmonic patterns simultaneously on dozens of trading instruments and on all possible timeframes. Manual (Be sure to read before purchasing) | Version for MT4 Advantages 1. Patterns: Gartley, Butterfly, Shark, Crab. Bat, Alternate Bat, Deep Crab, Cypher 2. Simultaneous search for patterns on dozens of trading instruments and on all possible timeframes 3. Search for patterns of all possible sizes. From the smallest to the largest 4. A
    Atbot
    Zaha Feiz
    5 (3)
    Atbot: Cómo funciona y cómo usarlo Cómo funciona El script "AtBot" es un indicador para la plataforma MT5 que genera señales de compra y venta utilizando varios métodos de análisis técnico. Este indicador utiliza la media móvil simple (SMA), la media móvil exponencial (EMA) y el índice de rango verdadero promedio (ATR) para determinar los puntos de entrada y salida. También tiene la capacidad de usar velas Heikin Ashi para la generación de señales. Cómo usar Agregar el script al gráfico: Primero
    FX Volume MT5
    Daniel Stein
    4.94 (17)
    Obtenga su actualización diaria del mercado con detalles y capturas de pantalla a través de nuestro Morning Briefing aquí en mql5 y en Telegram ! FX Volume es el PRIMER y ÚNICO indicador de volumen que proporciona una visión REAL del sentimiento del mercado desde el punto de vista de un bróker. Proporciona una visión impresionante de cómo los participantes institucionales del mercado, como los brokers, están posicionados en el mercado Forex, mucho más rápido que los informes COT. Ver esta info
    Matrix Arrow Indicator MT5
    Juvenille Emperor Limited
    5 (14)
    Matrix Arrow Indicator MT5   es una tendencia única 10 en 1 que sigue un indicador   100% sin repintado   de marcos temporales múltiples que se puede usar en todos los símbolos/instrumentos:   divisas ,   materias primas ,   criptomonedas ,   índices ,   acciones .  Matrix Arrow Indicator MT5  determinará la tendencia actual en sus primeras etapas, recopilando información y datos de hasta 10 indicadores estándar, que son: Índice de movimiento direccional promedio (ADX) Índice de canales de prod
    Este panel descubre y muestra las zonas de   Oferta   y   Demanda   en el gráfico, tanto en modo scalping como a largo plazo, dependiendo de su estrategia de trading para los símbolos seleccionados. Además, el modo de escáner del tablero le ayuda a comprobar todos los símbolos deseados de un vistazo y no perder ninguna posición adecuada /   Versión MT4 Indicador gratuito:   Basic Supply Demand Características Le permite ver las oportunidades de negociación en   múltiples pares de divisa
    Auto Order Block with break of structure based on ICT and Smart Money Concepts (SMC) Futures Break of Structure ( BoS )             Order block ( OB )            Higher time frame Order block / Point of Interest ( POI )    shown on current chart           Fair value Gap ( FVG ) / Imbalance   -  MTF      ( Multi Time Frame )    HH/LL/HL/LH  -  MTF      ( Multi Time Frame )  Choch  MTF      ( Multi Time Frame )  Volume Imbalance     ,  MTF          vIMB Gap’s Power of 3 Equal High
    Advanced Supply Demand MT5
    Bernhard Schweigert
    4.53 (15)
    ¡Actualmente con 33% de descuento! ¡La mejor solución para cualquier tráder principiante o experto! Este indicador es una herramienta comercial única, de alta calidad y asequible, porque incorpora una serie de características patentadas y una nueva fórmula. Con esta actualización, podrá mostrar zonas de doble marco temporal. No solo podrá mostrar un marco temporal más alto, sino también mostrar ambos, el marco temporal del gráfico MÁS el marco temporal más alto: MOSTRANDO ZONAS ANIDADAS. A todos
    ICT, SMC, SMART MONEY CONCEPTS, SMART MONEY, Smart Money Concept, Support and Resistance, Trend Analysis, Price Action, Market Structure, Order Blocks, BOS/CHoCH,   Breaker Blocks ,  Momentum Shift,   Supply&Demand Zone/Order Blocks , Strong Imbalance,   HH/LL/HL/LH,    Fair Value Gap, FVG,  Premium  &   Discount   Zones, Fibonacci Retracement, OTE, Buy Side Liquidity, Sell Side Liquidity, BSL/SSL Taken, Equal Highs & Lows, MTF Dashboard, Multiple Time Frame, BigBar, HTF OB, HTF Market Structure
    Quantum Heiken Ashi PRO MT5
    Bogdan Ion Puscasu
    4.5 (8)
    Presentamos el   Quantum Heiken Ashi PRO Diseñadas para brindar información clara sobre las tendencias del mercado, las velas Heiken Ashi son reconocidas por su capacidad para filtrar el ruido y eliminar las señales falsas. Diga adiós a las confusas fluctuaciones de precios y dé la bienvenida a una representación gráfica más fluida y confiable. Lo que hace que Quantum Heiken Ashi PRO sea realmente único es su fórmula innovadora, que transforma los datos de velas tradicionales en barras de colore
    Identify key turning points with reliable fractal analysis This indicator examines the price structure of fractals of different periods to determine possible reversal points in the market, providing timing to positional traders that already have a fundamental or technical valuation model. Unlike its younger brother, Reversal Fractals , this indicator won't miss reversals because of the period selected, and will find reversal fractals on a zig-zag fashion, ignoring those reversals which do not
    FxaccurateLS
    Shiv Raj Kumawat
    WHY IS OUR FXACCCURATE LS MT5 THE PROFITABLE ? PROTECT YOUR CAPITAL WITH RISK MANAGEMENT Gives entry, stop and target levels from time to time. It finds Trading opportunities by analyzing what the price is doing during established trends. POWERFUL INDICATOR FOR A RELIABLE STRATEGIES We have made these indicators with a lot of years of hard work. It is made at a very advanced level. Established trends provide dozens of trading opportunities, but most trend indicators completely ignore them!
    Dark Absolute Trend   is an Indicator for intraday trading. This Indicator is based on   Trend Following  strategy but use also candlestick patterns and Volatility. We can enter in good price with this Indicator, in order to follow the main trend on the current instrument. It is advised to use low spread ECN brokers. This Indicator does   Not repaint   and   N ot lag . Recommended timeframes are M5, M15 and H1. Recommended working pairs: All. I nstallation and  Update Guide   -  Troubleshooting
    Black Dragon indicator mt5
    Ramil Minniakhmetov
    4.83 (58)
    El indicador de detección de tendencias complementará cualquier estrategia y también se puede utilizar como una herramienta independiente. Ventajas Fácil de usar, no sobrecarga el gráfico con información innecesaria; Puede usarse como filtro para cualquier estrategia; Tiene niveles integrados de soporte y resistencia dinámicos, que se pueden usar tanto para obtener ganancias como para establecer límites de pérdidas; El indicador no cambia de color después de que se cierra la vela;  Funciona
    El indicador muestra los puntos de entrada y salida más adecuados. También muestra datos estadísticos sobre todas las señales para un mejor análisis de las operaciones. Con la ayuda de este indicador podrá comprender mejor el mercado. Tan pronto como la fuerza de la tendencia comience a debilitarse (esto se mostrará en el panel), la línea de tendencia gravitará hacia la posición horizontal - esta es la señal para salir de la operación. O puede salir cuando se alcance el nivel de beneficio me
    ¿Cansado de trazar líneas de soporte y resistencia? La resistencia de soporte es un indicador de marco de tiempo múltiple que detecta y traza automáticamente los soportes y las líneas de resistencia en el gráfico con un giro muy interesante: a medida que los niveles de precios se prueban con el tiempo y aumenta su importancia, las líneas se vuelven más gruesas y oscuras. [ Guía de instalación | Guía de actualización | Solución de problemas | FAQ | Todos los productos ] Mejora tu análisis técnic
    Próxima generación de zonas de oferta y demanda automatizadas. Algoritmo nuevo e innovador que funciona en cualquier gráfico. Todas las zonas se crean dinámicamente de acuerdo con la acción del precio del mercado. DOS TIPOS DE ALERTAS --> 1)CUANDO EL PRECIO LLEGA A UNA ZONA 2)CUANDO SE FORMA UNA NUEVA ZONA No obtienes un indicador inútil más. Obtiene una estrategia comercial completa con resultados probados.     Nuevas características:     Alertas cuando el precio llega a la z
    Otros productos de este autor
    RenkoChart EA
    Paulo Henrique Da Silva
    4.33 (3)
    The RenkoChart tool presents an innovative and highly flexible approach to visualizing market data in MetaTrader 5. This expert creates a custom symbol with Renko bricks directly on the chart, displaying accurate prices at the respective opening date/time for each brick. This feature makes it possible to apply any indicator to the Renko chart. Furthermore, this tool also allows access to historical brick data through native methods in the MQL5 programming language, such as iOpen, iHigh, iLow and
    FREE
    Color Donchian Channel
    Paulo Henrique Da Silva
    This indicator draws the Donchian Channel, filling the background with colors. The color of the middle line is changed following the current trend, based on the standard interpretation of the Donchian Channel. Input Parameters: Period of the Channel   (default is 20) Validate Signals   (boolean value to filter out false breakouts, default is false) Background Settings Show Background   (default is true) U ptrend Color (default is DodgerBlue ) Downtrend Color (default is Orchid) Background Tr
    FREE
    Color SAR
    Paulo Henrique Da Silva
    5 (1)
    This indicator draws the Parabolic SAR. Top and bottom lines with customizable colors. With an additional parameter called “Validate Signals”, which identifies false breakouts and changes the color of the line to gray. Input Parameters: Step ( default is 0.02 ) Maximum   ( default is 0.2 ) Applied Price High  ( default is High price) Applied Price Low  (default is Low price) Validate Signals   (boolean value to filter out false breakouts, default is true)
    FREE
    Timeframe On Chart
    Paulo Henrique Da Silva
    A simple indicator/tool to display the current timeframe in the center of the chart. The object is automatically moved to the center of the chart whenever the chart size is changed by the user. Input  Parameters : Font (default is Arial Black) Font Size (default is 50) Font Color (default is Silver, for light theme graphics, change to black or another dark color) Font Transparency (default is 90%)
    FREE
    Filtro:
    Bianca Dantas
    24
    Bianca Dantas 2023.02.14 19:18 
     

    El usuario no ha dejado ningún comentario para su valoración

    Respuesta al comentario
    Versión 2.10 2024.03.10
    New version available!
    Versión 2.0 2024.02.08
    New version available!