• Información general
  • Comentarios
  • Discusión
  • Novedades

UR Gamma

Gama UR
(impulsado por cálculos similares que se encuentran en los sistemas de aprendizaje automático)

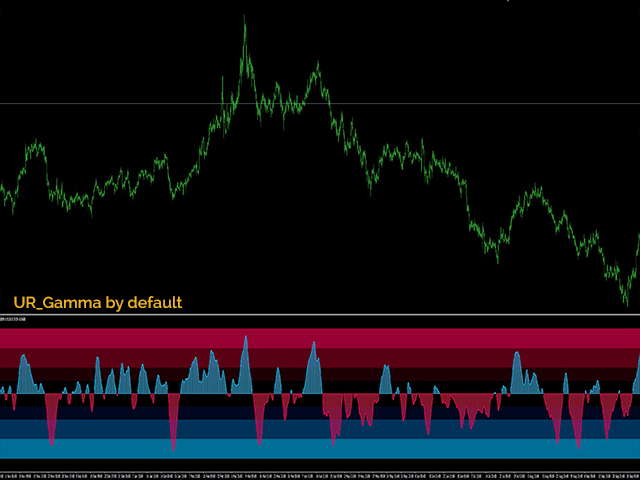
UR Gamma es una herramienta de análisis financiero de vanguardia que ofrece una versión nueva y mejorada del indicador clásico WaveTrend. Al incorporar técnicas avanzadas de procesamiento de señales digitales, UR Gamma aborda algunas de las limitaciones de los algoritmos WaveTrend tradicionales y brinda un enfoque más preciso, sólido y dinámico para identificar y medir tendencias en la acción del precio.

Ventajas de utilizar UR Gamma:

Configuración minimalista
Todos los datos se calculan en segundo plano, con solo 1 salida para el usuario, clara y ordenada.
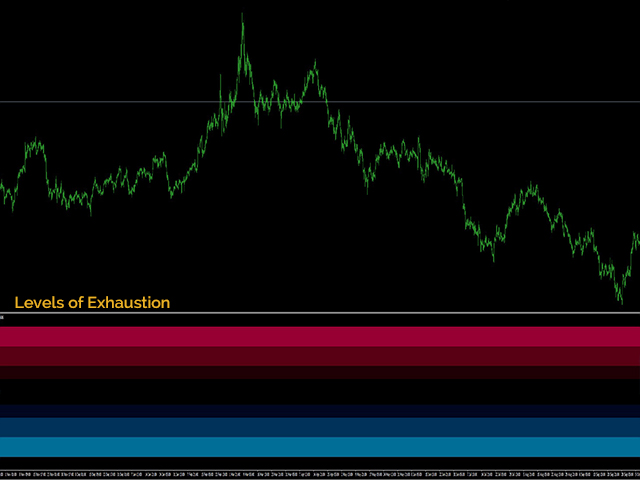
Niveles de fondo para sugerir agotamiento
Ajustado a todo tipo de activos.
¡Hay un chat especial de Telegram en el que puede mantenerse actualizado con las actualizaciones de herramientas y también enviar una solicitud si siente que falta algo!


¿Por qué UR Gamma?

El objetivo es que la distribución de probabilidad oscile entre -1 y 1, con 0 como punto medio. Para lograr esto, se utiliza una técnica de Machine Learning llamada función de activación para transformar los datos. Una de estas funciones es la función tangente hiperbólica, que a menudo se usa en redes neuronales porque mantiene valores entre -1 y 1. Al tomar la primera derivada de los datos de entrada y normalizarla usando la media cuadrática, la función tanh redistribuye efectivamente la entrada. señal en el rango deseado de -1 a 1.

UR Gamma es una poderosa herramienta para comerciantes e inversores, que les brinda una visión más completa, confiable y procesable de las tendencias del mercado y los movimientos de precios. El algoritmo también se puede adaptar para su uso en múltiples períodos de tiempo y mercados, lo que lo convierte en una solución versátil y flexible para cualquier necesidad de análisis financiero. Con su enfoque único y funcionalidad avanzada, UR Gamma es una herramienta imprescindible para cualquier comerciante profesional o serio que busque obtener una ventaja en los mercados financieros.

¿Cómo usar UR Gamma?

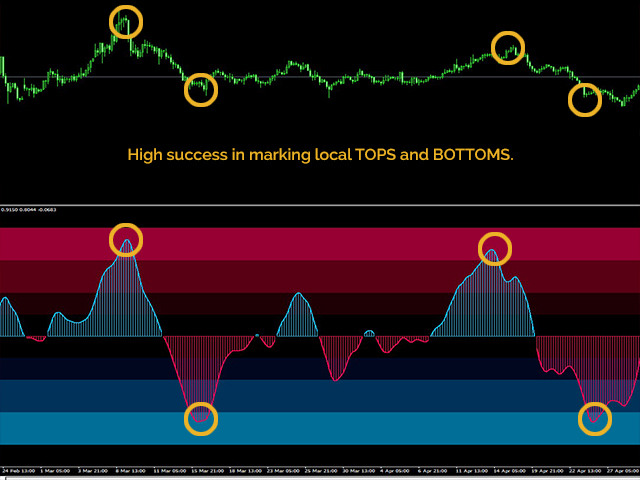
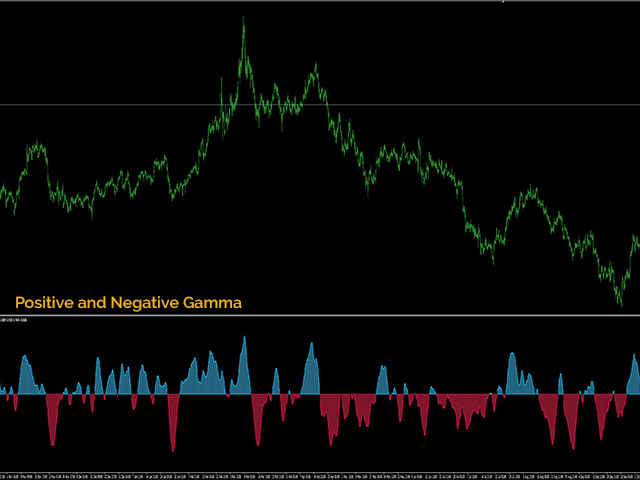
UR Gamma es un oscilador de una línea que está diseñado para ayudar a los operadores a identificar y medir las tendencias en la acción del precio. El oscilador es fácil de usar y proporciona una representación visual clara de las tendencias del mercado, con los niveles de fondo que muestran posibles puntos de agotamiento del precio. Para usar UR Gamma, simplemente agregue el indicador a su gráfico y observe las oscilaciones de la línea. El oscilador oscilará entre -1 y 1, siendo 0 la mediana. Cuando la línea está por encima de 0, indica que el mercado está en una tendencia alcista, y cuando está por debajo de 0, indica una tendencia bajista. Los niveles de fondo proporcionan una indicación clara de los posibles puntos de agotamiento del precio, por lo que los operadores pueden actuar en consecuencia. Para mejorar aún más el análisis, los usuarios pueden ajustar la configuración para que se adapte a sus preferencias y requisitos.


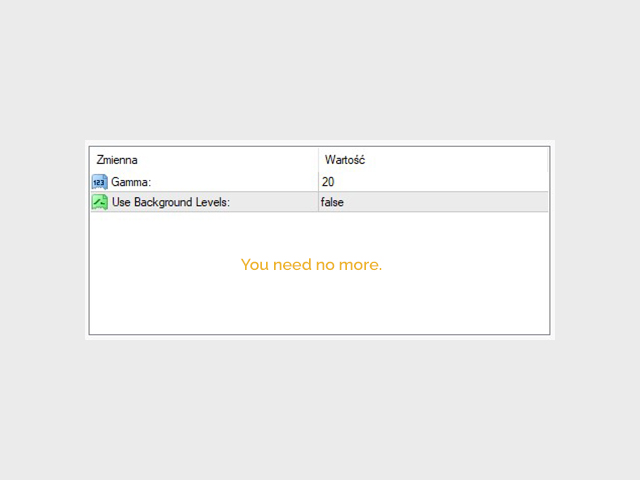
AJUSTES
Gamma: Básicamente, un valor de "retrospectiva" que influye en la longitud de las ondas; ajústelo según el período de tiempo que esté utilizando.
Usar niveles de fondo: visualización del agotamiento detrás del búfer
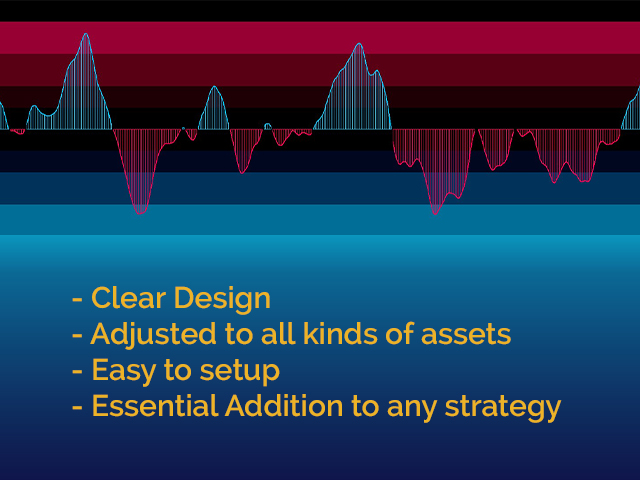
MOSTRAR

Línea Gamma: Muestra el agotamiento del precio y posiblemente los niveles de redistribución marcando máximos y mínimos.
Niveles de fondo: muestra diferentes niveles de agotamiento ajustados a la configuración predeterminada.
Productos recomendados
Blahtech Market Profile
Blahtech Limited
4.56 (16)
Was: $249  Now: $99   Market Profile defines a number of day types that can help the trader to determine market behaviour. A key feature is the Value Area, representing the range of price action where 70% of trading took place. Understanding the Value Area can give traders valuable insight into market direction and establish the higher odds trade. It is an excellent addition to any system you may be using. Blahtech Limited presents their Market Profile indicator for the MetaTrader community. Ins
BoxChart MT4
Evgeny Shevtsov
4.5 (6)
The market is unfair if only because 10% of participants manage 90% of funds. An ordinary trader has slim changes to stand against these "vultures". This problem can be solved. You just need to be among these 10%, learn to predict their intentions and move with them. Volume is the only preemptive factor that faultlessly works on any timeframe and symbol. First, the volume appears and is accumulated, and only then the price moves. The price moves from one volume to another. Areas of volume accumu
Daily Candle Predictor es un indicador que predice el precio de cierre de una vela. El indicador está destinado principalmente para su uso en gráficos D1. Este indicador es adecuado tanto para el comercio de divisas tradicional como para el comercio de opciones binarias. El indicador se puede utilizar como un sistema de negociación independiente o puede actuar como una adición a su sistema de negociación existente. Este indicador analiza la vela actual, calculando ciertos factores de fuerza dent
Infinity Trend Pro
Yaroslav Varankin
1 (1)
This is a trend indicator without redrawing Developed instead of the binary options strategy (by the color of the Martingale candlestick) Also works well in forex trading When to open trades (binary options) A signal will appear in the place with a candle signaling the current candle It is recommended to open a deal for one candle of the current timeframe M1 and M5 When a blue dot appears, open a deal up When a red dot appears, open a trade down. How to open trades on Forex. When a signal is rec
El indicador construye cotizaciones actuales, que se pueden comparar con las históricas y, sobre esta base, hacer un pronóstico de movimiento de precios. El indicador tiene un campo de texto para una navegación rápida a la fecha deseada. Opciones: Símbolo - selección del símbolo que mostrará el indicador; SymbolPeriod - selección del período del cual el indicador tomará datos; IndicatorColor - color del indicador; HorisontalShift: cambio de cotizaciones dibujadas por el indicador
Alpha Trend sign has been a very popular trading tool in our company for a long time. It can verify our trading system and clearly indicate trading signals, and the signals will not drift. Main functions: Based on the market display of active areas, indicators can be used to intuitively determine whether the current market trend belongs to a trend market or a volatile market. And enter the market according to the indicator arrows, with green arrows indicating buy and red arrows indicating
Owl smart levels
Sergey Ermolov
4.34 (35)
Versión MT5  |   FAQ El   Indicador Owl Smart Levels   es un sistema comercial completo dentro de un indicador que incluye herramientas de análisis de mercado tan populares como   los fractales avanzados de Bill Williams , Valable ZigZag que construye   la estructura de onda correcta   del mercado y   los niveles de Fibonacci   que marcan los niveles exactos de entrada. en el mercado y lugares para tomar ganancias. Descripción detallada de la estrategia Instrucciones para trabajar con el indi
Noize Absorption Index MT4
Ekaterina Saltykova
5 (1)
Noize Absorption Index - is the manual trading system that measures the difference of pressure between bears forces and bulls forces. Green line - is a noize free index that showing curent situation. Zero value of index shows totally choppy/flat market.Values above zero level shows how powerfull bullish wave is and values below zero measures bearish forces.Up arrow appears on bearish market when it's ready to reverse, dn arrow appears on weak bullish market, as a result of reverse expectation. S
Indicador Perfil de Volumen para MT4 Obtén una ventaja en el trading con el indicador "Perfil de Volumen" para MetaTrader 4 (MT4). Esta herramienta avanzada de análisis técnico te permite identificar con precisión niveles clave de soporte y resistencia basados en el volumen de transacciones. Visualiza fácilmente las áreas de mayor interés del mercado, donde los volúmenes de negociación son más altos, y utiliza esta información para tomar decisiones de trading más informadas. Características prin
Super Reversal Pattern
Parfait Mujinga Ndalika
Super Reversal Pattern Indicator Unlock the power of advanced pattern recognition with our Super Reversal Pattern Indicator. Designed for traders seeking precision and reliability, this indicator identifies one of the most effective reversal patterns in technical analysis, offering a significant edge in your trading strategy. Key Features: Non-Repainting Accuracy: Enjoy the confidence of non-repainting technology. Once a Super Reversal Pattern is detected, it remains static, providing consis
Gold Phoenix
Yaroslav Varankin
The perfect tool for Scalng in the Forex markets You can trade both from signal to signal and using take profit  The algorithm does not use Zigzag!  No redrawing!  This is a channel instrument that uses a moving average as a filter. Moving Average  There are 2 parameters for the settings Ma Period = 5 period Moving Average  Channel 1.0 distance of channel lines from the chart Price Signal Filter - calculation of signal opening and filter There is a complete set of Alert There is a multi-timefram
Master Scalping M1 es un indicador innovador que utiliza un algoritmo para determinar la tendencia de forma rápida y precisa. El indicador calcula el tiempo de apertura y cierre de posiciones, los algoritmos del indicador le permiten encontrar los momentos ideales para ingresar a una operación (comprar o vender un activo), lo que aumenta el éxito de las transacciones para la mayoría de los comerciantes. Beneficios del indicador: Fácil de usar, no sobrecarga el gráfico con información innecesari
Blahtech Supply Demand
Blahtech Limited
4.61 (33)
Was: $299  Now: $99   Supply Demand uses previous price action to identify potential imbalances between buyers and sellers. The key is to identify the better odds zones, not just the untouched ones. Blahtech Supply Demand indicator delivers functionality previously unavailable on any trading platform. This 4-in-1 indicator not only highlights the higher probability zones using a multi-criteria strength engine, but also combines it with multi-timeframe trend analysis, previously confirmed swings
VolumeProfile
Robert Hess
3.8 (5)
Descption: The Volume Profile displays detailed informations of historical trading activities at certain price levels (Market Profile). So you can locate the areas with the best prices in the market and get an advantage about other market participants. Features: Customizable Volume Profile / Market Profile Shows the "fair" Value Area with 70% of all Volume Shows critical low volume zones Shows VPOC, VAL and VAH Points Works on all timeframes Also available for MT5 ( https://www.mql5.com/en/m
TWO PAIRS SQUARE HEDGE METER INDICATOR Try this brilliant 2 pairs square indicator It draws a square wave of the relation between your two inputs symbols when square wave indicates -1 then it is very great opportunity to SELL pair1 and BUY Pair2 when square wave indicates +1 then it is very great opportunity to BUY pair1 and SELL Pair2 the inputs are : 2 pairs of symbols         then index value : i use 20 for M30 charts ( you can try other values : 40/50 for M15 , : 30 for M30 , : 10 for H1 ,
Volume by Price MT4
Brian Collard
4.64 (11)
The Volume by Price Indicator for MetaTrader 4 features Volume Profile and Market Profile TPO (Time Price Opportunity). Volume and TPO histogram bar and line charts. Volume Footprint charts. TPO letter and block marker collapsed and split structure charts. Static, dynamic and flexible range segmentation and compositing methods with relative and absolute visualizations. Session hours filtering and segment concatenation with Market Watch and custom user specifications. Graphical layering, positio
Un indicador técnico que calcula sus lecturas sobre los volúmenes de negociación. En forma de histograma, muestra la acumulación de la fuerza del movimiento del instrumento comercial. Dispone de sistemas de cálculo independientes para direcciones alcistas y bajistas. Funciona en cualquier instrumento comercial y marco de tiempo. Puede complementar cualquier sistema comercial. El indicador no vuelve a dibujar sus valores, las señales aparecen en la vela actual. Es fácil de usar y no carga el gr
The Chaikin Oscillator is a technical indicator developed by Marc Chaikin that combines price and volume data to measure the accumulation and distribution of a financial instrument. It aims to identify potential buying and selling opportunities in the market. The Chaikin Oscillator is calculated by subtracting a 10-day exponential moving average of the Accumulation Distribution Line (ADL) from a 3-day exponential moving average of the ADL. Here's how to use the Chaikin Oscillator indicator in tr
Trade with Gann on your side!! MASTER CIRCLE 360 CIRCLE CHART, originally created by Gann admitted that this is “The Mother of all charts”. It is one of the last studies that this great trader left for us. The numeric tab le is apparently quite simple like all the tables and is based on square numbers, the SQUARE OF 12 and is by evolution, one of the most important square numbers. Here we can find CYCLE, PRICE AND TIME thanks to angles and grades, to show past and future support and resistance.
The Penta-O is a 6-point retracement harmonacci pattern which usually precedes big market movements. Penta-O patterns can expand and repaint quite a bit. To make things easier this indicator implements a twist: it waits for a donchian breakout in the right direction before signaling the trade. The end result is an otherwise repainting indicator with a very reliable trading signal. The donchian breakout period is entered as an input. [ Installation Guide | Update Guide | Troubleshooting | FAQ | A
The indicator allows you to trade binary options. The recommended time frame is М1 and the expiration time is 1,2,3 minutes. The indicator suitable for auto and manual trading. A possible signal is specified as a arrows above/under a candle. You should wait until the candle closes! Arrows are not re-painted Trade sessions: TOKYO section (Half-end) Currency pairs: USD/JPY Working time frame: M1 Expiration time: 1,2,3 minutes. The indicator also shows good results when using the martingale strateg
FREE
Cosmic Diviner X Planet
Olena Kondratenko
4 (2)
This unique multi-currency strategy simultaneously determines the strength of trends and market entry points, visualizing this using histograms on the chart. The indicator is optimally adapted for trading on the timeframes М5, М15, М30, Н1. For the convenience of users, the indicator renders the entry point (in the form of an arrow), recommended take profit levels (TP1, TP2 with text labels) and the recommended Stop Loss level. The take profit levels (TP1, TP2) are automatically calculated for
SmartSignal Sniper
Ahmed Ismail Muhammad Ismail Al Talhat
SmartSignal Sniper: Tu Compañero de Trading Definitivo Descubre el poder del trading preciso con SmartSignal Sniper. Diseñado para ofrecer señales de compra y venta precisas, esta herramienta avanzada permite a traders de todos los niveles navegar por los mercados financieros con confianza y claridad. Características Clave: Precisión Milimétrica: SmartSignal Sniper utiliza algoritmos avanzados para proporcionar señales precisas de compra y venta, ayudando a los traders a identificar oportunidade
The Best One Scalping Trade Panel functional manual trade panel with risk reward, auto SL by candle ( original solution), lot size calculation, one-click trading, scale in and out of trades (partial close),  Works with all symbols not just currency pairs, perfect works on DAX, NASDAQ, GOLD, ...... I earn every day during live stream on ZakopiecFX - join Me Risk by lot Risk by percent SL by points SL by Candle, Renko, RangeBar ( original solution) TP by point TP by Risk/Reward Auto Trailing b
The Th3Eng PipFinite indicator is based on a very excellent analysis of the right trend direction with perfect custom algorithms. It show the true direction and the best point to start trading. With StopLoss point and Three Take Profit points. Also it show the right pivot of the price and small points to order to replace the dynamic support and resistance channel, Which surrounds the price. And Finally it draws a very helpful Box on the left side on the chart includes (take profits and Stop loss
Trendiness Index
Libertas LLC
5 (3)
"The trend is your friend" is one of the best known sayings in investing, because capturing large trendy price movements can be extremely profitable. However, trading with the trend is often easier said than done, because many indicators are based on price reversals not trends. These aren't very effective at identifying trendy periods, or predicting whether trends will continue. We developed the Trendiness Index to help address this problem by indicating the strength and direction of price trend
For sure, this indicator has become very popular amongst traders. Through coding this indicator will give you the most accurate levels possible for your trading analysis. We have also added in the ability for you to receive alerts when the price breaks above or below a Support or Resistance lines! HOW TO USE The red rectangles represent your resistance/supply zone. The green rectangles represent your support/demand zone.  BONUS FEATURES We coded this indicator with the ability to switch between
The indicator analyzes the change in the minimum and maximum prices of the previous bars fixing the entrance of the big players. If the change (delta) increases, a signal is displayed on the graph in the form of an arrow. At the same time, virtual trade on history is carried out. In case of a repeat of the signal, the positions are increased (refilling). Thus the lot of positions can differ. The results of virtual trading in the form of losses / losses, profitability, drawdown and transaction li
The Market Profile Indicator for MT4 displays the price levels and zones where increased trading activity happens. These zones with substantial forex trading activity provide the forex traders with the best entry levels, support, and resistance levels. Moreover, price levels indicate the best reversal zones. As a result, forex traders can identify BULLISH and BEARISH market trends and BUY and SELL entry points as well as the best reversal points. The indicator works well in all intraday timefram
Predictor PRO MT4
Evgenii Aksenov
5 (2)
Indicador progresivo de nueva generación de INFINITY. Predictor Pro utiliza su propia estrategia de cálculo de entrada y salida. Indicador sin volver a dibujar las señales! Esto es muy importante para el comercio real. El indicador se puede utilizar para cualquier par de divisas, metales, criptomonedas o índices. Mejor horario de tiempo N1. Predictor Pro muestra el punto de entrada Buy / Sell y el punto de salida Close. El cálculo del beneficio en los puntos ayuda a elegir la configuración
FREE
Los compradores de este producto también adquieren
FX Volume
Daniel Stein
4.58 (33)
Obtenga su actualización diaria del mercado con detalles y capturas de pantalla a través de nuestro Morning Briefing aquí en mql5 y en Telegram ! FX Volume es el PRIMER y ÚNICO indicador de volumen que proporciona una visión REAL del sentimiento del mercado desde el punto de vista de un bróker. Proporciona una visión impresionante de cómo los participantes institucionales del mercado, como los brokers, están posicionados en el mercado Forex, mucho más rápido que los informes COT. Ver esta info
Scalper Inside PRO
Alexey Minkov
4.73 (56)
An exclusive indicator that utilizes an innovative algorithm to swiftly and accurately determine the market trend. The indicator automatically calculates opening, closing, and profit levels, providing detailed trading statistics. With these features, you can choose the most appropriate trading instrument for the current market conditions. Additionally, you can easily integrate your own arrow indicators into Scalper Inside Pro to quickly evaluate their statistics and profitability. Scalper Inside
The Stochastic Basket Currency Strenght  brings the Stochastic indicator to a new level.  Expanding the boundaries of TimeFrames and mono-currency analysis, the SBCS take the movements of each currency that composes the cross and confront them in the whole basket of 7 crosses.  The indicator works with any combination of AUD, CAD, CHF, EUR, GBP, JPY, NZD, USD pairs and with full automation takes in account every stochastic value (main line) for the selected Time Frame.  After that, the indicator
TPSproTREND PrO
Roman Podpora
4.79 (19)
TPSpro TREND PRO   es un indicador de tendencia que analiza automáticamente el mercado y proporciona información sobre la tendencia y cada uno de sus cambios, además de dar señales para ingresar operaciones sin volver a dibujar. El indicador utiliza cada vela, analizándolas por separado. refiriéndose a diferentes impulsos: impulso hacia arriba o hacia abajo. ¡Puntos de entrada exactos a transacciones de divisas, criptomonedas, metales, acciones e índices! Versión MT5                   DESCRIPCI
Reversal-Arrow: Identifica Puntos de Inversión con Precisión y Fiabilidad Reversal-Arrow es un indicador avanzado diseñado para ayudar a traders de todos los niveles a detectar posibles puntos de inversión de tendencia. Enfocado en proporcionar señales visuales claras, este indicador te ayuda a entender mejor el contexto del mercado, reduciendo la incertidumbre y facilitando el proceso de toma de decisiones. Reversal-Arrow está optimizado específicamente para los pares XAUUSD y XAUEUR en los mar
TPSpro RFI Levels
Roman Podpora
4.82 (22)
INSTRUCCIONES      RUSO  -  ING     Se recomienda utilizar con un indicador.   -    TPSpro   TENDENCIA PRO -   Versión MT5 Un elemento clave en el trading son las zonas o niveles desde los que se toman las decisiones de compra o venta de un instrumento de trading. A pesar de los intentos de los principales actores de ocultar su presencia en el mercado, inevitablemente dejan rastros. Nuestra tarea era aprender a identificar estos rastros e interpretarlos correctamente. Funciones principales: ¡Mo
Dynamic Forex28 Navigator
Bernhard Schweigert
5 (2)
Dynamic Forex28 Navigator: la herramienta de trading de Forex de última generación. ACTUALMENTE CON UN 49 % DE DESCUENTO. Dynamic Forex28 Navigator es la evolución de nuestros indicadores populares de larga data, que combina el poder de tres en uno: Indicador avanzado Currency Strength28 (695 reseñas) + Indicador avanzado Currency IMPULSE con ALERT (520 reseñas) + Señales combinadas CS28 (bonificación). Detalles sobre el indicador https://www.mql5.com/en/blogs/post/758844 ¿Qué ofrece el i
Gold Channel is a volatility-based indicator, developed with a specific timing algorithm for the XAUUSD pair, which consists of finding possible corrections in the market. This indicator shows two outer lines, an inner line (retracement line) and an arrow sign, where the theory of the channel is to help identify overbought and oversold conditions in the market. The market price will generally fall between the boundaries of the channel. If prices touch or move outside the channel it is a tra
¡Actualmente 20% OFF ! ¡La mejor solución para cualquier novato o trader experto! Este software funciona con 28 pares de divisas. Se basa en 2 de nuestros principales indicadores (Advanced Currency Strength 28 y Advanced Currency Impulse). Proporciona una gran visión general de todo el mercado de divisas. Muestra los valores de Advanced Currency Strength, la velocidad de movimiento de las divisas y las señales para 28 pares de divisas en todos los (9) marcos temporales. Imagine cómo mejorar
Ultimate Gold Advisor para MetaTrader 4 El Ultimate Gold Advisor es una herramienta tecnológica avanzada diseñada para optimizar la experiencia de trading en MetaTrader 4. Creada para satisfacer las necesidades de los traders más experimentados, este indicador combina precisión, análisis sofisticado y funcionalidad versátil, ofreciendo soporte para tomar decisiones de trading informadas. Ideal para el trading de oro, pero también aplicable a una amplia gama de activos, el Ultimate Gold Advisor p
Gann Swing Structure
Kirill Borovskii
5 (1)
This indicator is based on the mathematics of the great trader W.D. Ganna. With its help, you can easily find strong levels by analyzing swings to find the optimal entry point. The indicator works on all instruments and all timeframes. The indicator is fully manual and has control buttons. All you need to do is press the NEW button, a segment will appear, which you can place on any movement, swing or even 1 candle that you want to analyze. By placing the segment, press the OK button. A grid (th
Presentamos ON Trade Waves Patterns Harmonic Elliot Wolfe, un indicador avanzado diseñado para detectar diversas formas de patrones en el mercado mediante métodos tanto manuales como automáticos. A continuación, te explicamos cómo funciona: Patrones Armónicos: Este indicador puede identificar patrones armónicos que aparecen en tu gráfico. Estos patrones son esenciales para los traders que practican la teoría del trading armónico, tal como se popularizó en el libro de Scott Carney "Harmonic Tradi
Supply and Demand Dashboard PRO
Bernhard Schweigert
4.8 (20)
¡Actualmente 20% OFF ! Este tablero de instrumentos es una pieza muy poderosa de software de trabajo en múltiples símbolos y hasta 9 marcos de tiempo. Se basa en nuestro indicador principal (Mejores críticas: Advanced Supply Demand ).  El tablero de instrumentos da una gran visión general. Se muestra:  Valores filtrados de Oferta y Demanda, incluyendo la calificación de fuerza de la zona, Pips distancias a / y dentro de las zonas, Destaca las zonas anidadas, Da 4 tipos de alertas para los s
Enigmera
Ivan Stefanov
5 (3)
ENIGMERA: El núcleo del mercado https://www.enigmera.com Introducción Este indicador y sistema de negociación es un enfoque extraordinario de los mercados financieros. ENIGMERA utiliza los ciclos fractales para calcular con precisión los niveles de soporte y resistencia. Muestra la auténtica fase de acumulación y proporciona dirección y objetivos.  Un sistema que funciona tanto si estamos en una tendencia como en una corrección.  ¿Cómo funciona? ENIGMERA consta de tres líneas: la línea de s
¡LEA LA INFORMACIÓN A CONTINUACIÓN ANTES DE COMPRAR EL PRODUCTO! ¡Apollo Pips PLUS SP es un producto único! ¡ES PARA AQUELLOS QUE QUIEREN OBTENER MI NUEVO INDICADOR "APOLLO PIPS" MÁS BONO "SUPER PACK" CON ACCESO A TODOS MIS INDICADORES COMERCIALES! Al comprar el producto Apollo Pips PLUS SP, en realidad está comprando una versión absolutamente nueva de mi indicador Apollo Pips. Esta versión del indicador tiene un algoritmo mejorado y un parámetro fácil de usar que le brinda la oportunidad de uti
XQ Indicator MetaTrader 4
Marzena Maria Szmit
4 (4)
Step into the realm of Forex trading with confidence and precision using XQ, a cutting-edge Forex indicator designed to elevate your trading game to unprecedented heights. Whether you're a seasoned trader or just stepping into the world of currency exchange,   XQ Forex Indicator   empowers you with the insights and signals needed to make informed trading decisions. The signal conditions are a combination of three indicators, and XQ Forex Indicator only display  medium and long-term trends . The
TrendMaestro
Stefano Frisetti
5 (3)
note: this indicator is for METATRADER4, if you want the version for METATRADER5 this is the link:  https://www.mql5.com/it/market/product/108106 TRENDMAESTRO ver 2.4 TRENDMAESTRO recognizes a new TREND in the bud, he never makes mistakes. The certainty of identifying a new TREND is priceless. DESCRIPTION TRENDMAESTRO identifies a new TREND in the bud, this indicator examines the volatility, volumes and momentum to identify the moment in which there is an explosion of one or more of these data a
ACB Breakout Arrows
KEENBASE SOFTWARE SOLUTIONS
4.15 (34)
The ACB Breakout Arrows indicator provides a crucial entry signal in the market by detecting a special breakout pattern. The indicator constantly scans the chart for a settling momentum in one direction and provide the accurate entry signal right before the major move.  Get multi-symbol and multi-timeframe scanner from here - Scanner for ACB Breakout Arrows MT4 Key features Stoploss and Take Profit levels are provided by the indicator. Comes with a MTF Scanner dashboard which tracks the brea
(Actualmente 30% DE DESCUENTO) Antes de leer la descripción de este indicador, solo quiero presentarles el siguiente concepto LÍNEA PROMEDIO EN MOVIMIENTO: promedio móvil típico que se basa en un solo gráfico. LÍNEA DE FUERZA DE LA DIVISA: el promedio móvil de un determinado par en el que la fuerza se basa en 28 pares. Se puede decir que es la LÍNEA PROMEDIO EN MOVIMIENTO REAL. De hecho, la media móvil es uno de los indicadores más populares que utilizan casi todos los operadore
Shepherd Harmonic Pattern
Abdullah Alrai
4.65 (49)
Este indicador detectará patrones armónicos que se dibujen en el gráfico mediante métodos manuales y automáticos. Puede consultar el manual del usuario en el siguiente enlace: Agregue su opinión y contáctenos para obtenerlo Existe una versión gratuita para probar este producto en mt4. Puede utilizarlo para detectar patrones de Gartley y Nenstar: https://www.mql5.com/en/market/product/30181 Puede comprar la versión completa de MT4 en: https://www.mql5.com/en/market/product/15212 Notas El indicad
Currency Strength Exotics
Bernhard Schweigert
4.87 (31)
¡ACTUALMENTE 20% DE DESCUENTO ! ¡La mejor solución para cualquier operador novato o experto! Este indicador está especializado en mostrar la fuerza de la divisa para cualquier símbolo como Pares Exóticos, Materias Primas, Índices o Futuros. Es el primero de su clase, cualquier símbolo se puede añadir a la 9 ª línea para mostrar la verdadera fuerza de la moneda de Oro, Plata, Petróleo, DAX, US30, MXN, TRY, CNH etc. Se trata de una herramienta de trading única, de alta calidad y asequible por
Bomb Bank Signal
Igor Pereira Calil
5 (1)
Señal de Bomb Bank: su indicador de confianza en MetaTrader 4 Bomb Bank Signal es un poderoso indicador para MetaTrader 4, diseñado para identificar las tendencias más relevantes en el mercado financiero. Si buscas una herramienta que anticipe los movimientos con precisión, el Bomb Bank es el aliado que necesitas. Cómo funciona: Este indicador combina tres métodos distintos (análisis de volumen, cierre de velas y tendencia simétrica) para detectar y señalar oportunidades de compra y venta
Sneaky Busters 4
Mushfiq Faysal
5 (2)
This indicator is designed for those familiar with smart money concepts, specifically accumulation and distribution. It tracks subtle moves by institutional traders, not always aligned with traditional strategies. Ensure it fits your trading style by testing thoroughly before purchasing. Sneaky Buster is designed to help retail traders identify smart money moves. Traditional indicators often miss these subtle maneuvers, which inspired the creation of this tool. It effectively detects price cons
TPA True Price Action indicator reveals the true price action of the market makers through 100% non-repainting signals (except early signals mode) strictly at the close of a candle! TPA shows entries and re-entries, every time the bulls are definitely stronger than the bears and vice versa. Not to confuse with red/green candles. The shift of power gets confirmed at the earliest stage and is ONE exit strategy of several. There are available now two free parts of the TPA User Guide for our custo
Cycle Sniper
Elmira Memish
4.39 (36)
NEW YEAR SALE PRICE FOR LIMITED TIME!!! Please contact us after your purchase and we will send you the complimentary indicators to complete the system Cycle Sniper is not a holy grail but when you use it in a system which is explained in the videos, you will feel the difference. If you are not willing to focus on the charts designed with Cycle Sniper and other free tools we provide, we recommend not buying this indicator. We recommend watching the videos about the indiactor and system before pu
Up down v6T
Guner Koca
5 (2)
Thise indicator is up down v6  comes with tradingwiev pinescript. purchased people, after installed on terminal ,contact me on mql5  to get BONUS  TradingView pinescript. up-down indicator is no repaint and works all pairs and lower than weekly time frames charts. it is suitable also 1 m charts for all pairs. and hold long way to signal. dont gives too many signals. when red histogram cross trigger line that is up signal.and price probably will down when blue histogram cross trigger line that
REMINDER: Early buyers hot price discount: Price subject to rise after first 20 copies. Starting price $65 and final price will be $1275. Secure your discounted copy Now! Smart Money Analyser Indicator User Manual 1. Introduction Welcome to the   Smart Money Analyser Indicator This powerful tool provides traders with comprehensive market analysis by combining various technical indicators to generate actionable trading signals. Designed to be user-friendly, this indicator helps traders of a
Fibonacci Sniper
Elmira Memish
5 (2)
Fibonacci Sniper MT4 - No Repaint Features:  - Indicator sends signals and notifications on key Fibonacci Retracement and Fibonacci Extensions Levels - Once the buy/sell signal is set, targets ( TP1 TP2 TP3 )and stop loss levels are drawn by the indicator. - Fibonacci Calculations and Custom Patterns are identified by the last 3 or 5 Zig Zag exterum. - You can easily identify key harmonic patterns like Gartley, Bat, Butterfly and Crab patterns. Important Settings:  - Choose the Zig
The Binary Profit Maker,  This indicator works on MT4 and is very easy to use. When you receive a signal from it, you wait for that candle with the signal to close and you enter your trade at the beginning of the next new candle . A Up Purple arrow means Buy and a Down Purple arrow means Sell. All arrows comes with Alert  like for easy identification of trade signal. Are you okay with that? How To Enter Trade? 1 minute candle 1 minute expire
PZ Day Trading
PZ TRADING SLU
3.67 (3)
Este indicador detecta reversiones de precios en forma de zig-zag, utilizando solo análisis de acción de precios y un canal donchian. Ha sido diseñado específicamente para el comercio a corto plazo, sin repintar ni pintar en absoluto. Es una herramienta fantástica para comerciantes astutos con el objetivo de aumentar el tiempo de sus operaciones. [ Guía de instalación | Guía de actualización | Solución de problemas | FAQ | Todos los productos ] Increíblemente fácil de comerciar Proporciona
Otros productos de este autor
UR Control Panel
Krzysztof Jan Debski
5 (2)
Panel de control UR   UR Control Panel es una herramienta que quiero compartir contigo GRATIS. Es un panel interactivo que me ayudó en mis operaciones y mejoró mi exploración del mercado todos los días. ¡Espero que se adapte a tus necesidades también! ¿Cómo usar el panel de control UR? Es un panel doble móvil y redimensionable del cual: - Uno de ellos muestra la fortaleza de la moneda en el marco de tiempo dado - El otro permite opciones para moverse entre símbolos y marcos de tiempo much
FREE
UR Basket
Krzysztof Jan Debski
你的籃子   您能做的最好的事情就是保護您的訂單免於虧損。 您現在可以放心,讓 UR Basket 來處理它。 使用 UR 籃子的優勢: 所有參數都可以在圖表的圖形面板中動態更改 - 您無需重新啟動 EA 即可更改參數或調用您使用的設置! 您可以通過以下方式跟踪您的訂單:   - 幻數   - EA評論   - 以上兩者   -一次完成所有交易 UR Basket 可以通過您的貨幣價值、PIPS 或您的餘額或淨值的百分比來跟踪您的利潤。 圖形面板始終顯示您在這三種方法中的利潤,並刷新您告訴他的頻率。 最大優勢:鎖定利潤,不虧本! 下面詳細介紹它。 有一個特殊的電報聊天,您可以在其中了解最新的工具更新,如果您覺得缺少什麼,也可以發送請求! 為什麼選擇 UR 籃子? 有很多 EA 可以自行交易,或者需要您盡可能多地關注獲利的優秀手動策略,但這些都不是防彈的突然變化或經常發生的“鯨魚攻擊”。 因此,這個籃子讓您可以跟踪所有交易,鎖定您的利潤,這樣您就不會失去您已經建立的東西,並儘快關閉交易並確保您不會陷入負值。 圖表上的設置也由用戶動態更改,因此您無需在每次要更改值
UR DivergenceSpotter
Krzysztof Jan Debski
Observador de divergencia UR   UR DivergenceSpotter es el resultado de muchos años de experiencia y, a veces, las formas más fáciles son las mejores. Hay una buena correlación entre algunos indicadores, pero cuando no coinciden, el precio intenta "reajustarse", y es en ese momento cuando recibimos una señal con UR DivergenceSpotter. Ventajas de usar UR Divergence Spotter: Sin parámetros No se vuelve a pintar después de crear la vela. Señales cuando la señal ya no es válida (lo que signifi
UR VolumeTrend
Krzysztof Jan Debski
Tendencia de volumen UR   UR VolumeTrend es el indicador de volumen más claro que muestra la tendencia actual en términos de volumen. Funciona perfectamente con otros indicadores, como UR TrendExhaustion, para señalar máximos y mínimos locales. Limitado a solo 2 parámetros: cuanto más altos sean los valores, más largas serán las tendencias que mostrará. Los extremos de gradiente muestran posibles agotamientos de volumen para captar una posible reversión. Dos líneas: la tendencia del volumen
UR TrendExhaustion
Krzysztof Jan Debski
Tendencia URAgotamiento   UR TrendExhaustion es la mejor solución para los comerciantes que no quieren lidiar con valores de parámetros ni otras configuraciones: es fácil y visualmente comprensible para todos. Ventajas de usar UR TrendExhaustion: Sin parámetros Tiene 3 líneas que describen mejor lo que está pasando en el gráfico: Línea de agotamiento de tendencia, Línea de dinero de ballena y Línea de dinero minorista. La interfaz muestra el agotamiento de cualquiera de las líneas en ambo
UR HighsAndLows
Krzysztof Jan Debski
Máximos y mínimos de UR   UR Highs&Lows realiza un análisis en profundidad del movimiento de precios y su volatilidad, y crea un canal dentro del cual se mueve el precio. Ese canal se mueve ahora como un oscilador y se superpone con la desviación del precio para señalar posibles agotamientos y posibles reversiones. Ventajas de usar UR Highs&Lows: Sin parámetros Tiene 3 líneas que describen el movimiento del precio: la línea blanca, que es un promedio del precio, y las líneas azules, que s
UR Momenter
Krzysztof Jan Debski
Momentador UR   UR Momenter calcula perfectamente el impulso del precio en correlación con el agotamiento del movimiento del precio representado como un oscilador. Por lo tanto, esto nos da señales muy tempranas de posibles reversiones o retrocesos. Esta fórmula se descubrió en 2018 después del estallido de la burbuja del mercado. Ventajas de usar UR Momenter: Sin parámetros Tiene 2 líneas que describen el movimiento del precio: la línea blanca, que es el impulso del precio en correlación
UR FrontEndBackEnd
Krzysztof Jan Debski
UR FrontEndBackEnd   UR FrontEndBackEnd es mi fórmula favorita para encontrar los niveles más precisos de soporte y resistencia. También los he dividido en diferentes categorías (líneas discontinuas, líneas continuas y áreas) para marcar qué tan fuertes son. Todo se almacena en búferes, por lo que es fácil acceder a ellos e implementarlos dentro de otras herramientas. Adición: es posible que la herramienta deba ajustarse al activo en el que se aplica: los activos difieren en términos de núm
UR Bands
Krzysztof Jan Debski
Bandas UR (con una fórmula utilizada en sistemas de aprendizaje automático) UR Bands es un indicador derivado a través de una fórmula que incorpora la volatilidad del mercado y es similar en principio a los utilizados en los sistemas de aprendizaje automático. Esta representación matemática de las condiciones del mercado ofrece un análisis preciso de las tendencias y dinámicas de los precios, teniendo en cuenta la volatilidad inherente de los mercados financieros. Al incorporar la volatilidad
UR Vortex
Krzysztof Jan Debski
UR Vortex The Probabilistic UR Vortex Formula: An Accurate System for Predictive Market Analysis using Volatility and Standard Deviation Calculations. The   UR Vortex   indicator is a technical analysis tool that uses volatility and standard deviation calculations to predict potential tops and bottoms in a market. It measures the strength of a trend by calculating the distance between the current price and a moving average, and then standardizing this distance by dividing it by the average true
UR PulseScalp
Krzysztof Jan Debski
UR PulseScalp  Un indicador comercial calibrado para revendedores que buscan la máxima ventaja en mercados acelerados UR PulseScalp es una solución comercial de vanguardia para revendedores que buscan la máxima ventaja en mercados acelerados. Este indicador innovador se basa en una fórmula calibrada científicamente que combina el poder de la volatilidad, el flujo de dinero y la fuerza relativa para crear una señal altamente precisa y confiable. Ventajas de usar UR PulseScalp : Cómodo Pane
UR TradeManager
Krzysztof Jan Debski
UR_TradeManager para MetaTrader 4 Maximice su potencial de trading con UR_TradeManager, la herramienta definitiva de mejora de trading diseñada específicamente para la plataforma MetaTrader 4. Creada con precisión y funcionalidad en mente, esta herramienta integral es esencial para los traders que buscan elevar sus habilidades de análisis de mercado, ejecución y gestión. Características Clave: Panel de Trading Visual : Gestione sus operaciones directamente desde un panel sofisticado que se integ
UR Basket MT5
Krzysztof Jan Debski
你的籃子   您能做的最好的事情就是保護您的訂單免於虧損。 您現在可以放心,讓 UR Basket 來處理它。 使用 UR 籃子的優勢: 所有參數都可以在圖表的圖形面板中動態更改 - 您無需重新啟動 EA 即可更改參數或調用您使用的設置! 您可以通過以下方式跟踪您的訂單:   - 幻數   - EA評論   - 以上兩者   -一次完成所有交易 UR Basket 可以通過您的貨幣價值、PIPS 或您的餘額或淨值的百分比來跟踪您的利潤。 圖形面板始終顯示您在這三種方法中的利潤,並刷新您告訴他的頻率。 最大優勢:鎖定利潤,不虧本! 下面詳細介紹它。 有一個特殊的電報聊天,您可以在其中了解最新的工具更新,如果您覺得缺少什麼,也可以發送請求! 為什麼選擇 UR 籃子? 有很多 EA 可以自行交易,或者需要您盡可能多地關注獲利的優秀手動策略,但這些都不是防彈的突然變化或經常發生的“鯨魚攻擊”。 因此,這個籃子讓您可以跟踪所有交易,鎖定您的利潤,這樣您就不會失去您已經建立的東西,並儘快關閉交易並確保您不會陷入負值。 圖表上的設置也由用戶動態更改,因此您無需在每次要更改值
Observador de divergencia UR   UR DivergenceSpotter es el resultado de muchos años de experiencia y, a veces, las formas más fáciles son las mejores. Hay una buena correlación entre algunos indicadores, pero cuando no coinciden, el precio intenta "reajustarse", y es en ese momento cuando recibimos una señal con UR DivergenceSpotter. Ventajas de usar UR Divergence Spotter: Sin parámetros No se vuelve a pintar después de crear la vela. Señales cuando la señal ya no es válida (lo que signifi
UR VolumeTrend MT5
Krzysztof Jan Debski
Tendencia de volumen UR   UR VolumeTrend es el indicador de volumen más claro que muestra la tendencia actual en términos de volumen. Funciona perfectamente con otros indicadores, como UR TrendExhaustion, para señalar máximos y mínimos locales. Limitado a solo 2 parámetros: cuanto más altos sean los valores, más largas serán las tendencias que mostrará. Los extremos de gradiente muestran posibles agotamientos de volumen para captar una posible reversión. Dos líneas: la tendencia del volumen
Tendencia URAgotamiento   UR TrendExhaustion es la mejor solución para los comerciantes que no quieren lidiar con valores de parámetros ni otras configuraciones: es fácil y visualmente comprensible para todos. Ventajas de usar UR TrendExhaustion: Sin parámetros Tiene 3 líneas que describen mejor lo que está pasando en el gráfico: Línea de agotamiento de tendencia, Línea de dinero de ballena y Línea de dinero minorista. La interfaz muestra el agotamiento de cualquiera de las líneas en ambo
UR HighsAndLows MT5
Krzysztof Jan Debski
Máximos y mínimos de UR   UR Highs&Lows realiza un análisis en profundidad del movimiento de precios y su volatilidad, y crea un canal dentro del cual se mueve el precio. Ese canal se mueve ahora como un oscilador y se superpone con la desviación del precio para señalar posibles agotamientos y posibles reversiones. Ventajas de usar UR Highs&Lows: Sin parámetros Tiene 3 líneas que describen el movimiento del precio: la línea blanca, que es un promedio del precio, y las líneas azules, que s
UR Momenter MT5
Krzysztof Jan Debski
Momentador UR   UR Momenter calcula perfectamente el impulso del precio en correlación con el agotamiento del movimiento del precio representado como un oscilador. Por lo tanto, esto nos da señales muy tempranas de posibles reversiones o retrocesos. Esta fórmula se descubrió en 2018 después del estallido de la burbuja del mercado. Ventajas de usar UR Momenter: Sin parámetros Tiene 2 líneas que describen el movimiento del precio: la línea blanca, que es el impulso del precio en correlación
UR FrontEndBackEnd   UR FrontEndBackEnd es mi fórmula favorita para encontrar los niveles más precisos de soporte y resistencia. También los he dividido en diferentes categorías (líneas discontinuas, líneas continuas y áreas) para marcar qué tan fuertes son. Todo se almacena en búferes, por lo que es fácil acceder a ellos e implementarlos dentro de otras herramientas. Adición: es posible que la herramienta deba ajustarse al activo en el que se aplica: los activos difieren en términos de núm
UR Gamma MT5
Krzysztof Jan Debski
Gama UR (impulsado por cálculos similares que se encuentran en los sistemas de aprendizaje automático) UR Gamma es una herramienta de análisis financiero de vanguardia que ofrece una versión nueva y mejorada del indicador clásico WaveTrend. Al incorporar técnicas avanzadas de procesamiento de señales digitales, UR Gamma aborda algunas de las limitaciones de los algoritmos WaveTrend tradicionales y brinda un enfoque más preciso, sólido y dinámico para identificar y medir tendencias en la acció
UR Bands MT5
Krzysztof Jan Debski
Bandas UR (con una fórmula utilizada en sistemas de aprendizaje automático) UR Bands es un indicador derivado a través de una fórmula que incorpora la volatilidad del mercado y es similar en principio a los utilizados en los sistemas de aprendizaje automático. Esta representación matemática de las condiciones del mercado ofrece un análisis preciso de las tendencias y dinámicas de los precios, teniendo en cuenta la volatilidad inherente de los mercados financieros. Al incorporar la volatilidad
UR Vortex MT5
Krzysztof Jan Debski
UR Vortex MT5 The Probabilistic UR Vortex Formula: An Accurate System for Predictive Market Analysis using Volatility and Standard Deviation Calculations. The UR Vortex MT5 indicator is a technical analysis tool that uses volatility and standard deviation calculations to predict potential tops and bottoms in a market. It measures the strength of a trend by calculating the distance between the current price and a moving average, and then standardizing this distance by dividing it by the average
UR PulseScalp MT5
Krzysztof Jan Debski
UR PulseScalp MT5 Un indicador comercial calibrado para revendedores que buscan la máxima ventaja en mercados acelerados UR PulseScalp MT5 es una solución comercial de vanguardia para revendedores que buscan la máxima ventaja en mercados acelerados. Este indicador innovador se basa en una fórmula calibrada científicamente que combina el poder de la volatilidad, el flujo de dinero y la fuerza relativa para crear una señal altamente precisa y confiable. Ventajas de usar UR PulseScalp MT5: C
UR TradeManager MT5
Krzysztof Jan Debski
UR_TradeManager para MetaTrader 5 Maximice su potencial de trading con UR_TradeManager, la herramienta definitiva de mejora de trading diseñada específicamente para la plataforma MetaTrader 4. Creada con precisión y funcionalidad en mente, esta herramienta integral es esencial para los traders que buscan elevar sus habilidades de análisis de mercado, ejecución y gestión. Características Clave: Panel de Trading Visual : Gestione sus operaciones directamente desde un panel sofisticado que se integ
Filtro:
No hay comentarios
Respuesta al comentario
Versión 1.15 2024.05.15
Icon update
Versión 1.10 2024.05.15
Strategy Tester : Adapted the calculations so they could be backtested in the strategy tester.