Fluctuation Bands
- Indicadores
- Francisco De A Vilar Enriquez
- Versión: 3.3
- Actualizado: 1 febrero 2023
- Activaciones: 5
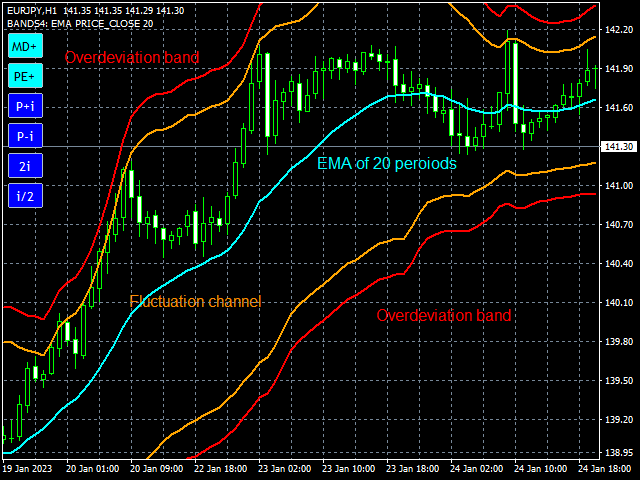
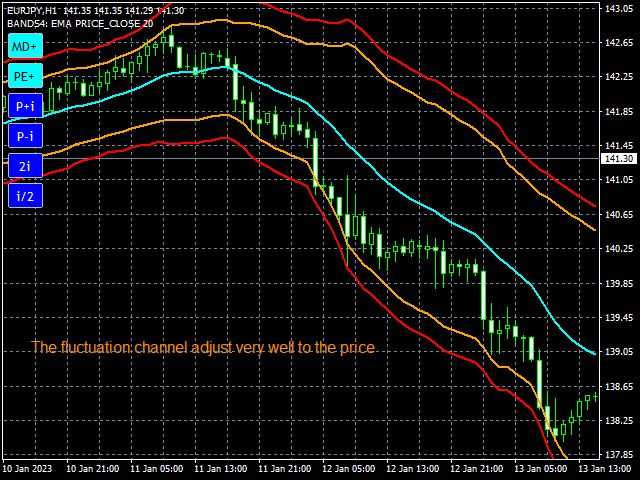
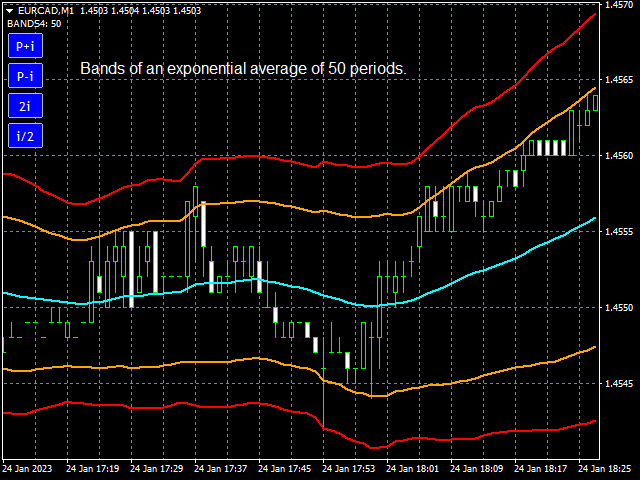
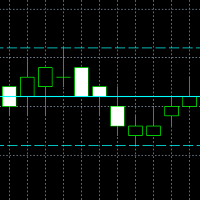
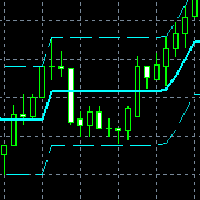
Shows the price fluctuation bands associated with a moving average. It is extremely accurate, and it's a wonderful visual guide. The indicator consists of 4 bands. The two bands closest to the price form the fluctuation channel, they mark the maximum calculated deviation of the price from the moving average. The outer bands mark the maximum overdeviation of the price with respect to the fluctuation channel, they are overbought or oversold areas.
Features.
-The change of periods of the MA is done dynamically, by means of the associated blue controls. By default it is 20. Maximum value: 400 periods.
-Both the method and the standard price of the MA, can be changed dynamically with the controls: "MD+" for the method, and "PE+" for the price.
-The MA and the bands can be activated/deactivated independently.
-The MA parameters are the usual ones.
-The 99 rule: 9 out of 10 candlesticks will be inside the fluctuation channel. And, of those that stand out, 9 out of 10 will be stopped by the outer bands (see the statistics).
Blue controls.
There are 4. "P+i" and "P-i": increase/decrease the periods of the moving average with the increment. "2i" and "i/2": increase/decrease the increment.
Bands calculation.
Apply the following formula, that gives us the maximum calculated value for a set V: Vmax = Vmean + 2*Dmean. Where: Vmean is the mean value, and Dmean is the mean linear deviation of V.
It is applied to price deviations from the moving average to obtain the maximum deviation bands, forming the fluctuation channel. And then, it is applied to the price values that exceed the channel, obtaining the maximum overdeviation bands.
Statistics.
Made on the EURUSD pair. Over 4 exponential moving averages of: 20, 50, 100 and 200 periods.
Candlesticks within the fluctuation channel. Data format: p% / n
p%: candlesticks within the fluctuation channel in %; n: total number of candlesticks <= 40000.
| PERIODS | M1 | M5 | M15 | M30 | H1 | H4 | D1 | W1 | MN | MEAN |
|---|---|---|---|---|---|---|---|---|---|---|
| 20 | 91% / 40000 | 90% / 40000 | 89% / 40000 | 88% / 40000 | 90% / 33460 | 92% / 15894 | 91% / 3600 | 89% / 1270 | 86% / 296 | 90% |
| 50 | 90% / 40000 | 89% / 40000 | 88% / 40000 | 90% / 40000 | 91% / 33430 | 91% / 15864 | 90% / 3570 | 91% / 1240 | 93% / 266 | 90% |
| 100 | 90% / 40000 | 88% / 40000 | 90% / 40000 | 91% / 40000 | 90% / 33380 | 91% / 15814 | 91% / 3520 | 87% / 1190 | 97% / 216 | 91% |
| 200 | 89% / 40000 | 89% / 40000 | 90% / 40000 | 91% / 40000 | 90% / 33280 | 90% / 15714 | 90% / 3420 | 90% / 1090 | 100% / 116 | 91% |
| MEAN | 90% | 89% | 89% | 90% | 90% | 91% | 90.5% | 89% | 94% | 90.5% |
Mean averaged: 90.5%
Candlesticks that exceed the fluctuation channel but are within the overdeviation band. Data format: p% / n
p%: candlesticks that exceed the fluctuation channel but are within the overdeviation band in %; n: total number of candlesticks that exceed the fluctuation channel.
| PERIODS | M1 | M5 | M15 | M30 | H1 | H4 | D1 | W1 | MN | MEAN |
|---|---|---|---|---|---|---|---|---|---|---|
| 20 | 90% / 3457 | 91% / 3861 | 91% / 4289 | 90% / 4784 | 90% / 3451 | 91% / 1339 | 90% / 320 | 87% / 135 | 90% / 41 | 90% |
| 50 | 91% / 3888 | 91% / 4479 | 90% / 4745 | 91% / 3882 | 90% / 3160 | 92% / 1416 | 91% / 361 | 86% / 112 | 79% / 19 | 89% |
| 100 | 90% / 3972 | 92% / 4644 | 91% / 4082 | 91% / 3789 | 89% / 3186 | 93% / 1500 | 90% / 328 | 92% / 155 | --- | 91% |
| 200 | 91% / 4225 | 92% / 4267 | 90% / 3921 | 91% / 3708 | 89% / 3318 | 94% / 1540 | 89% / 326 | 87% / 104 | --- | 90% |
| MEAN | 90.5% | 91.5% | 90.5% | 91% | 89.5% | 92.5% | 90% | 88% | 84.5% | 90% |
Mean averaged: 90%
Conclusions: The 90.5% of the candlesticks are contained in the fluctuation channel. Of the candlesticks that exceed it, the 90% are within the overdeviation zone. With which, the 99% of the candlesticks are within the outer bands, and there is a residual 1% of outliers.

