• Información general
  • Comentarios
  • Discusión

Dashboard Trend Bar Smart Level 9TF Dual STOCH

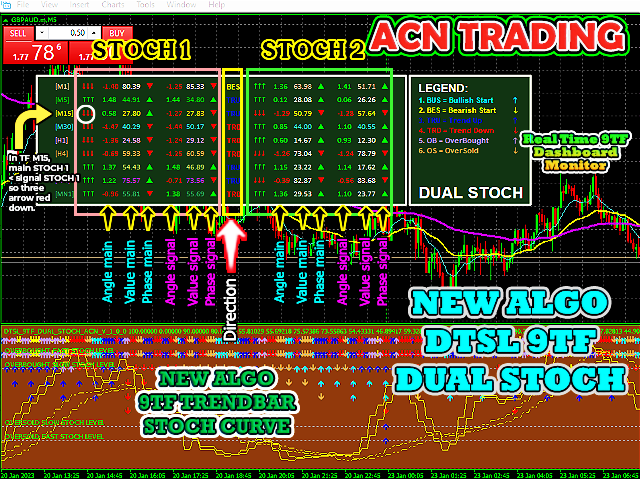
Un indicador estocástico preciso está disponible.

Dashboard Trend Bar Smart Level 9TF Dual Stochastic.
Estocástico dual, es decir, estocástico rápido y estocástico lento
¿Por qué necesitas un segundo estocástico? El uso de indicadores adicionales nos convencerá más en el comercio en vivo
Curva estocástica rápida 9TF
Curva estocástica lenta 9TF
Ángulo estocástico en tiempo real 9TF
9TF valor estocástico en tiempo real
9TF dirección/fase estocástica en tiempo real
Barra de tendencia 9TF
Nuevo algoritmo en el cálculo de la barra de tendencia.
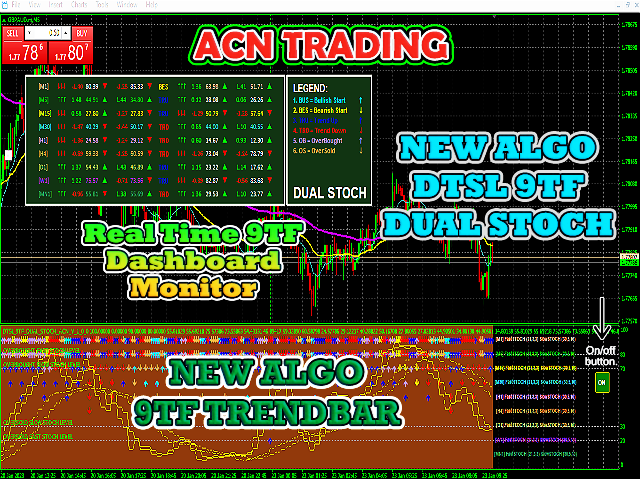
Boton de encendido / apagado. Muy útil para mostrar/ocultar indicador con un solo clic
Monitor de tablero 9TF en tiempo real
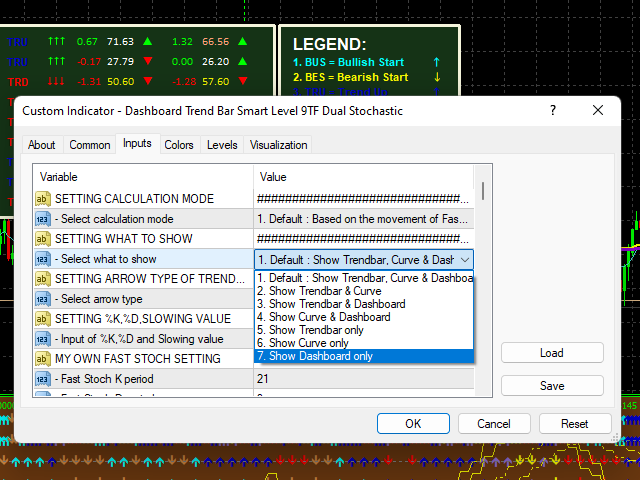
Capacidad para mostrar solo la barra de tendencias
Capacidad para mostrar solo la curva estocástica
Capacidad para mostrar solo el tablero
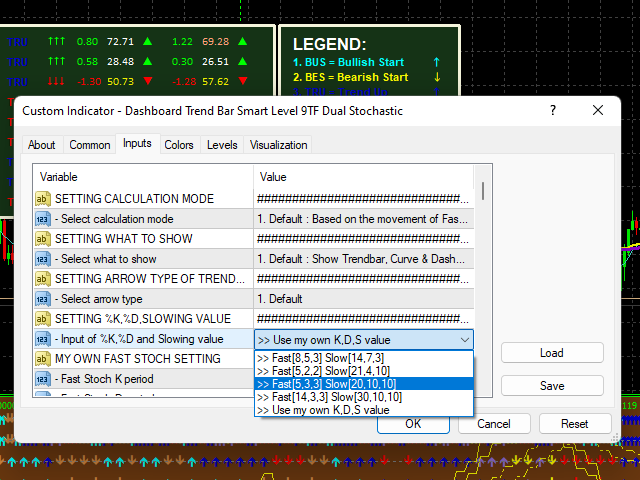
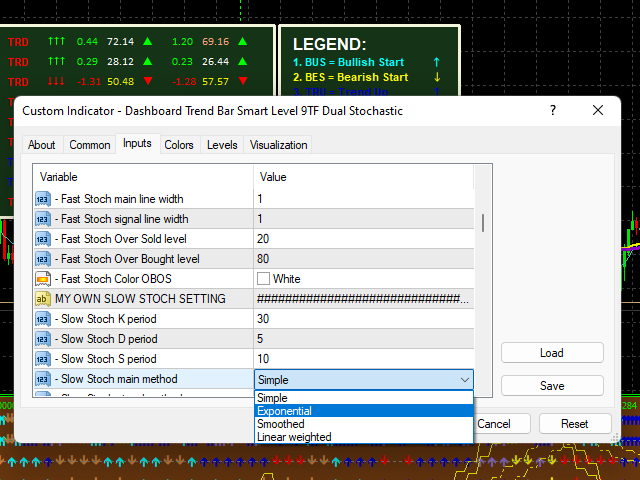
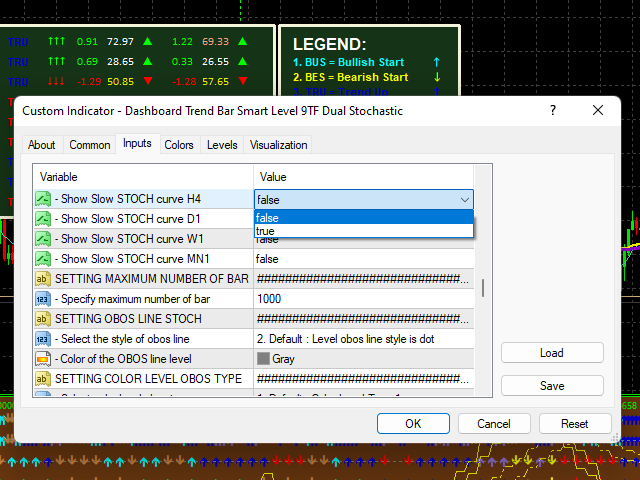
Posibilidad de seleccionar qué curva estocástica mostrar
Posibilidad de seleccionar el tipo de flecha de tendencia
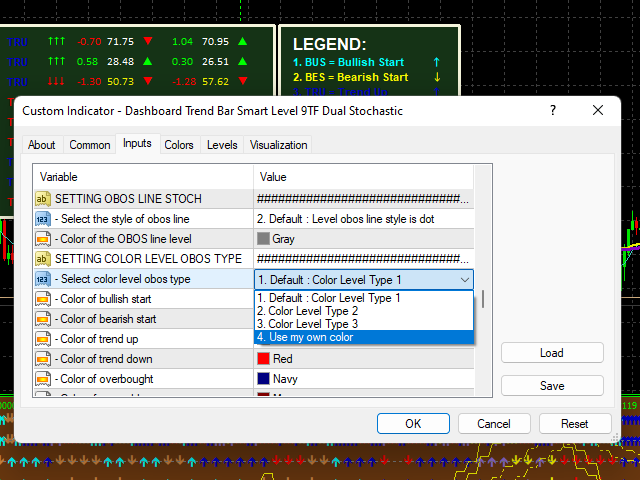
Posibilidad de seleccionar el estilo de línea obos
Posibilidad de mostrar/ocultar leyenda
Posibilidad de aumentar/disminuir el número de barras
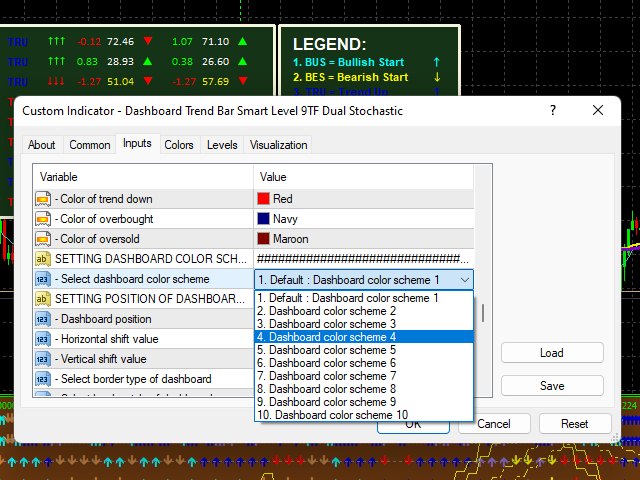
Posibilidad de seleccionar el nivel de combinación de colores
Posibilidad de seleccionar hasta 10 esquemas de color de la barra de tendencias del tablero
Posibilidad de cambiar el color de la curva estocástica
Este indicador ha pasado por una serie de pruebas. Los códigos de programación han sido escritos con mucho cuidado.

Realice entradas seguras con el mejor indicador comercial estocástico dual DTSL 9TF.

Obtenga ahora y opere como un profesional.

Gracias.
Productos recomendados
Owl smart levels
Sergey Ermolov
4.63 (54)
Versión MT5  |   FAQ El   Indicador Owl Smart Levels   es un sistema comercial completo dentro de un indicador que incluye herramientas de análisis de mercado tan populares como   los fractales avanzados de Bill Williams , Valable ZigZag que construye   la estructura de onda correcta   del mercado y   los niveles de Fibonacci   que marcan los niveles exactos de entrada. en el mercado y lugares para tomar ganancias. Descripción detallada de la estrategia Instrucciones para trabajar con el indi
Indicador de scalping de Forex que no vuelve a dibujar sus flechas. Funciona mejor en los plazos M5, M15, M30, H1. La configuración predeterminada es para el marco de tiempo M5. La siguiente imagen muestra un ejemplo de trabajo en el gráfico H1 con el valor del parámetro "período = 0,35". Puede descargar la versión demo y probarla usted mismo. Ahora usamos las señales de este indicador en casi todas nuestras estrategias de scalping. Según nuestros cálculos, la precisión de sus señales es de alr
Infinity Trend Pro
Yaroslav Varankin
1 (1)
This is a trend indicator without redrawing Developed instead of the binary options strategy (by the color of the Martingale candlestick) Also works well in forex trading When to open trades (binary options) A signal will appear in the place with a candle signaling the current candle It is recommended to open a deal for one candle of the current timeframe M1 and M5 When a blue dot appears, open a deal up When a red dot appears, open a trade down. How to open trades on Forex. When a signal is rec
Heiken Ashi Smoothed Strategy is a very simple but powerful system to get forex market trend direction. This indicator is actually 2 indicators in 1 pack, Heiken Ashi and Heiken Ashi Smoothed Moving Average both included. Because HA (Heiken Ashi) and HAS (Heiken Ashi Smoothed) are calculated in the same one system event with necessary buffers and loop only, so it is the FAST, OPTIMIZED and EFFICIENT HA having the combined indicator of MetaTrader 4. You can choose to display HA and HAS in the sam
Heiken Ashi candle chart is an improved version of The Japanese candle chart, which can effectively filter the market "noise" of the Japanese candle chart. It is favored by many traders for its simplicity and intuition. For trend traders, the HA candle chart is a magic tool. Unlike the traditional Japanese candle chart, Heikenashi does not reflect the opening price, high price, low price and closing price of the market. Instead, Heikenashi calculates the value of a single K line in the dominant
Trend PA
Mikhail Nazarenko
5 (3)
The Trend PA indicator uses   Price Action   and its own filtering algorithm to determine the trend. This approach helps to accurately determine entry points and the current trend on any timeframe. The indicator uses its own algorithm for analyzing price changes and Price Action. Which gives you the advantage of recognizing, without delay, a new nascent trend with fewer false positives. Trend filtering conditions can be selected in the settings individually for your trading style. The indicator
Nice Trade Point
Muhammed Emin Ugur
This    Nice Trade Point     indicator is designed for signal trading. This indicator generates trend signals. It uses many algorithms and indicators to generate this signal. It tries to generate a signal from the points with the highest trend potential. This indicator is a complete trading product. This indicator does not need any additional indicators. The indicator certainly does not repaint. The point at which the signal is given does not change.     Features and Suggestions Time
Be notified of every color change of Heiken Ashi (HA) candles. The indicator will trigger past and new signals every time that HA candles change their colors. Note : this tool is based on the code of Heiken Ashi indicator developed by MetaQuotes Software Corp. Features The signals are triggered at closing of last bar/opening of a new bar; Any kind of alerts can be enabled: Dialog Box, Email message, SMS notifications for smartphones and tablets, and Sound alerts; By default, up arrows are plot
VR Cub
Vladimir Pastushak
VR Cub es un indicador para obtener puntos de entrada de alta calidad. El indicador fue desarrollado para facilitar los cálculos matemáticos y simplificar la búsqueda de puntos de entrada a una posición. La estrategia comercial para la cual se diseñó el indicador ha demostrado su eficacia durante muchos años. La simplicidad de la estrategia comercial es su gran ventaja, que permite que incluso los operadores novatos negocien con éxito con ella. VR Cub calcula los puntos de apertura de posiciones
The indicator displays the data of the Stochastic oscillator from a higher timeframe on the chart. The main and signal lines are displayed in a separate window. The stepped response is not smoothed. The indicator is useful for practicing "manual" forex trading strategies, which use the data from several screens with different timeframes of a single symbol. The indicator uses the settings that are identical to the standard ones, and a drop-down list for selecting the timeframe. Indicator Parame
What are Heiken Ashi Candles? Heiken Ashi, derived from the Japanese term 'Heikin Ashi,' translates to average price bars. It's an indicator depicting price bars on a chart. Formula for Heiken Ashi candles: - Heiken Ashi opening price: (previous candle's opening + closing price) / 2 - Closing price Heiken Ashi: (opening + high + low + closing) / 4 - Heiken Ashi peak: Max of high, opening, or closing price - Heiken Ashi bottom price: Min of low, opening, or closing price How to Read Heik
Trendiness Index
Libertas LLC
5 (3)
"The trend is your friend" is one of the best known sayings in investing, because capturing large trendy price movements can be extremely profitable. However, trading with the trend is often easier said than done, because many indicators are based on price reversals not trends. These aren't very effective at identifying trendy periods, or predicting whether trends will continue. We developed the Trendiness Index to help address this problem by indicating the strength and direction of price trend
MACD Display is a MACD disaplay and cross monitoring indicator,which can works on 6 timeframe at same time. Indicator advantage: 1. Deviation from the point can be drawn on the main picture and indicator drawing. It is convenient to observe and can be hidden or displayed by parameter setting. 2. Deviation from the entry point is clearly indicated by the arrow in the drawing. 3. Cross-cycle monitoring can simultaneously monitor the MACD deviation and the golden dead fork of the six-cycle framewor
Stepping Trend
Mpendulo Chiliza
The Stepping Trend Indicator     The Steppi ng Trend indicator uses the  average true range  (ATR indicator) in its calculation. This gives you control to set your own average true range period, I set the Default as 10.   Indicator Details. Green Arrow Up: This means you are at the starting point of a new bullish trend, it’s time to buy.   Red  Arrow  Down : This means you are at the starting point of a new  bearish  trend, it’ s time to sell .   What if you miss the Arrow Signal?   No
Line Magnit
Aleksey Trenin
The LineMagnit Indicator for MT4 is a highly precise tool that builds support and resistance levels which magnetically attract prices. This feature allows traders to easily determine the most probable entry and exit points in the market, as well as identify the market's directional forces, as levels are based on capital inflows into the instrument. Equipped with an intuitively understandable graphical interface, the LineMagnit Indicator enables users to quickly locate and analyze support and res
Introduction It is common practice for professional trades to hide their stop loss / take profit from their brokers. Either from keeping their strategy to the themselves or from the fear that their broker works against them. Using this indicator, the stop loss / take profit points will be drawn on the product chart using the bid price. So, you can see exactly when the price is hit and close it manually.  Usage Once attached to the chart, the indicator scans the open orders to attach lines fo
ZhiBiCCI MT4
Qiuyang Zheng
5 (1)
Los indicadores [ZhiBiCCI] son ​​adecuados para todos los ciclos de uso y también son adecuados para todas las variedades de mercado. [ZhiBiCCI] La línea verde sólida es una reversión de la divergencia alcista. La línea de puntos verde es una divergencia alcista clásica. [ZhiBiCCI] La línea continua hacia el rojo es una divergencia bajista inversa. La línea roja punteada es una divergencia bajista clásica. [ZhiBiCCI] puede configurarse en los parámetros (Alerta, Enviar correo, Enviar notif
Trend Ray
Andriy Sydoruk
The indicator shows the potential trend direction by cyclical-wave dependence. Thus, all the rays of the intersection will be optimal rays, in the direction of which the price is expected to move, taking into account the indicator period. Rays can be used as a direction for potential market movement. But we must not forget that the approach must be comprehensive, the indicator signals require additional information to enter the market.
Signal trend indicator. Detects the direction of the trend and is coloured accordingly.  Has built in audible and visual alerts when trends change. Can send notifications to your phone or email. Allows Trend and Counter-Trend trading. Works on all timeframes, all currency pairs, metals, indices and cryptocurrencies. Can be used with binary options. Distinctive features No re-drawing; Simple and clear settings; Four types of alerts; Works on all timeframes and all trading tools; Su
Sto Signal AM
Andriy Matviyevs'kyy
5 (1)
This indicator displays Stochastic osc signals on the price chart and allows the user to receive notifications of such signals. The Stochastic indicator is a classic and proven indicator of the technical analysis of the markets. Despite its age, it is still relevant today. Depending on the settings, the indicator allows you to work effectively on various TFs and any markets. Signals are given on fully formed bars and are not redrawn. Custom Parameters: Stochastic_Price (0-1) - The applied pric
FREE
Renko, Heiken Ashi, Ticks Bar, Range Bar.    Easy switching, easy setup, all in one window.        Place the Custom Chart indicator and view Renko, Heiken Ashi, Tick bar, Range bar charts in real time at real chart.    Position the offline chart window so that the indicator control panel is visible.    Switch the chart mode by click of a button.    Connect to the output chart any indicator, expert advisor without any restrictions.    No, it doesn't work in the tester.    Yes, you can use an
DYJ Alligator SignalSource   is based on Alligator   indicator. It can be used for any currency pair and timeframe. The blue line (Alligator's Jaw) is the Balance Line for the timeframe that was used to build the chart (13-period Smoothed Moving Average, moved into the future by 8 bars); Red Line (Alligator's Teeth) is the Balance Line for the value timeframe of one level lower (8-period Smoothed Moving Average, moved by 5 bars into the future); Green Line (Alligator's Lips) is the Balance Line
Basado en ondas indicadoras MACD con parámetros estándar Aplica los niveles de Fibonacci a las dos últimas ondas MACD, positivas y negativas respectivamente, si en el momento en que el indicador MACD se queda sin Onda negativa - el color es verde, si en el momento en que el indicador MACD se queda sin Onda positiva - el color es rojo. El criterio de terminación de onda son dos ticks con un signo MACD diferente. Aplica líneas de tendencia en las últimas cuatro ondas MACD. Trabaja bien
Dark Oscillator
Marco Solito
4.39 (18)
Dark Oscillator   is an Indicator for intraday trading. This Indicator is based on   Counter Trend  strategy, trying to intercept changes in direction, in advance compared trend following indicators.  We can enter in good price with this Indicator, in order to follow the inversion of the trend on the current instrument. It is advised to use low spread ECN brokers. This Indicator does   Not repaint   and   N ot lag . Recommended timeframes are M5, M15 and H1. Recommended working pairs: All. I nst
"Fractales ajustables": es una versión avanzada del indicador fractal, ¡una herramienta comercial muy útil! Como sabemos, el indicador Standard fractals mt4 no tiene ninguna configuración, lo que es muy inconveniente para los traders. Ajustable Fractals ha resuelto ese problema: tiene todas las configuraciones necesarias: Período ajustable del indicador (valores recomendados - superiores a 7) Distancia ajustable desde máximos/mínimos de precio Diseño ajustable de flechas fractales. // Más a
The Th3Eng PipFinite indicator is based on a very excellent analysis of the right trend direction with perfect custom algorithms. It show the true direction and the best point to start trading. With StopLoss point and Three Take Profit points. Also it show the right pivot of the price and small points to order to replace the dynamic support and resistance channel, Which surrounds the price. And Finally it draws a very helpful Box on the left side on the chart includes (take profits and Stop loss
Chart Patterns Detect 15 patterns (Ascending Triangle, Descending Triangle, Rising Wedge, Falling Wedge, Bullish Flag, Bearish Flag, Bullish Rectangle, Bearish Rectangle Symmetrical triangle, Head and Shoulders, Inverted Head and Shoulders, Triple top, Triple Bottom, Double Top, Double Bottom) Use historical data to calculate the probability of each pattern to succeed (possibility to filter notification according to the chance of success) gives graphic indication about the invalidation level and
PipFinite Trend PRO
Karlo Wilson Vendiola
4.9 (2779)
Breakthrough Solution For Trend Trading And Filtering With All Important Features Built Inside One Tool! Trend PRO's smart algorithm detects the trend, filters out market noise and gives entry signals with exit levels. The new features with enhanced rules for statistical calculation improved the overall performance of this indicator. Important Information Revealed Maximize the potential of Trend Pro, please visit www.mql5.com/en/blogs/post/713938 The Powerful Expert Advisor Version Automa
Signal Undefeated   indicator is designed for trend and signal trading. This indicator generates trend signals.  It uses many algorithms and indicators to generate this signal. It tries to generate a signal from the points with the highest trend potential. This indicator is a complete trading product. This indicator does not need any additional indicators.  You can only trade with this indicator. The generated signals are displayed on the graphical screen.  Thanks to the alert features you can g
El indicador construye cotizaciones actuales, que se pueden comparar con las históricas y, sobre esta base, hacer un pronóstico de movimiento de precios. El indicador tiene un campo de texto para una navegación rápida a la fecha deseada. Opciones: Símbolo - selección del símbolo que mostrará el indicador; SymbolPeriod - selección del período del cual el indicador tomará datos; IndicatorColor - color del indicador; HorisontalShift: cambio de cotizaciones dibujadas por el indicador
Los compradores de este producto también adquieren
Scalper Inside PRO
Alexey Minkov
4.75 (59)
An exclusive indicator that utilizes an innovative algorithm to swiftly and accurately determine the market trend. The indicator automatically calculates opening, closing, and profit levels, providing detailed trading statistics. With these features, you can choose the most appropriate trading instrument for the current market conditions. Additionally, you can easily integrate your own arrow indicators into Scalper Inside Pro to quickly evaluate their statistics and profitability. Scalper Inside
¡Actualmente 20% OFF ! ¡La mejor solución para cualquier novato o trader experto! Este software funciona con 28 pares de divisas. Se basa en 2 de nuestros principales indicadores (Advanced Currency Strength 28 y Advanced Currency Impulse). Proporciona una gran visión general de todo el mercado de divisas. Muestra los valores de Advanced Currency Strength, la velocidad de movimiento de las divisas y las señales para 28 pares de divisas en todos los (9) marcos temporales. Imagine cómo mejorar
TPSpro RFI Levels
Roman Podpora
4.86 (21)
Reversal First Impulse levels (RFI)    INSTRUCTIONS        RUS       -       ENG              R ecommended to use with an indicator   -   TPSpro  TREND PRO -  Version MT5 A key element in trading is zones or levels from which decisions to buy or sell a trading instrument are made. Despite attempts by major players to conceal their presence in the market, they inevitably leave traces. Our task was to learn how to identify these traces and interpret them correctly. Main functions: Displaying activ
AT Forex Indicator MT4
Marzena Maria Szmit
5 (2)
The AT Forex Indicator MT4 is a sophisticated trading tool designed to provide traders with a comprehensive analysis of multiple currency pairs. This   powerful indicator   simplifies the complex nature of the forex market, making it accessible for both novice and experienced traders. AT Forex Indicator uses   advanced algorithms   to detect trends, patterns and is an essential tool for traders aiming to enhance their forex trading performance. With its robust features, ease of use, and reliabl
TPSproTREND PrO
Roman Podpora
4.78 (18)
TPSpro TRENDPRO  - is a trend indicator that automatically analyzes the market and provides information about the trend and each of its changes, as well as giving signals for entering trades without redrawing! The indicator uses each candle, analyzing them separately. referring to different impulses - up or down impulse. Exact entry points into transactions for currencies, crypto, metals, stocks, indices!  -  Version MT5               DETAILED DESCRIPTION                R ecommended to use with
FX Power MT4 NG
Daniel Stein
5 (11)
Obtenga su actualización diaria del mercado con detalles y capturas de pantalla a través de nuestro Morning Briefing aquí en mql5 y en Telegram ! FX Power MT4 NG es la nueva generación de nuestro popular medidor de fuerza de divisas, FX Power. ¿Y qué ofrece este medidor de fuerza de nueva generación? Todo lo que le encantaba del FX Power original PLUS Análisis de fuerza de ORO/XAU Resultados de cálculo aún más precisos Períodos de análisis configurables individualmente Límite de cálculo persona
Indicator : RealValueIndicator Description : RealValueIndicator is a powerful tool designed specifically for trading on the EURUSD pair. This indicator analyzes all EUR and USD pairs, calculates their real currency strength values, and displays them as a single realistic value to give you a head start on price. This indicator will tell you moves before they happen if you use it right. RealValueIndicator allows you to get a quick and accurate overview of the EURUSD currency pair tops and bottoms,
Atomic Analyst
Issam Kassas
5 (3)
En primer lugar, vale la pena enfatizar que este Indicador de Trading no repinta, no redibuja y no se retrasa, lo que lo hace ideal tanto para el trading manual como para el automatizado. Manual del usuario: configuraciones, entradas y estrategia. El Analista Atómico es un Indicador de Acción del Precio PA que utiliza la fuerza y el impulso del precio para encontrar una mejor ventaja en el mercado. Equipado con filtros avanzados que ayudan a eliminar ruidos y señales falsas, y aumentan el poten
ACTUALMENTE 26% DE DESCUENTO ¡La mejor solución para cualquier operador novato o experto! Este indicador es una herramienta única, de alta calidad y asequible porque hemos incorporado una serie de características propias y una nueva fórmula. ¡Con sólo UN gráfico puede leer la Fuerza de la Divisa para 28 pares de Divisas! Imagínese cómo mejorará su operativa porque podrá señalar el punto exacto de activación de una nueva tendencia o de una oportunidad de scalping. Manual del usuario: haga
Introduciendo       Indicador Quantum Trend Sniper   , el innovador indicador MQL5 que está transformando la forma en que identificas y negocias los cambios de tendencia. Desarrollado por un equipo de comerciantes experimentados con experiencia comercial de más de 13 años,       Indicador de francotirador de tendencia cuántica       está diseñado para impulsar su viaje comercial a nuevas alturas con su forma innovadora de identificar cambios de tendencia con una precisión extremadamente alta.
Advanced Supply Demand
Bernhard Schweigert
4.92 (313)
¡Actualmente con 33% de descuento! ¡La mejor solución para cualquier tráder principiante o experto! Este indicador es una herramienta comercial única, de alta calidad y asequible, porque incorpora una serie de características patentadas y una nueva fórmula. Con esta actualización, podrá mostrar zonas de doble marco temporal. No solo podrá mostrar un marco temporal más alto, sino también mostrar ambos, el marco temporal del gráfico MÁS el marco temporal más alto: MOSTRANDO ZONAS ANIDADAS. A todos
TrendMaestro
Stefano Frisetti
5 (3)
note: this indicator is for METATRADER4, if you want the version for METATRADER5 this is the link:  https://www.mql5.com/it/market/product/108106 TRENDMAESTRO ver 2.4 TRENDMAESTRO recognizes a new TREND in the bud, he never makes mistakes. The certainty of identifying a new TREND is priceless. DESCRIPTION TRENDMAESTRO identifies a new TREND in the bud, this indicator examines the volatility, volumes and momentum to identify the moment in which there is an explosion of one or more of these data a
JULY OFFER 80% OFF next price for unlimited version will be 17000$. This is the only time you can get this institutional and professional indicator at this price for unlimited version. Don't dare to miss this. The tool I am about to introduce to you you can't compare it with other tools due to its strategy and accuracy level in predicting the next price directional movement . This tool is designed for serious traders who have decided to make a difference through trading. Be the next person to wi
Quantum Breakout Indicator PRO
Bogdan Ion Puscasu
4.96 (26)
Introduciendo       Quantum Breakout PRO   , el innovador indicador MQL5 que está transformando la forma en que comercia con Breakout Zones. Desarrollado por un equipo de operadores experimentados con experiencia comercial de más de 13 años,   Quantum Breakout PRO   está diseñado para impulsar su viaje comercial a nuevas alturas con su innovadora y dinámica estrategia de zona de ruptura. El indicador de ruptura cuántica le dará flechas de señal en las zonas de ruptura con 5 zonas objetivo de
Enigmera
Ivan Stefanov
5 (4)
ENIGMERA: El núcleo del mercado https://www.enigmera.com Introducción Este indicador y sistema de negociación es un enfoque extraordinario de los mercados financieros. ENIGMERA utiliza los ciclos fractales para calcular con precisión los niveles de soporte y resistencia. Muestra la auténtica fase de acumulación y proporciona dirección y objetivos.  Un sistema que funciona tanto si estamos en una tendencia como en una corrección.  ¿Cómo funciona? ENIGMERA consta de tres líneas: la línea de s
Cycle Sniper
Elmira Memish
4.41 (37)
NEW YEAR SALE PRICE FOR LIMITED TIME!!! Please contact us after your purchase and we will send you the complimentary indicators to complete the system Cycle Sniper is not a holy grail but when you use it in a system which is explained in the videos, you will feel the difference. If you are not willing to focus on the charts designed with Cycle Sniper and other free tools we provide, we recommend not buying this indicator. We recommend watching the videos about the indiactor and system before pu
FX Volume
Daniel Stein
4.61 (36)
Obtenga su actualización diaria del mercado con detalles y capturas de pantalla a través de nuestro Morning Briefing aquí en mql5 y en Telegram ! FX Volume es el PRIMER y ÚNICO indicador de volumen que proporciona una visión REAL del sentimiento del mercado desde el punto de vista de un bróker. Proporciona una visión impresionante de cómo los participantes institucionales del mercado, como los brokers, están posicionados en el mercado Forex, mucho más rápido que los informes COT. Ver esta info
TakePropips Donchian Trend Pro
Eric John Pajarillaga Aldana
4.61 (18)
¡TakePropips Donchian Trend Pro   (MT4) es una herramienta poderosa y efectiva que detecta automáticamente la dirección de la tendencia utilizando el Canal Donchian y le proporciona señales comerciales de entrada y salida! Este indicador multifunción incluye un escáner de tendencias, señales comerciales, panel estadístico, filtro, sesiones comerciales y panel de historial de alertas. ¡Está diseñado para proporcionarle señales comerciales y ahorrarle horas analizando los gráficos! Puede descargar
Entry Points Pro
Yury Orlov
4.7 (226)
Este es un genial indicador para MT4 que ofrece señales precisas para entrar en una transacción sin redibujar. Se puede aplicar a cualquier activo financiero: fórex, criptomonedas, metales, acciones, índices. Nos dará valoraciones bastante precisas y nos dirá cuándo es mejor abrir y cerra una transacción. Eche un vistazo  al vídeo  (6:22), ¡contiene un ejemplo de procesamiento de una sola señal que ha amortizado el indicador! La mayoría de los tráders mejoran sus resultados comerciales durante l
GOLD Impulse with Alert
Bernhard Schweigert
4.56 (9)
Este indicador es una super combinación de nuestros 2 productos Advanced Currency IMPULSE with ALERT  +   Currency Strength Exotics . ¡Funciona para todos los marcos de tiempo y muestra gráficamente el impulso de fuerza o debilidad para las 8 divisas principales más un Símbolo! Este Indicador está especializado en mostrar la aceleración de la fuerza de la divisa para cualquier símbolo como Oro, Pares Exóticos, Materias Primas, Índices o Futuros. Es el primero de su clase, cualquier símbol
Volume by Price MT4
Brian Collard
4.71 (14)
The Volumebyprice.com technical indicator for MetaTrader 4 features Volume Profile and Market Profile TPO (Time Price Opportunity). Volume and TPO histogram bar and line charts. Volume Footprint charts. TPO letter and block marker collapsed and split structure charts. Session filtering and grouping. Static, dynamic and flexible range segmentation and compositing methods with relative and absolute visualizations. Graphical layering, positioning and styling options to suit the user's analytic and
PTS Precision Index Oscillator V2
PrecisionTradingSystems
5 (2)
El Oscilador de Índice de Precisión (Pi-Osc) de Roger Medcalf de Precision Trading Systems La versión 2 ha sido cuidadosamente recodificada para cargar rápidamente en su gráfico y se han incorporado algunas otras mejoras técnicas para mejorar la experiencia. El Pi-Osc fue creado para proporcionar señales precisas de temporización de operaciones diseñadas para encontrar puntos de agotamiento extremos, los puntos a los que los mercados se ven obligados a llegar solo para eliminar las órdenes
Welcome to the world of SMC (Smart Money Concepts) Trading, where we empower traders with the tools and knowledge to make smarter trading decisions. Our latest addition to our suite of trading tools is the SMC Trading Pro indicator, version 1.0. Key Features: Major Market Structure Identification with BODY break. Order Block must be in Major Swing ( not Small Swing ). Order Block with Fair Value Gap Detection. Order Block in Discount | Premium zone. Filter for only Bullish, Bearish or All Order
ZeusArrow Smart Liquidity Finder  Smart Liquidity Finder is Ai controlled indicator based on the Idea of Your SL is My Entry. It scan and draws the major Liquidity areas on chart partitioning them with Premium and Discount Zone and allows you find the best possible trading setups and help you decide the perfect entry price to avoid getting your Stop Loss hunted . Now no more confusion about when to enter and where to enter. Benefit from this one of it's kind trading tool powered by Ai an trade
All in One Trade
Alexey Minkov
4.48 (27)
The All-in-One Trade Indicator (AOTI) determines daily targets for EURUSD, EURJPY, GBPUSD, USDCHF, EURGBP, EURCAD, EURAUD, AUDJPY, GBPAUD, GBPCAD, GBPCHF, GBPJPY, AUDUSD, and USDJPY. All other modules work with any trading instruments. The indicator includes various features, such as Double Channel trend direction, Price channel, MA Bands, Fibo levels, Climax Bar detection, and others. The AOTI indicator is based on several trading strategies, and created to simplify market analysis. All-in-One
A. ¿Qué es A2SR ?   * Es un indicador técnico líder (sin repintado, sin retraso). -- Guía : -- en https://www.mql5.com/en/blogs/post/734748/page4#comment_16532516 -- y https://www.mql5.com/en/users/yohana/blog A2SR tiene una técnica especial para determinar los niveles de Soporte (demanda) y Resistencia (oferta). A diferencia de la forma ordinaria que vimos en la red, A2SR tiene un concepto original para determinar los niveles reales de SR. La técnica original no se tomó de Internet y tampoco
Este tablero muestra los últimos patrones armónicos disponibles para los símbolos seleccionados, por lo que ahorrará tiempo y será más eficiente / versión MT5 . Indicador gratuito: Basic Harmonic Pattern Columnas del indicador Symbol: aparecerán los símbolos seleccionados Trend : alcista o bajista Pattern : tipo de patrón (gartley, mariposa, murciélago, cangrejo, tiburón, cifrado o ABCD) Entry : precio de entrada SL: precio de stop loss TP1: 1er precio de toma de beneficios TP2: 2º precio de
Beast Super Signal
Dustin Vlok
4.76 (101)
¿Está buscando un potente indicador de compraventa de divisas que pueda ayudarlo a identificar oportunidades comerciales rentables con facilidad? No busque más allá de Beast Super Signal. Este indicador basado en tendencias fácil de usar monitorea continuamente las condiciones del mercado, buscando nuevas tendencias en desarrollo o saltando sobre las existentes. Beast Super Signal da una señal de compra o venta cuando todas las estrategias internas se alinean y están en 100% de confluencia entr
FxBears Powers
Rachid Lafhil
3 (2)
️️ Attention:      The price will soon be raised to what it was before ($500).      No more losses with this indicator, test it for years ago and see if there is losses in one day results. but before testing it please see the explaining video down here.    FxBears Powers is working on all forex pairs, metals, commodities, futures, indices, energies, crypto, and everything...and on all timeframes from M1 to MN.   It's based on supply and demand zones, price action, and some internal indicators,
NAM Order Blocks
NAM TECH GROUP, CORP.
5 (1)
Indicador de detección de Order Blocks multitimeframe para MT4. Características - Panel de control totalmente personalizable, proporciona una interacción completa. - Oculta y muestra el panel de control donde quieras. - Detecta OB en múltiples marcos de tiempo. - Permite seleccionar la cantidad de OB para mostrar. - Interfaz de usuario de diferentes OBs. - Diferentes filtros de OBs (regulares, rejection y sin capitalizar). - Alerta de proximidad de OBs. - Líneas ADR High y Low. - Servicio de not
Otros productos de este autor
Analizar múltiples marcos de tiempo de un par de divisas en una ventana puede confundirlo. Para analizar múltiples marcos de tiempo, necesita indicadores confiables. Uno de ellos está usando 9TF MACD Curve. He estado trabajando día y noche para crear un código que sea simple pero confiable y cubra los nueve marcos de tiempo en un solo indicador. Veamos algunas de las ventajas de este indicador: Histograma colorido. El color de la curva en cada período de tiempo es diferente entre sí.
Analizar múltiples marcos de tiempo de un par de divisas en una ventana puede confundirlo. Para analizar múltiples marcos de tiempo, necesita indicadores confiables. Uno de ellos está utilizando 9TF STOCH RSI. He estado trabajando día y noche para crear un código que sea simple pero confiable y cubra los nueve marcos de tiempo en un solo indicador. Veamos algunas de las ventajas de este indicador: Histograma colorido. El color de la curva en cada período de tiempo es diferente entre s
Analyzing multiple time frames of a currency pair in one window can make you confused. To analyze multiple time frames, you need reliable indicators. One of them is using 9TF RSI MA . I've been working day and night to create code that is simple but reliable and covers all nine time frames in just one indicator .  Let's look at some of the advantages of this indicator: Colorful histogram . The color of the curve in each timeframe is different from one another.  Arrows indicating the crossing of
Analyzing multiple time frames of a currency pair in one window can make you confused. To analyze multiple time frames, you need reliable indicators. One of them is using 9TF MACD Limited Bar . I've been working day and night to create code that is simple but reliable and covers all nine time frames in just one indicator .  Attention! When first installed, the indicator does not look intact. Changing the timeframe will solve the problem. Let's look at some of the advantages of this indicator: C
Analyzing multiple time frames of a currency pair in one window can make you confused. To analyze multiple time frames, you need reliable indicators. One of them is using 9TF STOCH RSI LIMITED BAR . I've been working day and night to create code that is simple but reliable and covers all nine time frames in just one indicator .  Attention! When first installed, the indicator does not look intact. Changing the timeframe will solve the problem. Let's look at some of the advantages of this indicat
Analizar múltiples marcos de tiempo de un par de divisas en una ventana puede confundirlo. Para analizar múltiples marcos de tiempo, necesita indicadores confiables. Uno de ellos está usando 9TF Double RSI Double MA. He estado trabajando día y noche para crear un código que sea simple pero confiable y cubra los nueve marcos de tiempo en un solo indicador. Veamos algunas de las ventajas de este indicador: Doble RSI, es decir, RSI más rápido y RSI más lento. Doble MA, es decir, MA más r
Analizar múltiples marcos de tiempo de un par de divisas en una ventana puede confundirlo. Para analizar múltiples marcos de tiempo, necesita indicadores confiables. Uno de ellos está usando 9TF Double CCI Double MA. He estado trabajando día y noche para crear un código que sea simple pero confiable y cubra los nueve marcos de tiempo en un solo indicador. Veamos algunas de las ventajas de este indicador: Doble CCI, es decir, CCI más rápido y CCI más lento. Doble MA, es decir, MA más r
Se encuentra disponible un indicador CCI preciso. Dashboard Trend Bar Smart Level 9TF Doble CCI. Doble CCI, es decir, CCI rápido y CCI lento ¿Por qué necesita un segundo CCI? El uso de indicadores adicionales nos convencerá más en el comercio en vivo Curva CCI rápida 9TF 9TF Curva CCI lenta Ángulo CCI en tiempo real 9TF 9TF valor CCI en tiempo real 9TF dirección/fase CCI en tiempo real Barra de tendencia 9TF Nuevo algoritmo en el cálculo de la barra de tendencia. Boton de encendido / apagado.
Un indicador RSI preciso está disponible. Dashboard Trend Bar Smart Level 9TF Doble RSI. Doble RSI, es decir, RSI rápido y RSI lento ¿Por qué necesitas un segundo RSI? El uso de indicadores adicionales nos convencerá más en el comercio en vivo Curva RSI rápida 9TF 9TF Curva RSI lenta Ángulo RSI en tiempo real 9TF Valor RSI en tiempo real 9TF 9TF RSI en tiempo real dirección/fase Barra de tendencia 9TF Nuevo algoritmo en el cálculo de la barra de tendencia. Boton de encendido / apagado. Muy út
Un indicador MACD preciso está disponible. Dashboard Trend Bar Smart Level 9TF Doble MACD. MACD dual, es decir, rápido (MACD 1) y lento (MACD 2) ¿Por qué necesitas un segundo MACD? El uso de indicadores adicionales nos convencerá más en el comercio en vivo Curva 9TF Fast MACD 1 9TF Curva MACD 2 lenta Ángulo MACD en tiempo real 9TF Valor MACD en tiempo real 9TF Dirección MACD en tiempo real 9TFSe encuentra disponible un indicador MACD preciso. Dashboard Trend Bar Smart Level 9TF Doble MACD.
Si a menudo pierde operaciones porque solo usa un indicador, pruebe esta herramienta comercial. Esta herramienta comercial utiliza más de un indicador. A menudo observo a traders que sólo utilizan el indicador RSI. Muy a menudo el mercado está sobrevendido pero todavía está abajo o el mercado está sobrecomprado pero todavía está arriba. Por este motivo, es necesario utilizar más de un indicador. Presentamos la nueva versión V 3.40 MTF PPAAF: Flecha de acción de precio precisa de múltiples marco
[V 1.00] ¡Se ha lanzado MTF NRPA 5 Moving Average RTD! Panel de control en tiempo real de flecha sin repintar. Si está buscando el mejor indicador de promedio móvil, entonces está en la página correcta. Generalmente, la gente instalará dos medias móviles porque la intersección de las dos medias móviles (el cruce) determinará la dirección de la próxima tendencia de precios. Si el promedio móvil rápido se cruza con el promedio móvil lento y rápido > lento, entonces la tendencia es alcista. Po
[V 1.00] ¡Se ha lanzado MTF NRPA 5 RSI RTD! Panel de control en tiempo real de flecha sin repintar. Si está cansado de usar varios indicadores RSI pero descubre que son inexactos, pruebe esta herramienta. Por lo general, las personas solo instalan 1 RSI para determinar el nivel de OBOS en un período de tiempo. La mala noticia es que no puede ver los niveles y las tendencias de OBOS en varios períodos de tiempo a la vez. Es por eso que desarrollé esta herramienta comercial. Así es como se
Introducing the advanced trading tools of 2023. MTF PPAAF Model S. This is sub window version of my best trading tool : MTF Precise Price Action Arrow Filtered.  Click here to learn more about MTF PPAAF . This trading tool is equipped with various powerful features : MTF = Multi Time Frame = Time Frame can be changed. On/off button. Non Repaint Arrows.  Customizable parameter, color etc.  Can show all time frame (ATF) crossover arrows of fast stochastic main line & fast stochastic signal line (
If you are curious about the position of the stochastic, RSI, CCI curve, whether it is at the OBOS level or not, then this trading tool is for you. Introducing the advanced trading tools of 2024. ATF Trend Following Trend Bar OBOS. This indicator is similar to MTF PPAAF Model S but have two layers.  Click here to learn more about MTF PPAAFS . This trading tool is equipped with various powerful features : MTF = Multi Time Frame = Time Frame can be changed. On/off button. Customizable parameter,
Hola comerciantes. Presentamos mi mejor herramienta comercial. DM PPAAF Modelo T. Marco de tiempo múltiple Flecha de acción de precio precisa filtrada Modelo T.  Esta herramienta comercial es mi mejor trabajo después de años de crear varias herramientas comerciales. ¿Por qué esta herramienta comercial es la mejor y confiable?  1. Esta herramienta utiliza 6 indicadores:  Doble CCI = CCI rápido x CCI lento Estocástico dual = estocástico rápido (línea principal del estocástico
Con esta herramienta comercial, puede escanear 15 mercados simultáneamente. Presentamos el nuevo indicador comercial 2024: ️ Tablero Estocástico de marco de tiempo múltiple y moneda múltiple. Hay al menos dos razones por las que creé esta herramienta comercial: Primero, estoy aburrido de observar sólo un mercado. En segundo lugar, no quiero perder el momento de entrada en otro mercado. Por eso quiero conocer al mismo tiempo otras condiciones del mercado. Por este motivo, necesito u
Con esta herramienta comercial, puede escanear 15 mercados simultáneamente. Presentamos el nuevo indicador comercial 2024: ️ Panel de control Multidivisa Multiplazo Doble CCI. Hay al menos dos razones por las que creé esta herramienta comercial: En primer lugar, estoy aburrido de observar sólo un mercado. En segundo lugar, no quiero perder el momento de entrada en otro mercado. Por eso quiero conocer al mismo tiempo otras condiciones del mercado. Por este motivo, necesito un escáne
Con esta herramienta comercial, puede escanear 15 mercados simultáneamente. Presentamos el nuevo indicador comercial 2024: ️ Panel de control Multidivisa Múltiple Marco de tiempo Doble RSI. Hay al menos dos razones por las que creé esta herramienta comercial: Primero, estoy aburrido de observar sólo un mercado. En segundo lugar, no quiero perder el momento de entrada en otro mercado. Por eso quiero conocer al mismo tiempo otras condiciones del mercado. Por este motivo, necesito un
Filtro:
No hay comentarios
Respuesta al comentario