Abiroid PSAR Scanner
- Indicadores
- Abir Pathak
- Versión: 1.1
- Activaciones: 20
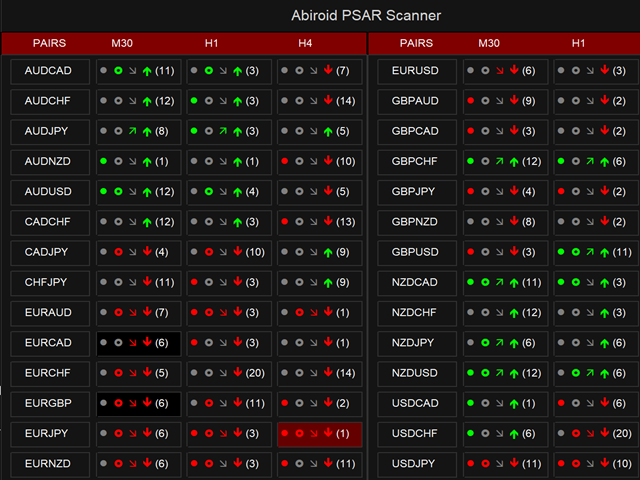
PSAR Scanner Dashboard for MT4:
(Multi-timeframe and Multi-currency)
Parabolic SAR (Stop and Release) Indicator is mainly for analyzing the trending markets.
And this dashboard will look for the switch and also other strategies.
Features:
- Scan for PSAR Switch
- Show how many bars back the switch happened
- Check ADX line is between min and max range specified
- Check -DI > +DI for SELL
- And +DI > -DI for BUY
- Check Higher Timeframe PSAR Alignment
- Check if Moving Averages are stacked in an up/down trend
https://www.mql5.com/en/blogs/post/751483
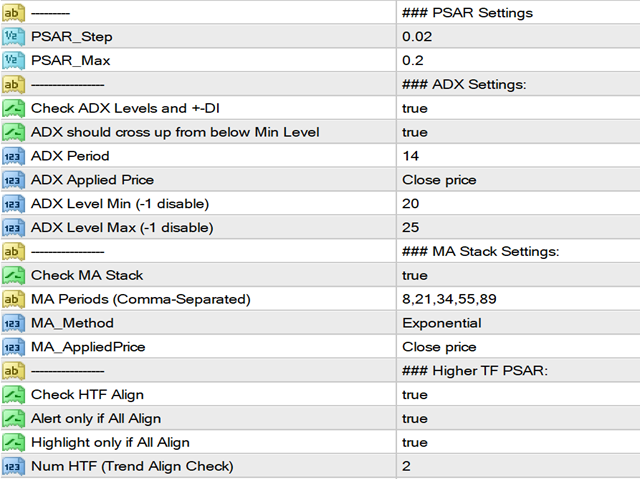
PSAR Settings:
Step and Max will calculate the P-SAR values. And scanner will show how many bars back a switch had happened.
Note: All other conditions will only be matched in direction of ongoing PSAR. If direction is not aligned, then symbol will be grey.
When the switch happens, it will show that bar number in brackets. So, you can see how many bars back, the last switch happened.
ADX Settings:
The 1st symbol which is a small dot shows ADX.
Green dot: shows all ADX conditions match for Up Trend. While Red dot shows a match for Down Trend
Grey means that ADX is not aligned in direction of current PSAR.
Condition 1: ADX is between Min and Max Level values.
Condition 2: For BUY: +DI > -DI and For SELL: -DI > +DI
Moving Average Stack Settings:
You can specify MA period separated by commas.
You can use this free indicator to spot MA Stacks:
https://www.mql5.com/en/market/product/69539
If Faster MA (smallest period) is above slower MAs and all MAs are stacked in this way, then it indicates an Up Trend.
The circle shaped like a doughnut :)
It indicates if MA Trend is aligned with PSAR direction. Grey indicates that alignment has not yet happened.
Note: If PSAR is in an up trend, and MA is in a down trend, even then MA symbol will be grey. And not red.
This is to avoid confusion that too many different color symbols will bring.
Higher Timeframe PSAR Align Settings:
You can specify number of HTF to check. Suppose current TF is M15 and num is 2.
Then it will check of M30 and H1 both have PSAR aligned in same direction.
If alignment is there, then the slanting arrow will be shown in that direction.
Or else it will be grey.
Best Way To Use:
Default settings can be a bit restrictive, because ADX levels are set at a very small gap 20-25.
This is good for stronger signals. But for quick scalping, you can use a bigger ADX level gap like 20-30
This will give more signals. Make sure to only trade in direction of higher ongoing trends.
Example Strategies:
If strong breakout bar has broken through a Pivot level.
In that case place a Limit order near that Pivot level. For Buy Limit order, place it slightly above Pivot.
And for SELL Limit order, place it slightly below the Pivot.
Pivot levels are like magnets, and a range forms near them a lot of the times.
Even after a pivot level breakout, price might still retrace back to it.
In the above missed example, there was a News event which gave that really long down trend.
So, be careful trading near News Events.
And same way, don’t trade this strategy during very slow low volatility markets.

