KT Half Trend MT4
- Indicadores
- KEENBASE SOFTWARE SOLUTIONS
- Versión: 1.0
- Activaciones: 5
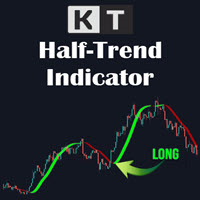
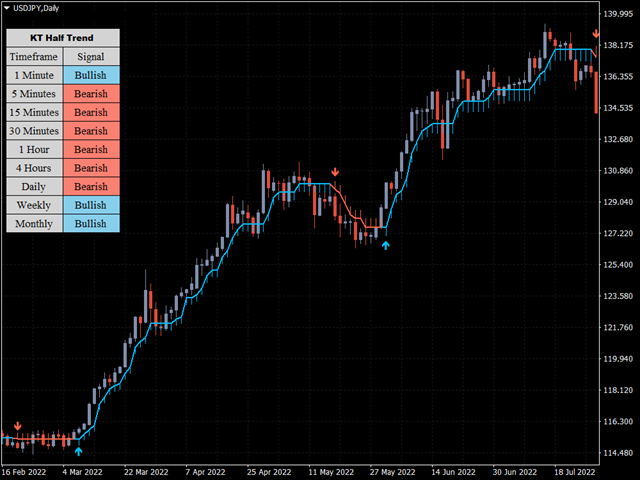
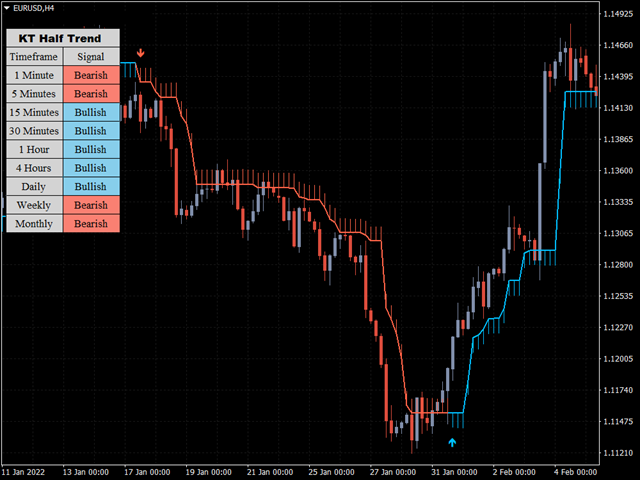
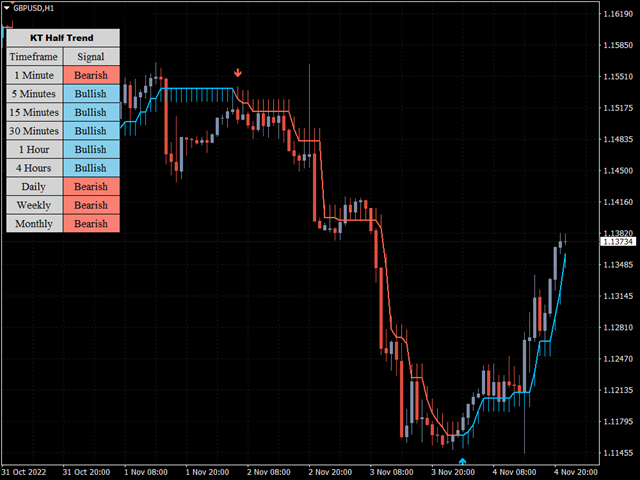
The KT HalfTrend is a moving average-based trend indicator that draws zones. It marks a trend shift by drawing bearish and bullish invalidation zones on the chart.
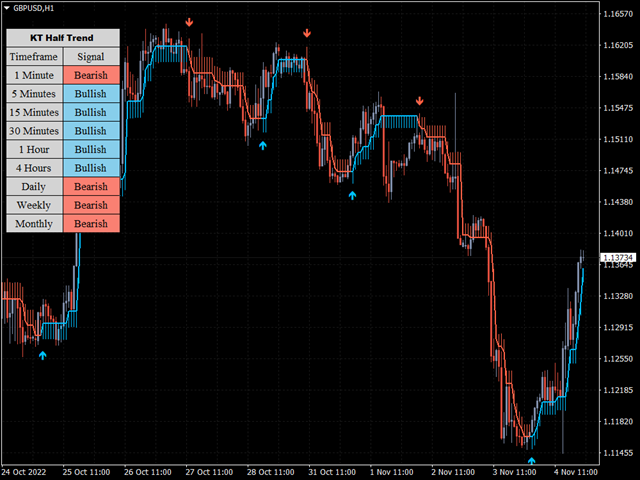
It also displays the trend buy-sell strength with arrows on the main chart. The indicator will be flat if no trend indicates accumulation, temporary price, or distribution zones. If there is a trend, there will be a slope in that direction.
The trend signals are substantial if the slope is steep, either to the upside or the downside. The indicator can mark a strong uptrend with a highlight color like blue. It can mark a strong downtrend with another highlight color, like red.
Features
- It is a very user-friendly and distinctive indicator.
- It can be used successfully with any currency pair and time frame.
- It provides information on both rough and smooth entries.
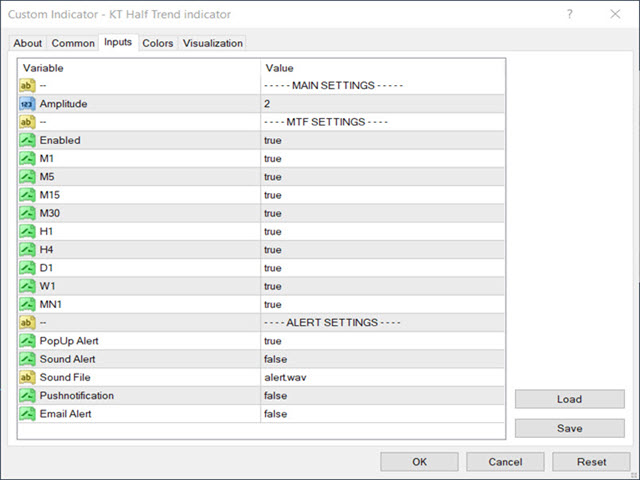
- You can customize the moving average, Parabolic SaR settings, and visual color features.
Applications
Generally, buying conditions are associated with the asset price rising above the slope of the indicator and the half trend turning blue.
Then, below the price candle, you should see a blue-colored upward candle, representing bullishness. It indicates that a stop-loss order should be placed below the indicator.
When you see a red-colored downtrend arrow showing bearishness, you should either exit your long position or place a take-profit order.
Selling conditions are generally associated with the asset price falling below the slope of the indicator and the half trend turning a bearish color like red.
Then, above the price candle, you should see a red downtrend candle. It indicates that a stop-loss order should be placed above the indicator.
When you see a blue uptrend arrow, you should see either exit with a short position or place a take-profit order.
