KDJ Random Index MT4
- Indicadores
- KEENBASE SOFTWARE SOLUTIONS
- Versión: 1.0
- Activaciones: 5
Basic technical analysis tools use signals during market changes by providing critical information that can influence investment and trading decisions.
Several technical analysis tools are developed for this purpose, and one of the most popular indicators traders use the KDJ Random index.
It's known as the Random Index, is primarily a trend-following indicator that aids traders in identifying trends and prime entry points.
Features
- It analyzes and projects changes in trends and price patterns.
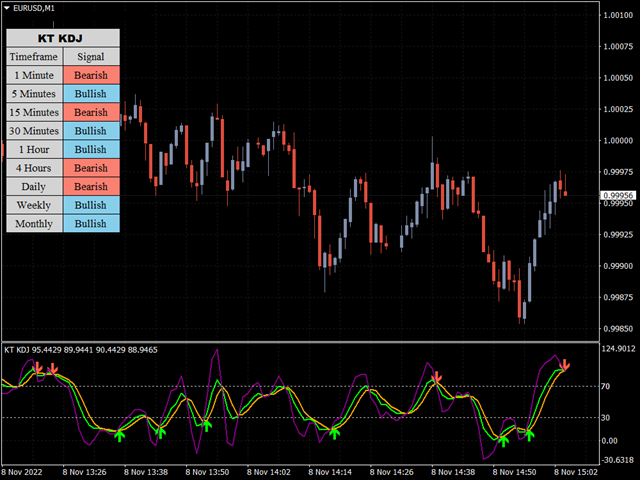
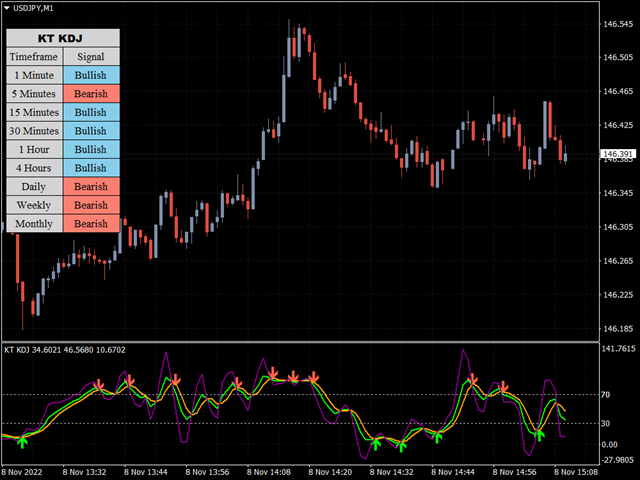
- It comes with a multi-timeframe scanner which scans for the upcoming signals in real time.
- It works across multiple instruments and time frames.
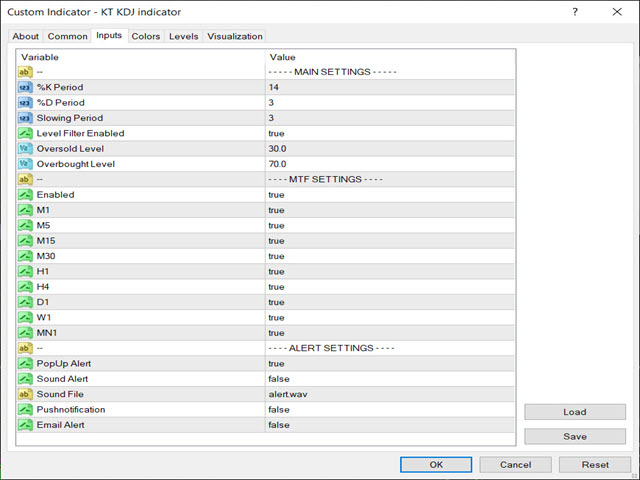
- You can adjust the K, D, and J settings to your particular needs.
Potential Applications
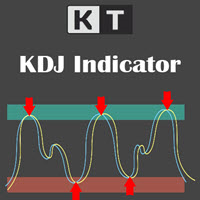
The KDJ Random index functions similarly to a regular stochastic but is still a lagging indicator. Its most common signals are based on where the %J line cross is in the range concerning the oversold and overbought zones.
The market is neutral if it is between 20 and 80, bullish/overbought if it is above 80, and bearish/oversold if it is below 20. You must be careful if it is below 0 or above 100, as it is highly bearish/oversold and extremely bullish/overbought, respectively.
