Multiple TimeFrame MACD Confluency Tool
- Indicadores
- Kelvin Souza Da Costa Oliveira
- Versión: 2.0
- Activaciones: 5
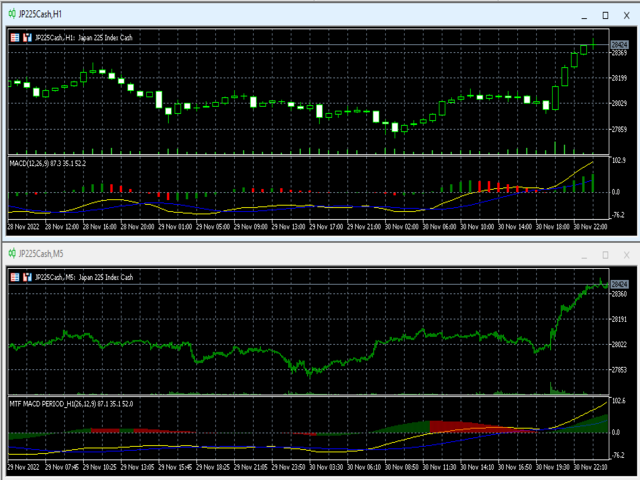
Multiple Timeframe MACD indicator.
This indicator was built for making multiple timeframe analysis possible in MT5 using MACD Indicator.
MACD Indicator traditionally shows two lines and one histogram.
MACD Line(Yellow) is calculated by subtracting 12period EMA(fast) from 26period EMA (slow).
Signal Line(Blue) is created by a 9period EMA from MACD Line.
Histogram is just the difference between MACD and Signal lines. Histogram is colored based on the difference between its value and the previous histogram. If the difference is positive, histogram turns green indicating an uptrend, otherwise, if difference is negative, histogram turns red, indicating downtrend.
There are various ways of performing multiple timeframes analysis, one simple and consistent way of using this indicator is just making together MACD value from two higher timeframes and use it as a filter for selecting best oportunity for a successfull trade based on confluency of MACD at both timeframes.
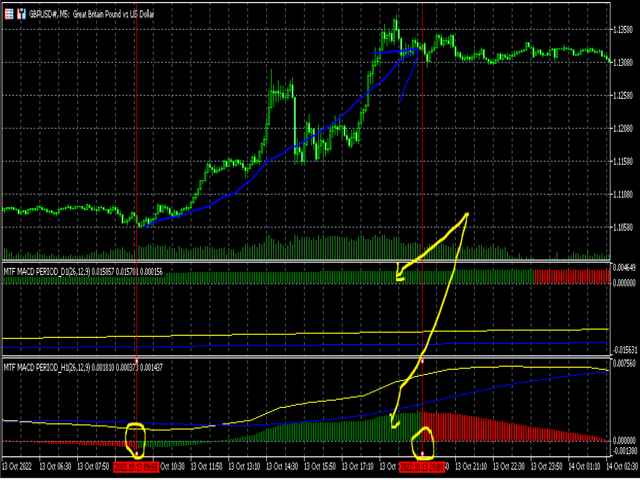
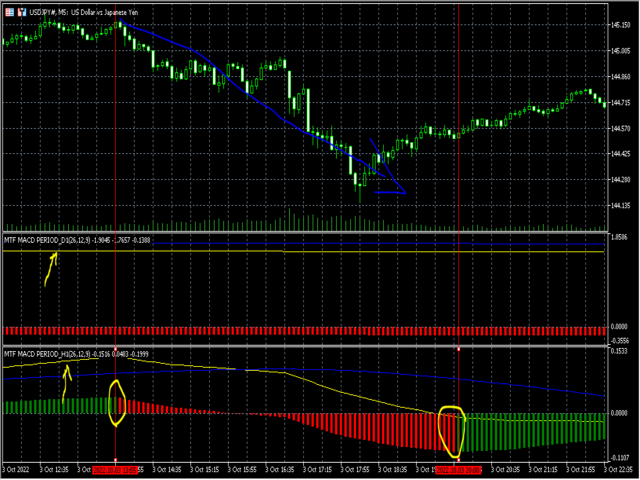
One example based on confluency of histogram colors:
Buy: Search for Buy Opportunities(at M5) when both MACD Histogram (H1 and D1 timeframes) is colored green.
Sell: Search for Sell Opportunities(at M5) when both MACD Histogram (H1 and D1 timeframes) is colored red.
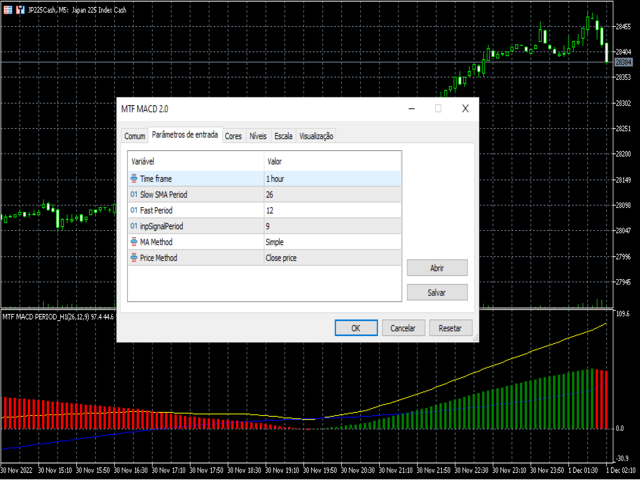
All MACD Parameters can be adjustable following user prefferences such as Fast EMA, Slowing EMA and Signal periods, Moving Average Method and Price Application Method.
You can choose only timeframes higher than chart timeframe.

