Thunder Scalper
- Indicadores
- Mr Fares Mohammad Alabdali
- Versión: 1.0
- Activaciones: 5
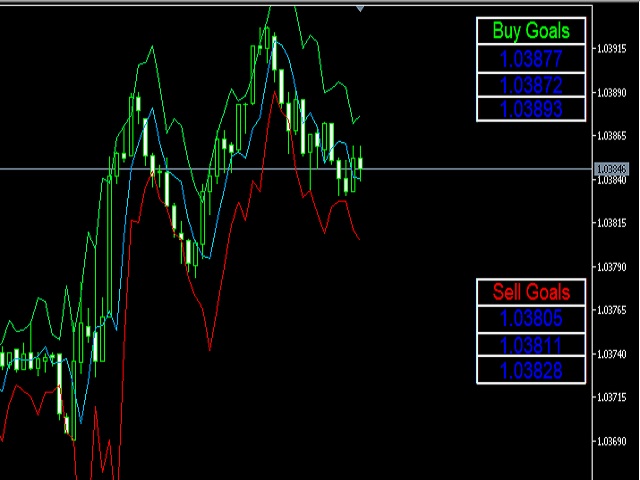
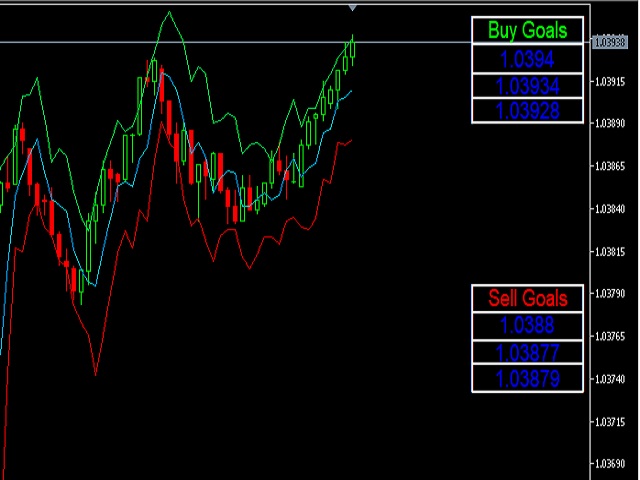
Indicador de objetivos de compra y venta
Consta de tres líneas: el primer color verde identifica los objetivos de compra, el segundo color rojo identifica los objetivos de venta y el tercer color azul es el precio promedio.
Hay dos formas de entrar:
Método 1: punto de entrada cuando el precio promedio se rompe con una vela larga desde abajo y mantenerse por encima de la línea azul con una vela verde se considera compra
Cuando el precio promedio atraviesa el techo con una vela roja, se considera una venta.
El segundo método: logrando metas, por ejemplo, al lograr metas escritas en la pantalla digital, si es una venta
El final de la venta se considera el comienzo del comienzo del logro de los objetivos de la comprsa
——-