• Información general
  • Comentarios
  • Discusión (8)

The 123 Pattern Strategy With Fibonacci

5

Get FREE Advanced Online Course and Learn About Our Advanced Trading System, Link in the Bio! Click Here. 

Our Mission and Vision:  

Why Am I Even Here?   

Here is The Deal Brother, We Offer:Premium Quality Indicators: The Highest Quality Possible Algorithms.

  • Unlimited Activations: Can be used on Unlimited number of Computers, MT4s and MT5s for lifetime.

  • Inexpensive Prices: 30$ is the lowest price possible, Knowing that more than 50% of our Indicators are 100% FREE.


But Why Am I telling You this?

I am Telling You this, Because of 3 Reasons:

  • I would like to be honest with you: A rare quality nowadays..

  • I care, and I don't want to break your bank: We know how struggling new and even experienced traders feel. Whether you
    have money or not you will get premium and inexpensive even free indicators for life.

  • I Personally have been there and I wished somebody cared.


How Can We Help You?

Our Mission and our Goal is to turn you into a Pro Trader, In the shortest period of time possible, and we can do that by offering you:

  • Professional Knowledge: Today in our Pro Trading Academy, You can Enroll, Get Certified and Start a successful Career as a Pro Trader.

  • Professional Tools: Premium tools and Indicators that Pro Traders use on a daily basis, with inexpensive prices.


About This Indicator:

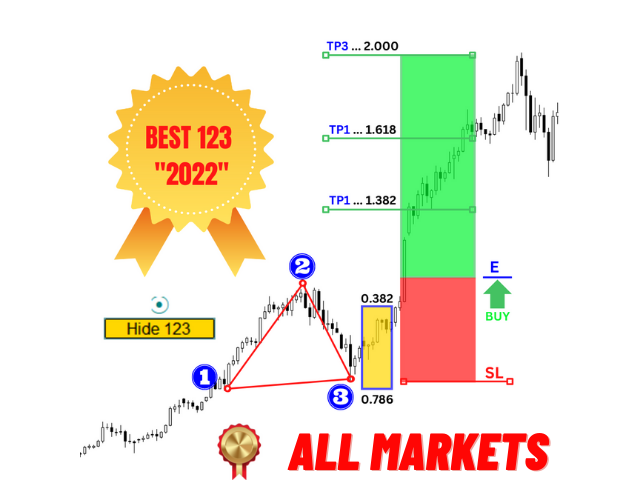
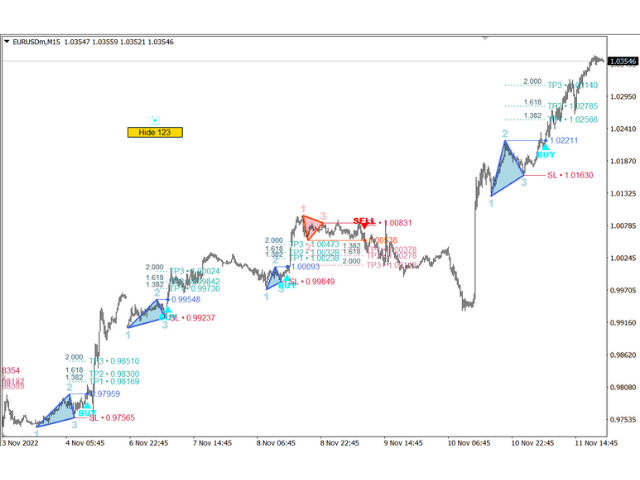
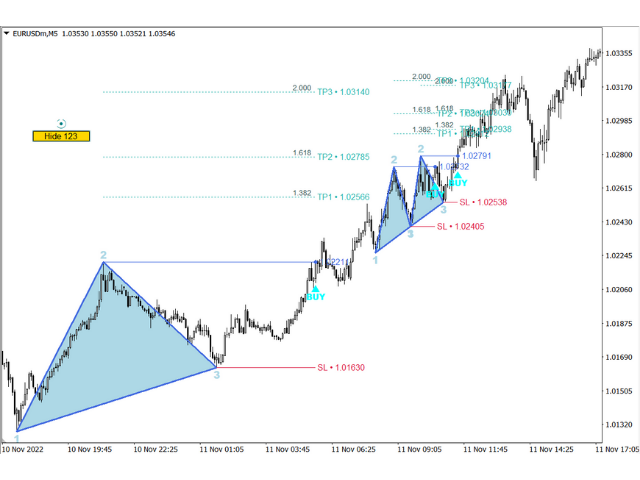
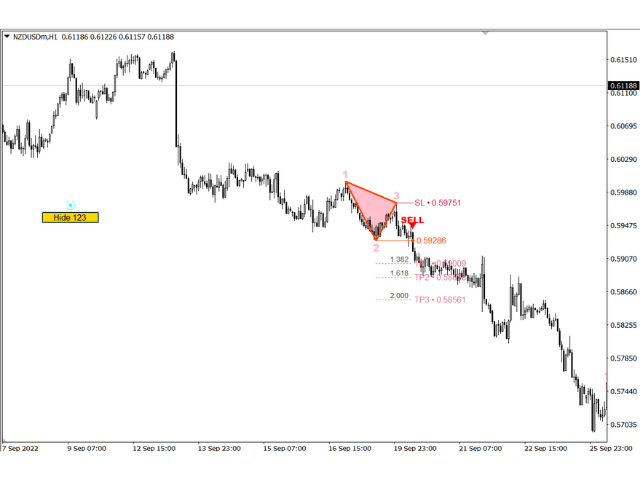
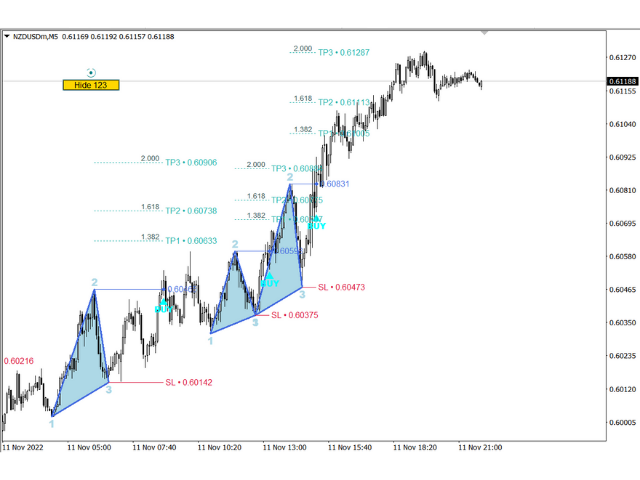
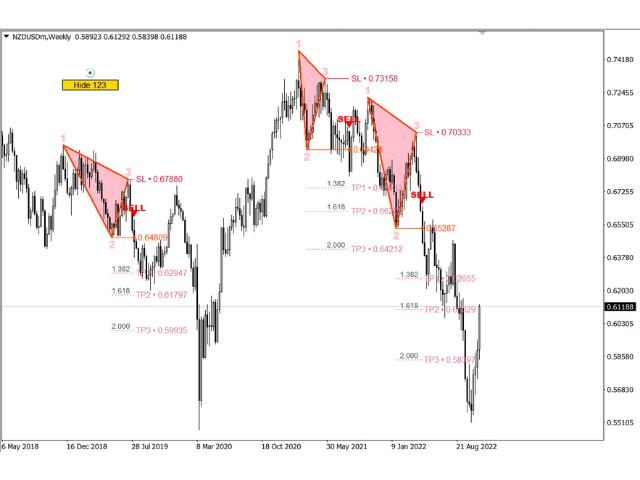
"The 123 or ABC Pattern Strategy With Fibonacci" Indicator is a cutting-edge technical analysis tool meticulously designed to recognize and leverage the power of the 123 or ABC chart patterns in combination with Fibonacci levels. This strategy let traders make well-informed decisions and gain a competitive edge in the dynamic forex market.

Spotting the 123 and ABC Patterns: Learn how to identify the 123 and ABC patterns on price charts. These patterns are composed of three distinct price swings, providing valuable insights into potential trend reversals or continuations.

Harnessing the Potential of Fibonacci: Discover the significance of Fibonacci retracement and extension levels. The indicator seamlessly incorporates these levels, assisting traders in pinpointing enhanced potential entry and exit points.

Entry and Exit Points: Master the art of using the 123 or ABC pattern in conjunction with Fibonacci levels to determine optimal entry and exit positions for your trades.

Confirmation with Multiple Timeframes: Explore the benefits of validating 123 or ABC patterns and Fibonacci levels across multiple timeframes. This comprehensive approach enhances the reliability of your signals.

Risk Management Strategies: Learn how to manage trading risks effectively. Implementing proper risk management techniques is crucial to safeguarding your trading capital.

Integrating Other Technical Indicators: Understand how to combine "The 123 or ABC Pattern Strategy With Fibonacci" Indicator with other technical indicators to create a well-rounded trading strategy.

Backtesting and Optimization: Utilize historical data to backtest the indicator and fine-tune your trading approach for optimal performance.

Real-time Alerts and Notifications: Stay ahead of the game with real-time alerts and notifications. Never miss a potential trading opportunity again.

User-Friendly Interface: The indicator boasts a user-friendly interface, making it suitable for traders of all experience levels.

Compatibility with Leading Trading Platforms: Enjoy the flexibility of using "The 123 or ABC Pattern Strategy With Fibonacci" Indicator on popular trading platforms such as MetaTrader 4 and MetaTrader 5.

Continuous Support and Updates: Benefit from ongoing support and updates to ensure the indicator remains up-to-date and effective.


Remember, while "The 123 or ABC Pattern Strategy With Fibonacci" Indicator provides valuable insights, trading requires a realistic approach. Combine technical analysis, risk management, and market knowledge to make prudent trading decisions. (Disclaimer: Forex trading involves risk, and past performance is not indicative of future results. Always trade responsibly and seek professional advice when needed.)


Frequently Asked Questions:

Q: What is 123 or ABC Pattern Strategy?

A: 123 or ABC pattern Strategy is a Pure Price Action Strategy that does not use any technical indicators, It’s a simple Pattern But Yet very Powerful, Used by a lot of Pro Traders All around the world.

The Concept behind the 123 or ABC pattern falls under two scenarios:

1-      Continuation 123 or ABC Pattern:

-          The Price should be in a Trend "Up or Down".

-          The Price Pulls back.

-          Traders then Look for reasons to enter at the Pull back to catch the trend.

2-      Reversal 123 or ABC Pattern:

-          The Price should be Oversold Or Overbought.

-          The Price Fails To create New High Or New Low.

-          At the Level of Failure the Traders look for reasons to enter.

The power of the 123 or ABC Pattern strategy is that its very Simple and easy to understand, evolves only Price action, No technical Indicators.


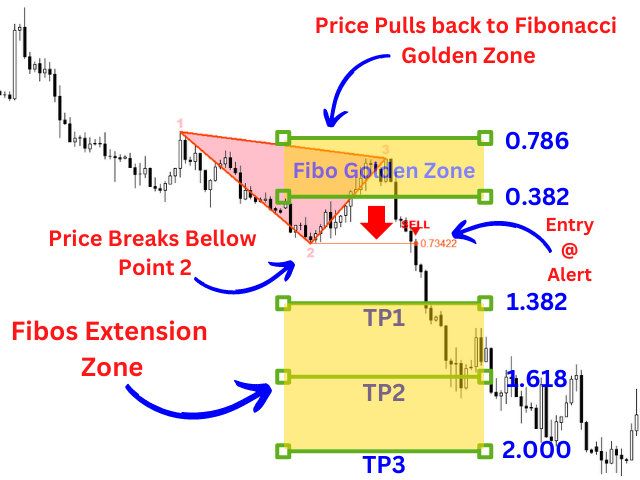
Q: What's Fibonacci Golden Zone?

A: It’s a well-known Strategy among Professional Price action traders, the Concept of this strategy is the following:

The trader will draw Fibonacci levels and mark the levels between 0.382 and 0.786 as the Golden Zone.

Any Pullback to this Zone is Considered very important, because the Golden Zone is considered as a Zone (Area) of value where the price has higher chances to Reverse.


Q: How much does it cost:

A: Current Price $30 Minimum, But Possible Future Price $199!


Q: Do you Sell outside of the Mql5 community?

A: Absolutely not, Its is against the rules of mql5 community and anybody who sells using our brand name is a scam and should be avoid at any cost.


Q: Can I use it on all timeframes and all markets?

A: YES, It Can be used on All Markets and All Timeframes.


Q: Can I use this custom indicator on multiple charts?

A: Yes, you can use the custom indicator on multiple charts. Simply add it to each chart from the Navigator window.


Q: Can I use this custom indicator on multiple trading accounts?

A: Yes, You can use it on unlimited trading accounts (with our unlimited activations).


Q: How do I install this custom indicator I purchased?

A: To install the custom indicator you purchased, follow these steps:

  1. If you still didn't buy the indicator by clicking the buy button above.
  2. Refresh the page and you will see Install button.
  3. Click install the web page will ask your to open MetaTrader, Click Confirm. 
  4. Open MetaTrader and go to "Navigator" -> "Indicators" -> "Market", you will see your newly bought indicator listed.
  5. double click or click and drag to the chart.
  6. setting window will open, custom your preferred setting and confirm. 


Q: Do you have the other version of MetaTrader?

A: Yes, you can find the other version Here


Q: How to trade using this indicator?

A: Follow below steps:

1-     Install the Indicator in your chart.

2-     The Indicator will Alert you to Meta Trader and your phone when new 123 or ABC patterns are detected and show you exactly where to Enter and where to put the Stop Loss and the Take Profits.

3-     All you have to do is Take the Trades whenever you get Alerted.

The most important thing when it comes to trading is the Analysis of the chart, Imagine you can skip that part and let the Algorithm take care of that for you!

This Algorithm has embedded instruction to find the 123 or ABC patterns and refine them using the Fibonacci levels, to get the best results out of your trading.

So why not Add this strategy to your trading Arsenal!

Removing the human error by using a complex algorithm formula will help not only save the traders time but increase accuracy of entries and  exists signals.

More tips:

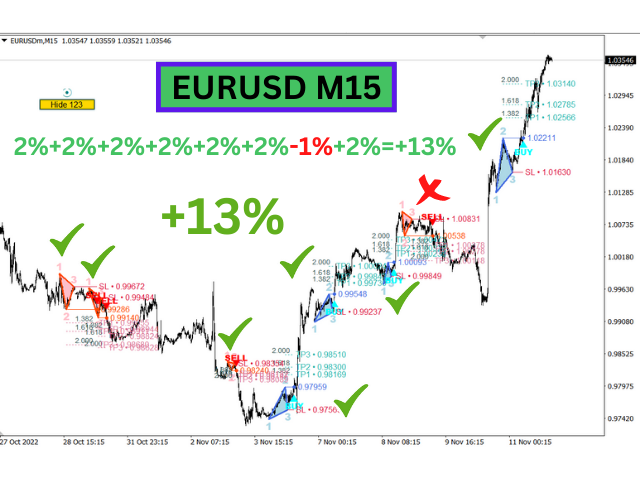
1. Use On 15 Minutes Timeframe.

2. Use Active Trading Technics Like Moving SL to BE when Profit Reaches TP2.

3. This is a manual Trading strategy so you still need to filter the good signals from the bad.

4. Sometime the signal comes late I call it late Signal and I just Skip It! (After all we have to respect the original Strategy, signal at the close of the Candle).


Q: What's the formula used?

A: The indicator has a Smart algorithm that scans and retrieve valid and important info.


Q: Does if show SL and TP? and What is the red and green boxes?

A: No, The green and red boxes are used for demonstration only.


Q: Can this Indicator Alert me on Email and Phone when price near a level ?

A: Yes, you will be able to enable alerts in the setting panel.


Q: How to integrate this Indicator in my trading?

A: There are a lot of strategies that uses this Indicator including most of price action traders and day traders use it, Removing the human error by using a complex algorithm formula will help not only save the traders time but increase probabilities of your entries and  exists signals.


Q: Does it have the Hide and Show Button/Hot key?

A: Yes, Hide button is new technic that allow for cleaner chart setup.


Q: Can this indicator be used with an Expert Adviser?

A: Yes, This indicator does return buffers that can be used as buy and sell signals buy Expert Advisers.


    Q: How do I customize the settings of the custom indicator?

    A: To customize the settings of the custom indicator, double-click on it in the Navigator window or drag it onto the chart. A settings window will appear, allowing you to adjust the parameters as per your preference.


    Q: Does the custom indicator repaint or redraw its signals?

    A: The repainting behavior of custom indicators depends on their specific logic and design. Please refer to the indicator's documentation or ask the seller for clarification.


    Q: Can I get support or assistance with using the custom indicator?

    A: Yes, if you have any questions or need assistance with using the custom indicator, you can contact the seller or developer through the MQL5 website or the provided contact information.


    Q: How can I backtest the custom indicator's performance?

    A: To backtest the custom indicator, open the Strategy Tester in MetaTrader 5, select the indicator, choose the desired settings, and run the test on historical data.


    Q: What are the settings of this indicator?

    A: This indicator offers full control over everything:

    1. Control the Modes.
    2. Control the appearance of the indicator.
    3. Control number of bars to analyze.
    4. Control Alerts.
    5. Control thickness of elements.
    6. Control the colors of elements.
    7. Show hide of all elements using button or Hotkey.
    8. Change position of the button.


    Reviews:

    Your Feedback Matters!

    We hope you're enjoying our products! 

    We invite you to share your valuable reviews and feedback on our products. Your input is incredibly valuable in helping us enhance our offerings and cater to your needs even better. 

    By leaving a review, you not only support our work but also contribute to making our products even more effective for you! 

    Your satisfaction is our top priority, and your feedback will directly impact the future improvements we make. So, take a moment to share your thoughts and help us serve you better! 

    Thank you for being a part of our journey!

    Dubai Forex Group

    Productos recomendados
    VR Cub
    Vladimir Pastushak
    VR Cub es un indicador para obtener puntos de entrada de alta calidad. El indicador fue desarrollado para facilitar los cálculos matemáticos y simplificar la búsqueda de puntos de entrada a una posición. La estrategia comercial para la cual se diseñó el indicador ha demostrado su eficacia durante muchos años. La simplicidad de la estrategia comercial es su gran ventaja, que permite que incluso los operadores novatos negocien con éxito con ella. VR Cub calcula los puntos de apertura de posiciones
    Master Scalping M1 es un indicador innovador que utiliza un algoritmo para determinar la tendencia de forma rápida y precisa. El indicador calcula el tiempo de apertura y cierre de posiciones, los algoritmos del indicador le permiten encontrar los momentos ideales para ingresar a una operación (comprar o vender un activo), lo que aumenta el éxito de las transacciones para la mayoría de los comerciantes. Beneficios del indicador: Fácil de usar, no sobrecarga el gráfico con información innecesari
    Forex Gump
    Andrey Kozak
    2.4 (5)
    Forex Gump is a fully finished semi-automatic trading system. In the form of arrows, signals are displayed on the screen for opening and closing deals. All you need is to follow the instructions of the indicator. When the indicator shows a blue arrow, you need to open a buy order. When the indicator shows a red arrow, you need to open a sell order. Close orders when the indicator draws a yellow cross. In order to get the most effective result, we recommend using the timeframes H1, H4, D1. There
    Daily Candle Predictor es un indicador que predice el precio de cierre de una vela. El indicador está destinado principalmente para su uso en gráficos D1. Este indicador es adecuado tanto para el comercio de divisas tradicional como para el comercio de opciones binarias. El indicador se puede utilizar como un sistema de negociación independiente o puede actuar como una adición a su sistema de negociación existente. Este indicador analiza la vela actual, calculando ciertos factores de fuerza dent
    Noize Absorption Index MT4
    Ekaterina Saltykova
    5 (1)
    Noize Absorption Index - is the manual trading system that measures the difference of pressure between bears forces and bulls forces. Green line - is a noize free index that showing curent situation. Zero value of index shows totally choppy/flat market.Values above zero level shows how powerfull bullish wave is and values below zero measures bearish forces.Up arrow appears on bearish market when it's ready to reverse, dn arrow appears on weak bullish market, as a result of reverse expectation. S
    Stratos Pali
    Michela Russo
    5 (2)
    Stratos Pali Indicator   is a revolutionary tool designed to enhance your trading strategy by accurately identifying market trends. This sophisticated indicator uses a unique algorithm to generate a complete histogram, which records when the trend is Long or Short. When a trend reversal occurs, an arrow appears, indicating the new direction of the trend. Important Information Revealed Leave a review and contact me via mql5 message to receive My Top 5 set files for Stratos Pali at no cost! Dow
    Super Reversal Pattern
    Parfait Mujinga Ndalika
    Super Reversal Pattern Indicator Unlock the power of advanced pattern recognition with our Super Reversal Pattern Indicator. Designed for traders seeking precision and reliability, this indicator identifies one of the most effective reversal patterns in technical analysis, offering a significant edge in your trading strategy. Key Features: Non-Repainting Accuracy: Enjoy the confidence of non-repainting technology. Once a Super Reversal Pattern is detected, it remains static, providing consiste
    Le presentamos el indicador "Candle closing counter", que se convertirá en su asistente indispensable en el mundo del trading. Es por eso que saber cuándo se cerrará la vela puede ayudar: Si usted tiene gusto de negociar usando patrones de la vela, usted sabrá cuando la vela será cerrada. Este indicador le permitirá comprobar si se ha formado un patrón conocido y si hay una posibilidad de negociación. El indicador le ayudará a prepararse para la apertura del mercado y el cierre del mercado. P
    Retroceso de Fibonacci & Herramientas de Dibujo de Líneas Extendidas Retroceso de Fibonacci & Herramientas de Dibujo de Líneas Extendidas son aptos para la plataforma MT4 y para operadores que emplean el método de negociación de puntos y la negociación de sección áurea. Ventajas: Sin líneas excusadas ni las excesivamente largas, y es fácil de observar y descubrir oportunidades de negociación. Versión de prueba: https://www.mql5.com/zh/market/product/35884 Funciones principales: 1. Se puede
    Owl smart levels
    Sergey Ermolov
    4.24 (37)
    Versión MT5  |   FAQ El   Indicador Owl Smart Levels   es un sistema comercial completo dentro de un indicador que incluye herramientas de análisis de mercado tan populares como   los fractales avanzados de Bill Williams , Valable ZigZag que construye   la estructura de onda correcta   del mercado y   los niveles de Fibonacci   que marcan los niveles exactos de entrada. en el mercado y lugares para tomar ganancias. Descripción detallada de la estrategia Instrucciones para trabajar con el indi
    Trend Oscillator es un indicador avanzado personalizado de Crypto_Forex, ¡una herramienta de trading eficiente! - Se utiliza un nuevo método de cálculo avanzado: 20 opciones para el parámetro "Precio para el cálculo". - El oscilador más suave jamás desarrollado. - Color verde para tendencias alcistas, color rojo para tendencias bajistas. - Valores de sobreventa: por debajo de 5, valores de sobrecompra: por encima de 95. - Hay muchas oportunidades para mejorar incluso las estrategias estándar c
    Infinity Trend Pro
    Yaroslav Varankin
    1 (1)
    This is a trend indicator without redrawing Developed instead of the binary options strategy (by the color of the Martingale candlestick) Also works well in forex trading When to open trades (binary options) A signal will appear in the place with a candle signaling the current candle It is recommended to open a deal for one candle of the current timeframe M1 and M5 When a blue dot appears, open a deal up When a red dot appears, open a trade down. How to open trades on Forex. When a signal is rec
    EZZ Elite Zig Zag is an indicator for the MetaTrader 4 terminal. This indicator traces the peak of the trend based on the market reversal, thus showing various opportunities in the financial market. EZZ Elite Zig Zag is a visual tool, intuitive, and easy to understand and use.  Test it Yourself by Downloading it for Free. Author Paulo Rocha all rights reserved
    Indicador Crypto_Forex "Patrón de los 3 cuervos negros" para MT4. - El indicador "Patrón de los 3 cuervos negros" es muy potente para operar con Price Action: no se vuelve a pintar ni se demora. - El indicador detecta patrones bajistas "3 cuervos negros" en el gráfico: señal de flecha roja en el gráfico (ver imágenes). - Con alertas para PC, dispositivos móviles y correo electrónico. - También está disponible su hermano, el indicador alcista "Patrón de los 3 soldados blancos" (siga el enlace a
    TWO PAIRS SQUARE HEDGE METER INDICATOR Try this brilliant 2 pairs square indicator It draws a square wave of the relation between your two inputs symbols when square wave indicates -1 then it is very great opportunity to SELL pair1 and BUY Pair2 when square wave indicates +1 then it is very great opportunity to BUY pair1 and SELL Pair2 the inputs are : 2 pairs of symbols         then index value : i use 20 for M30 charts ( you can try other values : 40/50 for M15 , : 30 for M30 , : 10 for H1 ,
    Binary Options Assistant (BOA) Multi Currency Dashboard for Binary Options (MT4) . You can use any of the BOA Signals Indicators with the dashboard. Just change the BOA Signals Indicator Name in the dashboard settings to the indicator you want to get signals from. For example: CHILL. BOA_BURN_Indicator_v1   Strategy :   Ana Trader Binary Options Strategy (MACD & Stochastic) BOA_COLD_Indicator_v1   Strategy :  Amalia Trader Binary Options Strategy (Keltner & Stochastic) BOA_CHILL_Indicator_v1  
    Cosmic Diviner X Planet
    Olena Kondratenko
    4 (2)
    This unique multi-currency strategy simultaneously determines the strength of trends and market entry points, visualizing this using histograms on the chart. The indicator is optimally adapted for trading on the timeframes М5, М15, М30, Н1. For the convenience of users, the indicator renders the entry point (in the form of an arrow), recommended take profit levels (TP1, TP2 with text labels) and the recommended Stop Loss level. The take profit levels (TP1, TP2) are automatically calculated for
    Indicador Crypto_Forex "Estrella de la Mañana" para MT4. - El indicador "Estrella de la Mañana" es muy potente para operar con Price Action: Sin repintado ni retraso. - Detecta patrones alcistas de Estrella de la Mañana en el gráfico: Señal de flecha azul en el gráfico (ver imágenes). - Con alertas para PC, móvil y correo electrónico. - También está disponible su hermano bajista, el indicador "Estrella de la Tarde" (siga el enlace a continuación). - El indicador "Estrella de la Mañana" es exce
    El indicador construye cotizaciones actuales, que se pueden comparar con las históricas y, sobre esta base, hacer un pronóstico de movimiento de precios. El indicador tiene un campo de texto para una navegación rápida a la fecha deseada. Opciones: Símbolo - selección del símbolo que mostrará el indicador; SymbolPeriod - selección del período del cual el indicador tomará datos; IndicatorColor - color del indicador; HorisontalShift: cambio de cotizaciones dibujadas por el indicador por el núm
    PipFinite Exit EDGE
    Karlo Wilson Vendiola
    4.83 (115)
    Did You Have A Profitable Trade But Suddenly Reversed? In a solid strategy, exiting a trade is equally important as entering. Exit EDGE helps maximize your current trade profit and avoid turning winning trades to losers. Never Miss An Exit Signal Again Monitor all pairs and timeframes in just 1 chart www.mql5.com/en/blogs/post/726558 How To Trade You can close your open trades as soon as you receive a signal Close your Buy orders if you receive an Exit Buy Signal. Close your Sell orders if
    Trendiness Index
    Libertas LLC
    5 (3)
    "The trend is your friend" is one of the best known sayings in investing, because capturing large trendy price movements can be extremely profitable. However, trading with the trend is often easier said than done, because many indicators are based on price reversals not trends. These aren't very effective at identifying trendy periods, or predicting whether trends will continue. We developed the Trendiness Index to help address this problem by indicating the strength and direction of price trend
    El indicador "Auto FIBO Pro" de Crypto_Forex es una gran herramienta auxiliar para operar. - El indicador calcula y coloca automáticamente en el gráfico los niveles de Fibonacci y las líneas de tendencia locales (color rojo). - Los niveles de Fibonacci indican áreas clave donde el precio puede revertirse. - Los niveles más importantes son 23,6 %, 38,2 %, 50 % y 61,8 %. - Puede usarlo para scalping de reversión o para operar en cuadrículas de zonas. - También existen muchas oportunidades para m
    ROYAL DUTCH SKUNK USES THE TREND WAVE INDICATOR AND IT CAN IDENTIFY THE BEGINNING AND THE END OF A NEW WAVE TREND MOVEMENT. AS AN OSCILLATOR, THE INDICATOR IDENTIFIES THE OVERBOUGHT AND OVERSOLD ZONES. IT WORKS GREAT TO CATCH THE SHORT TERM PRICE REVERSALS AND USES A MARTINGALE STRATEGY TO CLOSE ALL TRADES IN PROFIT. USE DEFAULT SETTINGS ON H1 OR HIGHER TIME FRAME ON ANY PAIR FOR MORE ACCURATE TRADES WHY THIS EA : Smart entries calculated by 6 great strategies The EA can be run on even a $20000
    The indicator displays the data of the Stochastic oscillator from a higher timeframe on the chart. The main and signal lines are displayed in a separate window. The stepped response is not smoothed. The indicator is useful for practicing "manual" forex trading strategies, which use the data from several screens with different timeframes of a single symbol. The indicator uses the settings that are identical to the standard ones, and a drop-down list for selecting the timeframe. Indicator Paramet
    Quantum Heiken Ashi PRO MT4
    Bogdan Ion Puscasu
    4.33 (6)
    Introduciendo el       Gráficos   Quantum Heiken Ashi PRO Diseñadas para brindar información clara sobre las tendencias del mercado, las velas Heiken Ashi son reconocidas por su capacidad para filtrar el ruido y eliminar las señales falsas. Diga adiós a las confusas fluctuaciones de precios y dé la bienvenida a una representación gráfica más fluida y confiable. Lo que hace que Quantum Heiken Ashi PRO sea realmente único es su fórmula innovadora, que transforma los datos de velas tradicionales en
    The Th3Eng PipFinite indicator is based on a very excellent analysis of the right trend direction with perfect custom algorithms. It show the true direction and the best point to start trading. With StopLoss point and Three Take Profit points. Also it show the right pivot of the price and small points to order to replace the dynamic support and resistance channel, Which surrounds the price. And Finally it draws a very helpful Box on the left side on the chart includes (take profits and Stop loss
    Scalping Modulator is a scalping trading system. The indicator consists of several analytical modules. It automatically analyzes the market and shows the trader all the necessary information for trading. Scalping Modulator draws two trend lines on the chart. One line shows the long-term direction of the price, the second line shows the medium-term direction of the price. The indicator also draws red and blue dots on the chart. They indicate a likely change in price movement. In order to open a
    Trend Deviation
    VLADISLAV AKINDINOV
    Trend indicator with calculation of dynamic levels and signaling their intersection. Description of input parameters: StepTF = true; - Calculation of the indicator by closing the bar (true) or by each tick (false) BarsCount = 300; - Number of settlement bars Price = PRICE_CLOSE; - Type of price used TimeFrame = PERIOD_CURRENT; - Estimated timeframe TrendPeriod = 9; - Trend calculation period TrendDeviations = 4.9; - coefficient of deviation PeriodTrendSmooth = 1; - Trend smoothing perio
    HMA Trend Professional MT4
    Pavel Zamoshnikov
    4.57 (7)
    Improved version of the free HMA Trend indicator (for MetaTrader 4) with statistical analysis. HMA Trend is a trend indicator based on the Hull Moving Average (HMA) with two periods. HMA with a slow period identifies the trend, while HMA with a fast period determines the short-term movements and signals in the trend direction. The main differences from the free version: Ability to predict the probability of a trend reversal using analysis of history data. Plotting statistical charts for analyzi
    Los indicadores [ZhiBiCCI] son ​​adecuados para todos los ciclos de uso y también son adecuados para todas las variedades de mercado. [ZhiBiCCI] La línea verde sólida es una reversión de la divergencia alcista. La línea de puntos verde es una divergencia alcista clásica. [ZhiBiCCI] La línea continua hacia el rojo es una divergencia bajista inversa. La línea roja punteada es una divergencia bajista clásica. [ZhiBiCCI] puede configurarse en los parámetros (Alerta, Enviar correo, Enviar notifica
    Los compradores de este producto también adquieren
    Gann Made Easy
    Oleg Rodin
    4.8 (116)
    Gann Made Easy es un sistema de comercio de Forex profesional y fácil de usar que se basa en los mejores principios de comercio utilizando la teoría del Sr. W. D. Gann. El indicador proporciona señales precisas de COMPRA y VENTA, incluidos los niveles de Stop Loss y Take Profit. Puede comerciar incluso sobre la marcha utilizando notificaciones PUSH. ¡Por favor, póngase en contacto conmigo después de la compra! ¡Compartiré mis consejos comerciales con usted y excelentes indicadores de bonificació
    Gold Stuff
    Vasiliy Strukov
    4.86 (255)
    Gold Stuff: un indicador de tendencia diseñado específicamente para el oro, también se puede usar en cualquier instrumento financiero. El indicador no se vuelve a dibujar ni se retrasa. El marco de tiempo recomendado es H1. Este indicador está escrito por EA Gold Stuff Advisor, puede encontrarlo en mi perfil.  Puede obtener una copia gratuita de nuestro indicador Strong Support y Trend Scanner, por favor envíe un mensaje privado. ¡a mí! IMPORTANTE! Póngase en contacto conmigo inmediatamente de
    ¡Actualmente 20% OFF ! ¡La mejor solución para cualquier novato o trader experto! Este software funciona con 28 pares de divisas. Se basa en 2 de nuestros principales indicadores (Advanced Currency Strength 28 y Advanced Currency Impulse). Proporciona una gran visión general de todo el mercado de divisas. Muestra los valores de Advanced Currency Strength, la velocidad de movimiento de las divisas y las señales para 28 pares de divisas en todos los (9) marcos temporales. Imagine cómo mejorará
    Scalper Inside PRO
    Alexey Minkov
    4.76 (63)
    !SPECIAL SALE! An exclusive indicator that utilizes an innovative algorithm to swiftly and accurately determine the market trend. The indicator automatically calculates opening, closing, and profit levels, providing detailed trading statistics. With these features, you can choose the most appropriate trading instrument for the current market conditions. Additionally, you can easily integrate your own arrow indicators into Scalper Inside Pro to quickly evaluate their statistics and profitability
    Golden Trend Indicator
    Noha Mohamed Fathy Younes Badr
    4.9 (10)
    Golden Trend indicator  is The best indicator for predicting trend movement this indicator never lags and never repaints and never back paints    and give  arrow buy and sell    before the candle appear  and it will help you and  will make your trading decisions clearer its work on all currencies and  gold and crypto and all time frame This unique  indicator uses very secret algorithms to catch the  trends, so you can trade using this indicator and see the trend clear on charts  manual guide and
    M1 Arrow
    Oleg Rodin
    5 (17)
    Una estrategia intradía basada en dos principios fundamentales del mercado. El algoritmo se basa en el análisis de volúmenes y ondas de precios utilizando filtros adicionales. El algoritmo inteligente del indicador da una señal solo cuando dos factores de mercado se combinan en uno. El indicador calcula ondas de cierto rango en el gráfico M1 utilizando los datos del marco de tiempo más alto. Y para confirmar la onda, el indicador utiliza el análisis por volumen. Este indicador es un sistema come
    Easy Breakout
    Mohamed Hassan
    5 (10)
    After your purchase, feel free to contact me for more details on how to receive a bonus indicator called VFI, which pairs perfectly with Easy Breakout for enhanced confluence!   Easy Breakout is a powerful price action trading system built on one of the most popular and widely trusted strategies among traders: the Breakout strategy ! This indicator delivers crystal-clear Buy and Sell signals based on breakouts from key support and resistance zones. Unlike typical breakout indicators, it levera
    Scalper Vault
    Oleg Rodin
    5 (29)
    Scalper Vault es un sistema profesional de reventa que le brinda todo lo que necesita para una reventa exitosa. Este indicador es un sistema comercial completo que puede ser utilizado por operadores de divisas y opciones binarias. El marco de tiempo recomendado es M5. El sistema le proporciona señales de flecha precisas en la dirección de la tendencia. También le proporciona señales superiores e inferiores y niveles de mercado de Gann. Los indicadores proporcionan todo tipo de alertas, incluidas
    Enigmera
    Ivan Stefanov
    5 (7)
    ENIGMERA: El núcleo del mercado Importante: La demostración de MQL5.com se ejecuta en el Strategy Tester y puede no reflejar completamente la funcionalidad de Enigmera. Consulta la descripción, las capturas de pantalla y el video para más detalles. ¡No dudes en contactarme si tienes alguna pregunta! El código del indicador ha sido completamente reescrito. La versión 3.0 añade nuevas funcionalidades y elimina errores acumulados desde el inicio del indicador. Introducción Este indicador y sistem
    Linear Trend Predictor : un indicador de tendencia que combina puntos de entrada y líneas de soporte de dirección. Funciona según el principio de romper el canal de precios altos/bajos. El algoritmo del indicador filtra el ruido del mercado, tiene en cuenta la volatilidad y la dinámica del mercado. Capacidades del indicador  Utilizando métodos de suavizado, muestra la tendencia del mercado y los puntos de entrada para abrir órdenes de COMPRA o VENTA.  Adecuado para determinar los movimientos
    GOLD Impulse with Alert
    Bernhard Schweigert
    4.6 (10)
    Este indicador es una super combinación de nuestros 2 productos Advanced Currency IMPULSE with ALERT  +   Currency Strength Exotics . ¡Funciona para todos los marcos de tiempo y muestra gráficamente el impulso de fuerza o debilidad para las 8 divisas principales más un Símbolo! Este Indicador está especializado en mostrar la aceleración de la fuerza de la divisa para cualquier símbolo como Oro, Pares Exóticos, Materias Primas, Índices o Futuros. Es el primero de su clase, cualquier símbolo p
    Dynamic Forex28 Navigator
    Bernhard Schweigert
    5 (5)
    Dynamic Forex28 Navigator: la herramienta de trading de Forex de última generación. ACTUALMENTE CON UN 49 % DE DESCUENTO. Dynamic Forex28 Navigator es la evolución de nuestros indicadores populares de larga data, que combina el poder de tres en uno: Indicador avanzado Currency Strength28 (695 reseñas) + Indicador avanzado Currency IMPULSE con ALERT (520 reseñas) + Señales combinadas CS28 (bonificación). Detalles sobre el indicador https://www.mql5.com/en/blogs/post/758844 ¿Qué ofrece el indi
    Algo Pumping MT4
    Ihor Otkydach
    5 (4)
    PUMPING STATION – Tu estrategia personal "todo incluido" Te presentamos PUMPING STATION, un indicador revolucionario para Forex que transformará tu forma de operar en una experiencia emocionante y eficaz. No es solo un asistente, sino un sistema de trading completo con potentes algoritmos que te ayudarán a operar de forma más estable. Al comprar este producto, recibes GRATIS: Archivos de configuración exclusivos: para una configuración automática y un rendimiento óptimo. Manual en video paso a p
    Trend Screener
    STE S.S.COMPANY
    4.78 (93)
    Indicador de tendencia, solución única e innovadora para el comercio y filtrado de tendencias con todas las funciones de tendencias importantes integradas en una sola herramienta. Es un indicador 100% sin repintar de marcos temporales y monedas múltiples que se puede usar en todos los símbolos/instrumentos: divisas, materias primas, criptomonedas, índices y acciones. OFERTA POR TIEMPO LIMITADO: El indicador de detección de soporte y resistencia está disponible por solo 50$ y de por vida. (Precio
    - Real price is 80$ - 40% Discount (It is 49$ now) - Lifetime update free Contact me for instruction, add group and any questions! Related Products:  Bitcoin Expert , Gold Expert - Non-repaint - I just sell my products in Elif Kaya profile, any other websites are stolen old versions, So no any new updates or support. Introduction The breakout and retest strategy is traded support and resistance levels. it involves price breaking through a previous level.  The break and retest strategy is design
    FX Power MT4 NG
    Daniel Stein
    4.94 (18)
    FX Power: Analiza la Fuerza de las Divisas para Decisiones de Trading Más Inteligentes Descripción General FX Power es tu herramienta esencial para comprender la fuerza real de las principales divisas y el oro en cualquier condición de mercado. Al identificar divisas fuertes para comprar y débiles para vender, FX Power simplifica las decisiones de trading y descubre oportunidades de alta probabilidad. Ya sea que quieras seguir las tendencias o anticipar reversiones utilizando valores extremos
    FX Volume
    Daniel Stein
    4.6 (35)
    FX Volume: Experimente el Verdadero Sentimiento del Mercado desde la Perspectiva de un Bróker Resumen Rápido ¿Desea llevar su estrategia de trading a otro nivel? FX Volume ofrece información en tiempo real sobre cómo los traders minoristas y los brókers están posicionados, mucho antes de que aparezcan informes retrasados como el COT. Ya sea que busque beneficios consistentes o simplemente quiera una ventaja más profunda en los mercados, FX Volume le ayuda a identificar desequilibrios important
    IX Power MT4
    Daniel Stein
    4.75 (8)
    IX Power: Descubre perspectivas de mercado para índices, materias primas, criptomonedas y forex Descripción general IX Power es una herramienta versátil diseñada para analizar la fortaleza de índices, materias primas, criptomonedas y símbolos de forex. Mientras que FX Power ofrece la máxima precisión para pares de divisas mediante el uso de datos de todos los pares disponibles, IX Power se centra exclusivamente en los datos del mercado del símbolo subyacente. Esto convierte a IX Power en una e
    ACTUALMENTE 26% DE DESCUENTO ¡La mejor solución para cualquier operador novato o experto! Este indicador es una herramienta única, de alta calidad y asequible porque hemos incorporado una serie de características propias y una nueva fórmula. ¡Con sólo UN gráfico puede leer la Fuerza de la Divisa para 28 pares de Divisas! Imagínese cómo mejorará su operativa porque podrá señalar el punto exacto de activación de una nueva tendencia o de una oportunidad de scalping. Manual del usuario: haga cli
    Pruebe "Chart Patterns All in One" en modo demo y obtenga un bono. Envíeme un mensaje después de probarlo en modo demo para recibir su bono. Deja un comentario después de la compra para recibir 8 indicadores de alta calidad como bono. El indicador Chart Patterns All-in-One ayuda a los traders a visualizar varios patrones de gráficos comúnmente utilizados en el análisis técnico. Este indicador apoya la identificación de posibles comportamientos del mercado, pero no garantiza rentabilidad. Se rec
    Apollo Secret Trend es un indicador de tendencia profesional que se puede utilizar para encontrar tendencias en cualquier par y período de tiempo. El indicador puede convertirse fácilmente en su principal indicador comercial que puede usar para detectar tendencias del mercado sin importar qué par o marco de tiempo prefiera operar. Al usar un parámetro especial en el indicador, puede adaptar las señales a su estilo comercial personal. El indicador proporciona todo tipo de alertas, incluidas las n
    Indicador cíclico para negociar y predecir la dirección del mercado. Muestra el comportamiento cíclico del precio en forma de oscilador. Da señales para abrir tratos al rebotar desde los límites superior e inferior del oscilador. En forma de histograma, muestra la fuerza suavizada de la tendencia. Complementará cualquier estrategia comercial, desde scalping hasta intradía. El indicador no se vuelve a dibujar. Adecuado para su uso en todos los símbolos/instrumentos. Marcos de tiempo adecuados par
    Advanced Supply Demand
    Bernhard Schweigert
    4.91 (294)
    ¡Actualmente con 33% de descuento! ¡La mejor solución para cualquier tráder principiante o experto! Este indicador es una herramienta comercial única, de alta calidad y asequible, porque incorpora una serie de características patentadas y una nueva fórmula. Con esta actualización, podrá mostrar zonas de doble marco temporal. No solo podrá mostrar un marco temporal más alto, sino también mostrar ambos, el marco temporal del gráfico MÁS el marco temporal más alto: MOSTRANDO ZONAS ANIDADAS. A todos
    Volumatic VIDyA MT4
    Duc Hoan Nguyen
    5 (3)
    Special offer : ALL TOOLS , just $35 each! New tools   will be   $30   for the   first week   or the   first 3 purchases !  Trading Tools Channel on MQL5 : Join my MQL5 channel to update the latest news from me Volumatic VIDYA (Variable Index Dynamic Average) es un indicador avanzado diseñado para rastrear tendencias y analizar la presión de compra-venta en cada fase de una tendencia. Utilizando el Promedio Dinámico de Índice Variable (Variable Index Dynamic Average) como técnica principal de s
    Gold Buster M1 System es un sistema de negociación profesional para gráficos M1 en el par XAUUSD. Pero, a pesar de que el sistema se desarrolló originalmente exclusivamente para operar con oro, el sistema también se puede utilizar con otros pares de divisas. Después de la compra, le daré una lista de pares comerciales que se pueden usar con el sistema además de XAUUSD, lo que ampliará sus posibilidades para usar este sistema. ¡TODOS LOS INDICADORES DEL SISTEMA NO SE REPITE! Este sistema es un co
    [ MT5 Version ]  [ Kill Zones ]  [ SMT Divergences ] How to trade using Order Blocks:  Click here User Interface Performance:  During testing in the strategy tester, the UI may experience lag. Rest assured, this issue is specific to the testing environment and does not affect the indicator's performance in live trading. Elevate your trading strategy with the  Order Blocks ICT Multi TF  indicator, a cutting-edge tool designed to enhance your trading decisions through advanced order block analys
    Gold Venamax MT4
    Sergei Linskii
    2 (1)
    Gold Venamax : este es el mejor indicador técnico de acciones. El algoritmo del indicador analiza el movimiento del precio de un activo y refleja la volatilidad y las posibles zonas de entrada. Características del indicador: Este es un súper indicador con Magia y dos bloques de flechas de tendencia para un comercio cómodo y rentable. El botón rojo para cambiar de bloque se muestra en el gráfico. La magia se establece en la configuración del indicador, por lo que puede instalar el indicador en
    Volume Break Oscillator es un indicador que combina el movimiento de precios con las tendencias de volumen en forma de oscilador. Quería integrar el análisis de volumen en mis estrategias, pero siempre me han decepcionado la mayoría de los indicadores de volumen, como OBV, Money Flow Index, A/D, pero también Volume Weighted Macd y muchos otros. Por lo tanto, escribí este indicador para mí mismo, estoy satisfecho con su utilidad y, por lo tanto, decidí publicarlo en el mercado. Características
    El Sincronizador de Ondas es un indicador visual de análisis de ondas. Combina secuencias de movimiento de velas y construye ondas direccionales, produciendo movimientos sincronizados con el mercado. El inicio de cada onda comienza con una flecha de señal; también incluye alertas. El indicador nunca redibujará ni moverá las flechas en el historial anterior. Las flechas de señal aparecen al cierre de la vela. Compatible con cualquier instrumento de trading y marco temporal. Fácil de usar y confi
    Una implementación personal de Order Blocks, una estrategia de negociación de posiciones simple pero efectiva. El operador debe ingresar al mercado o buscar operaciones en la dirección del último bloque de orden, si el rango de precios no se ha roto en la dirección opuesta a la ruptura. Los bloques abiertos no se dibujan para mayor claridad. [ Guía de instalación | Guía de actualización | Solución de problemas | FAQ | Todos los productos ] Un bloque abierto alcista es la primera barra alcista d
    Otros productos de este autor
    El Capturador de Tendencias: La Estrategia del Capturador de Tendencias con Indicador de Alerta es una herramienta versátil de análisis técnico que ayuda a los traders a identificar las tendencias del mercado y los posibles puntos de entrada y salida. Presenta una Estrategia dinámica del Capturador de Tendencias, adaptándose a las condiciones del mercado para una clara representación visual de la dirección de la tendencia. Los traders pueden personalizar los parámetros para que se ajusten a su
    FREE
    El Buscador de Niveles de Soporte y Resistencia: El Buscador de Niveles de Soporte y Resistencia es una herramienta avanzada diseñada para mejorar el análisis técnico en el trading. Con niveles de soporte y resistencia dinámicos, se adapta en tiempo real a medida que se desarrollan nuevos puntos clave en el gráfico, proporcionando un análisis dinámico y receptivo. Su capacidad única de múltiples marcos temporales permite a los usuarios mostrar niveles de soporte y resistencia de diferentes mar
    FREE
    Herramienta de Posición de Operaciones y Backtesting: La "Herramienta de Posición de Operaciones y Backtesting", también conocida como "Herramienta de Ratio de Riesgo y Recompensa", es un indicador completo e innovador diseñado para mejorar tu análisis técnico y estrategias de trading. La Herramienta de Riesgo es una solución completa y fácil de usar para una gestión efectiva del riesgo en el trading de forex. Con la capacidad de previsualizar posiciones de operaciones, incluyendo precio de en
    FREE
    Ante todo, vale la pena enfatizar que esta Herramienta de Trading es un Indicador No Repintado, No Redibujado y No Retrasado, lo que la hace ideal para el trading profesional. Curso en línea, manual del usuario y demostración. El Indicador de Conceptos de Acción del Precio Inteligente es una herramienta muy potente tanto para traders nuevos como experimentados. Combina más de 20 indicadores útiles en uno solo, combinando ideas avanzadas de trading como el Análisis del Trader del Círculo Interi
    El Indicador de Tiempo de Sesiones de Trading: El "Indicador de Tiempo de Sesiones de Trading" es una poderosa herramienta de análisis técnico diseñada para mejorar su comprensión de las diferentes sesiones de trading en el mercado de divisas. Este indicador integrado de forma transparente proporciona información crucial sobre los horarios de apertura y cierre de las principales sesiones, incluidas Tokio, Londres y Nueva York. Con el ajuste automático de la zona horaria, atiende a los traders
    FREE
    El Buscador de Niveles de Soporte y Resistencia: El Buscador de Niveles de Soporte y Resistencia es una herramienta avanzada diseñada para mejorar el análisis técnico en el trading. Con niveles de soporte y resistencia dinámicos, se adapta en tiempo real a medida que se desarrollan nuevos puntos clave en el gráfico, proporcionando un análisis dinámico y receptivo. Su capacidad única de múltiples marcos temporales permite a los usuarios mostrar niveles de soporte y resistencia de diferentes mar
    FREE
    El Indicador de Tiempo de Sesiones de Trading: El "Indicador de Tiempo de Sesiones de Trading" es una poderosa herramienta de análisis técnico diseñada para mejorar su comprensión de las diferentes sesiones de trading en el mercado de divisas. Este indicador integrado de forma transparente proporciona información crucial sobre los horarios de apertura y cierre de las principales sesiones, incluidas Tokio, Londres y Nueva York. Con el ajuste automático de la zona horaria, atiende a los traders
    FREE
    Herramienta de Posición de Operaciones y Backtesting: La "Herramienta de Posición de Operaciones y Backtesting", también conocida como "Herramienta de Ratio de Riesgo y Recompensa", es un indicador completo e innovador diseñado para mejorar tu análisis técnico y estrategias de trading. La Herramienta de Riesgo es una solución completa y fácil de usar para una gestión efectiva del riesgo en el trading de forex. Con la capacidad de previsualizar posiciones de operaciones, incluyendo precio de en
    FREE
    Description:  The "Trend Finder Multi Time Frames multi pairs" indicator is a new technical analysis tool designed to assist traders in identifying and confirming trends across multiple timeframes and multiple pairs at the same time. By combining the strengths of various timeframes, this indicator offers a comprehensive view of the market's direction, helping traders make more informed decisions. Features: Multi-Timeframe Analysis: The indicator analyzes trends on different timeframes (e.g., M1
    Description:  First of all Its worth emphasizing here that the Trend Breakout Catcher is  Non-Repainting,  Non-Redrawing    and  Non-Lagging  Indicator, Which makes it ideal from both manual and robot trading. The Trend Breakout Catcher Indicator employs a sophisticated algorithm designed to predict trends early and generate timely Buy and Sell signals at the onset of a breakout. Utilizing a smart calculation based on numerous elements, the indicator forms a robust and redundant system to detec
    Get FREE Advanced Online Course and Learn About Our Advanced Trading System, Link in the Bio!  Click Here.  Our Mission and Vision:   Why Am I Even Here? Here is The Deal Brother, We Offer:Premium Quality Indicators: The Highest Quality Possible Algorithms. Unlimited Activations: Can be used on Unlimited number of Computers, MT4s and MT5s for lifetime. Inexpensive Prices: 30$ is the lowest price possible, Knowing that more than 50% of our Indicators are 100% FREE. But Why Am I telling You this?
    Description:  For a comprehensive understanding of our indicators, we invite you to explore the entire Q&A section within this MQL5 blog post   here . The "Currency Strength Meter Strategy" Indicator is a cutting-edge technical analysis tool that offers traders a unique perspective on the forex market. By analyzing the relative strength of different currencies, this indicator provides valuable insights into the market's dynamics, allowing traders to make informed decisions. Understanding Curren
    Description:  For a comprehensive understanding of our indicators, we invite you to explore the entire Q&A section within this MQL5 blog post   here . The "Candlestick Pattern Finder with Alerts and Hide Button" is a sophisticated technical analysis tool designed to elevate your trading experience by identifying key candlestick patterns in the market. This powerful indicator offers valuable insights into price action, enabling you to make well-informed trading decisions. Unlock Candlestick Insi
    Description:  For a comprehensive understanding of our indicators, we invite you to explore the entire Q&A section within this MQL5 blog post   here . The Stochastic Cross Alert Indicator is a valuable technical analysis tool that helps traders with better signals for identifying potential trend reversals and momentum shifts. Designed to work seamlessly on various financial instruments, this indicator provides real-time alerts and customizable parameters, making it a versatile addition to your
    Description:  For a comprehensive understanding of our indicators, we invite you to explore the entire Q&A section within this MQL5 blog post   here . The "Moving Average Lines Crossover with Alert" is a valuable technical analysis tool designed to help traders identify potential trend reversals and trading opportunities. Seamlessly integrated into your trading platform, this indicator empowers you with essential data to make well-informed trading decisions. Spot Trend Reversals: Utilize the pow
    FREE
    Description:  For a comprehensive understanding of our indicators, we invite you to explore the entire Q&A section within this MQL5 blog post   here . The "Show TP and SL Values" Indicator is a valuable technical analysis tool designed to enhance your trading experience by displaying the  (TP) and  (SL) levels directly on your chart. This simple yet effective tool provides traders with crucial information, allowing for better decision-making and risk management. Key Features: TP and SL Display:
    FREE
    Description:  For a comprehensive understanding of our indicators, we invite you to explore the entire Q&A section within this MQL5 blog post   here . The "Live Account Statistics" Indicator is a powerful technical analysis tool that provides real-time insights into the performance of your trading account. With this indispensable tool, you can access crucial account statistics, such as balance, equity, drawdown, and more, allowing you to make data-driven trading decisions. Key Features: Real-Ti
    FREE
    A Simple Visual Indication of the Trading Sessions Times. This Indicator will help you Visualize the Trading sessions and take advantage of the session precise timing to trade at the open of each session where there might be more liquidity. This Indicator is FREE, So pls Dont forget to leave a 5 * stars Review, This Will help me create new Ideas and Indicators and Upload them to the Market. More Professional and useful Indicators and tools here:  https://www.mql5.com/en/users/dubaiforexgroup/sel
    FREE
    Price Alert Panel MT4
    Issam Kassas
    4.69 (13)
    Get FREE Advanced Online Course and Learn About Our Advanced Trading System, Link in the Bio!  Click Here.  Our Mission and Vision: Why Am I Even Here?Here is The Deal Brother, We Offer: Premium Quality Indicators: The Highest Quality Possible Algorithms. Unlimited Activations: Can be used on Unlimited number of Computers, MT4s and MT5s for lifetime. Inexpensive Prices: 30$ is the lowest price possible, Knowing that more than 50% of our Indicators are 100% FREE. But Why Am I telling You this?
    FREE
    Description:  The Range Breakout Catcher Indicator is a powerful tool known for its non-repainting, non-redrawing, and non-lagging capabilities, making it suitable for both manual and robot trading. This indicator utilizes a smart algorithm to calculate ranges and generate early signals for Buy and Sell positions at the breakout of these ranges, facilitating the capture of trends during ranging consolidations. The range calculation involves a comprehensive system based on various elements, prov
    Description:  For a comprehensive understanding of our indicators, we invite you to explore the entire Q&A section within this MQL5 blog post   here . The Moving Average 5EMA Indicator is a valuable tool designed to provide comprehensive insights into market trends and potential entry and exit points. It incorporates five exponential moving average (EMA) lines, each representing the average price over different periods. This powerful combination offers a deeper understanding of price movements a
    FREE
    Description:  For a comprehensive understanding of our indicators, we invite you to explore the entire Q&A section within this MQL5 blog post   here . The "VWAP Indicator Strategy" is a cutting-edge technical analysis tool designed to provide traders with a competitive advantage in the financial markets. By incorporating the Volume Weighted Average Price (VWAP) indicator, this tool offers valuable insights into market trends, price levels, and potential turning points. Understanding the VWAP Ind
    Show TP and SL Values
    Issam Kassas
    4.6 (10)
    Description:  For a comprehensive understanding of our indicators, we invite you to explore the entire Q&A section within this MQL5 blog post   here . The "Show TP and SL Values" Indicator is a valuable technical analysis tool designed to enhance your trading experience by displaying the  (TP) and  (SL) levels directly on your chart. This simple yet effective tool provides traders with crucial information, allowing for better decision-making and risk management. Key Features: TP and SL Display:
    FREE
    Description:  For a comprehensive understanding of our indicators, we invite you to explore the entire Q&A section within this MQL5 blog post   here . The "High Spread Alert" Indicator is a valuable tool for traders, providing real-time information about spread fluctuations in the forex market. As a technical analysis tool, it helps traders make informed decisions by alerting them to periods of high spread, which can impact trading conditions and execution. Key Features: Spread Monitoring: The
    FREE
    Description:  For a comprehensive understanding of our indicators, we invite you to explore the entire Q&A section within this MQL5 blog post   here . The "VWAP Indicator Strategy" is a cutting-edge technical analysis tool designed to provide traders with a competitive advantage in the financial markets. By incorporating the Volume Weighted Average Price (VWAP) indicator, this tool offers valuable insights into market trends, price levels, and potential turning points. Understanding the VWAP Ind
    Description:  The "ABC Pattern Strategy With Fibonacci" Indicator is a sophisticated technical analysis tool meticulously designed to recognize and leverage the power of the ABC chart patterns in combination with Fibonacci levels. This cutting-edge strategy empowers traders to make well-informed decisions in the dynamic forex market. By making spotting ABC patterns on price charts an easy task, the indicator offers insights into potential trend reversals or continuations. It seamlessly incorpora
    A Simple Visual Indication of the Trading Sessions Times. This Indicator will help you Visualize the Trading sessions and take advantage of the session precise timing to trade at the open of each session where there might be more liquidity. This Indicator is FREE, So pls Dont forget to leave a 5 * stars Review, This Will help me create new Ideas and Indicators and Upload them to the Market. More Professional and useful Indicators and tools here:  https://www.mql5.com/en/users/dubaiforexgroup/sel
    FREE
    Description:  For a comprehensive understanding of our indicators, we invite you to explore the entire Q&A section within this MQL5 blog post   here . The "High Spread Alert" Indicator is a valuable tool for traders, providing real-time information about spread fluctuations in the forex market. As a technical analysis tool, it helps traders make informed decisions by alerting them to periods of high spread, which can impact trading conditions and execution. Key Features: Spread Monitoring: The i
    FREE
    Description:  For a comprehensive understanding of our indicators, we invite you to explore the entire Q&A section within this MQL5 blog post   here . The "Candlestick Pattern Finder with Alerts and Hide Button" is a sophisticated technical analysis tool designed to elevate your trading experience by identifying key candlestick patterns in the market. This powerful indicator offers valuable insights into price action, enabling you to make well-informed trading decisions. Unlock Candlestick Insi
    Description:  For a comprehensive understanding of our indicators, we invite you to explore the entire Q&A section within this MQL5 blog post   here . The "MACD Crossover with Alert and Button" is a valuable technical analysis tool designed to help traders spot potential trend changes and trading opportunities in the market. This indicator provides essential insights into the market's momentum, enabling you to make well-informed trading decisions. Master the MACD Indicator: The Moving Average Co
    Filtro:
    No hay comentarios
    Respuesta al comentario