BarEndTime by MMD MT5
- Indicadores
- Mariusz Maciej Drozdowski
- Versión: 1.0
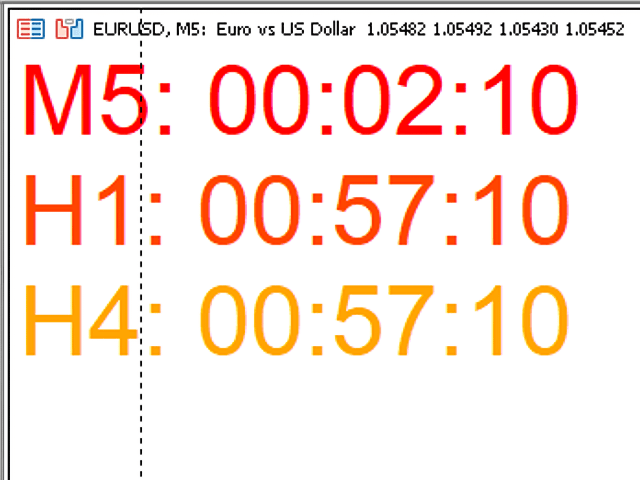
La barra Time End de MMD es un indicador simple que muestra la cantidad de segundos restantes en los tres intervalos seleccionados.
De acuerdo con la metodología MMD, el momento en que ocurre un movimiento direccional del precio es importante. Este indicador le permite usar esta relación de manera más efectiva en el comercio de Forex y Futuros.
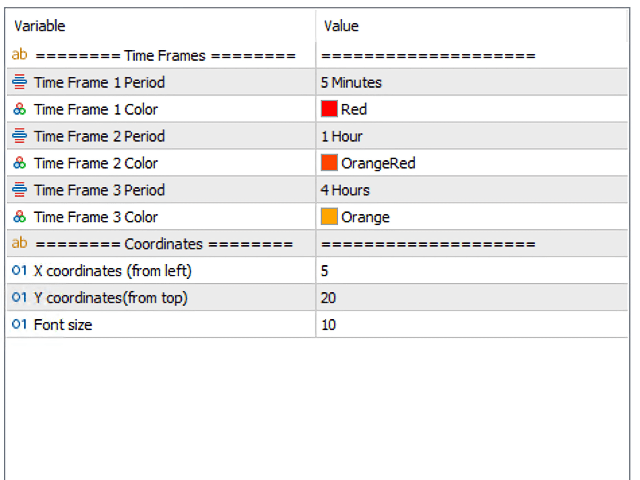
Descripción de la funcionalidad:
Marco de tiempo 1 Período: definición del primer intervalo de tiempo
Time Frame 1 Color - especificando el color para el primer intervalo de tiempo
Marco de tiempo 1 Período: define el segundo intervalo de tiempo
Time Frame 1 Color - especificando el color para el segundo intervalo de tiempo
Marco de tiempo 1 Período: define el tercer intervalo de tiempo
Time Frame 1 Color - especificando el color para el tercer intervalo de tiempo
Ubicación de los datos mostrados en el gráfico:
Coordenadas X: el número de puntos del lado izquierdo del gráfico
Coordenadas Y - el número de puntos desde la parte superior del gráfico
Tamaño de fuente - tamaño de fuente