• Información general
  • Comentarios (1)
  • Discusión

DI VolumeBar

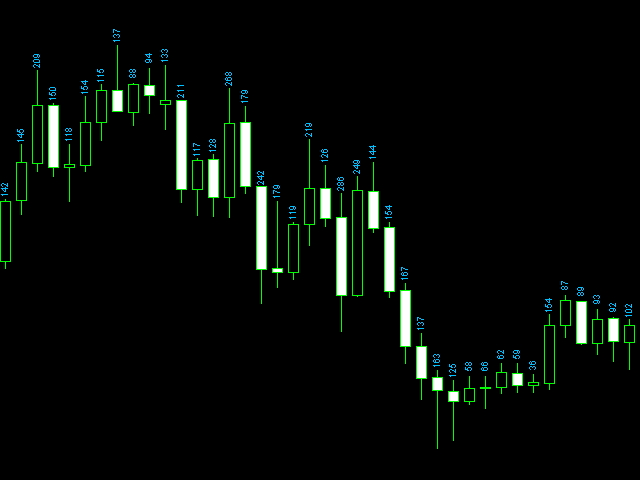
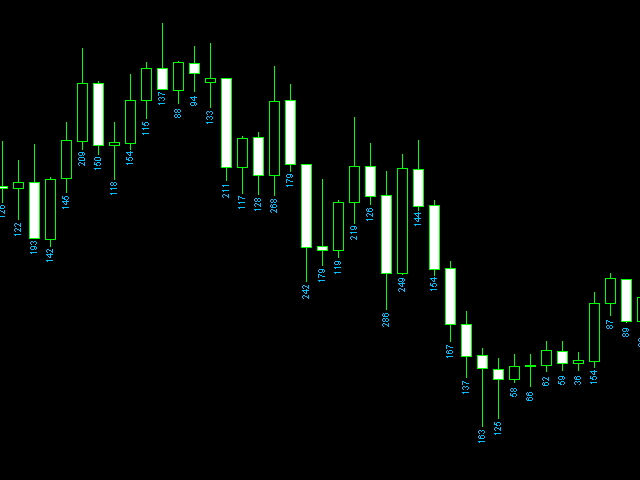
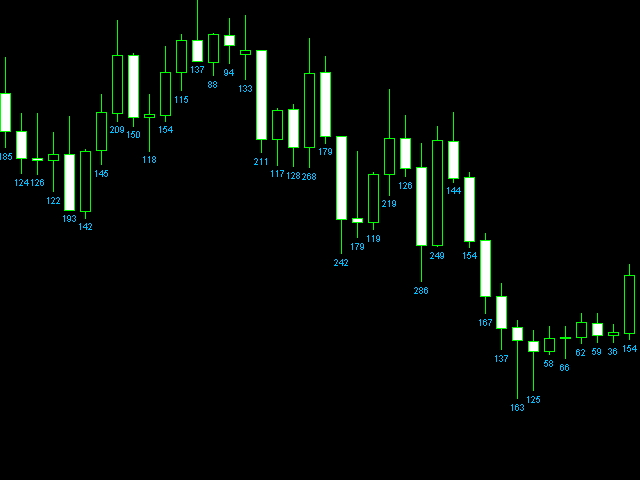
Данный индикатор показывает объем каждого бара (видимый диапазон) в пунктах. Гибкие настройки отображения значений.

Возможна настройка параметров показа. Индикатор создавался для личного пользования, анализа графиков.

Параметры:

  • Color - цвет текстовых меток;
  • Position - позиция метки: 0 - снизу, 1 - сверху;
  • FontSize - размер шрифта;
  • Angle - угол наклона текста;
  • GapPoints - отступ по вертикальной оси.


Productos recomendados
Value Chart Candlesticks
Flavio Javier Jarabeck
4.73 (11)
The idea of a Value Chart indicator was presented in the very good book I read back in 2020 , " Dynamic Trading Indicators: Winning with Value Charts and Price Action Profile ", from the authors Mark Helweg and David Stendahl. The idea is simple and the result is pure genius: Present candlestick Price analysis in a detrended way! HOW TO READ THIS INDICATOR Look for Overbought and Oversold levels. Of course, you will need to test the settings a lot to find the "correct" one for your approach. It
FREE
Free automatic Fibonacci is an indicator that automatically plots a Fibonacci retracement based on the number of bars you select on the BarsToScan setting in the indicator. The Fibonacci is automatically updated in real time as new highest and lowest values appears amongst the selected bars. You can select which level values to be displayed in the indicator settings. You can also select the color of the levels thus enabling the trader to be able to attach the indicator several times with differe
FREE
Spike Catch Pro
Amani Fungo
4.14 (7)
Spike Catch Pro 22:03 release updates Advanced engine for searching trade entries in all Boom and Crash pairs (300,500 and 1000) Programmed strategies improvements Mx_Spikes (to combine Mxd,Mxc and Mxe), Tx_Spikes,   RegularSpikes,   Litho_System,   Dx_System,   Md_System,   MaCross,   Omx_Entry(OP),  Atx1_Spikes(OP),   Oxc_Retracement (AT),M_PullBack(AT) we have added an arrow on strategy identification, this will help also in the visual manual backtesting of the included strategies and see ho
FREE
Functional in the Forex market. Functional in the B3 market - Bolsa Brasil Balcão. Motivation The technical Fibonacci retraction indicator for many is essential and the basis for all market movement forecasts. The name of the tool comes from the Italian mathematician Leonardo de Pisa (13th century). This DEMO version will work in Meta Trader with Demo and Strategy Tester. To purchase the Full version that works on a Real account, click on: https://www.mql5.com/en/market/product/38089 Opera
FREE
QuantumAlert Stoch Navigator is a free indicator available for MT4/MT5 platforms, its work is to provide "alerts" when the market is inside "overbought and oversold" regions in the form of "buy or sell" signals. This indicator comes with many customization options mentioned in the parameter section below, user can customise these parameters as needful. Join our   MQL5 group , where we share important news and updates. You are also welcome to join our private channel as well, contact me for the p
FREE
Moving line
Jun Chao Jiang
The one minute chart has a bug, but the one-day chart can still be used after deleting the bug and reloading the indicators, This indicator can be used to determine how far the indicator goes up to place an order to buy, how far it goes down to place an order to sell, and not placing an order until it reaches this distance, which is considered oscillation, open an account gift index
FREE
Are you tired of drawing trendlines every time you're analyzing charts? Or perhaps you would like more consistency in your technical analysis. Then this is for you. This indicator will draw trend lines automatically when dropped on a chart. How it works Works similar to standard deviation channel found on mt4 and mt5. It has 2 parameters: 1. Starting Bar 2. Number of bars for calculation The   starting bar   is the bar which drawing of the trend lines will begin, while the   number of bars for c
FREE
Donchian Pro
Paulo Henrique Faquineli Garcia
5 (3)
The Donchian Channel Channels are among the most popular tools of technical analysis, as they visually convey to the analyst the limits within which most price movement tends to occur. Channel users know that valuable information can be obtained at any time, whether prices are in the central region of a band or close to one of the border lines. One of the best known techniques to explore these concepts is Bollinger Bands. However, John Bollinger was not the only one to research the application
FREE
QuantumAlert RSI Navigator is a free indicator available for MT4/MT5 platforms, its work is to provide "alerts" when the market is inside "overbought and oversold" regions in the form of "buy or sell" signals. This indicator comes with many customization options mentioned in the parameter section below, user can customise these parameters as needful. Join our MQL5 group , where we share important news and updates. You are also welcome to join our private channel as well, contact me for the priva
FREE
Super Trend Alert Indicator for MT5 is a powerful tool designed to help traders identify and follow market trends with precision. This indicator uses a proprietary algorithm to analyze price movements and provide clear trend signals, making it suitable for traders across all experience levels. You can find the MT4 version here Key features of the Super Trend Indicator include: Advanced trend analysis with real-time market scanning to detect potential trend directions. Real-time alerts that not
FREE
High Low Open Close
Alexandre Borela
4.98 (43)
Si te gusta este proyecto, deja una revisión de 5 estrellas. Este indicador dibuja los precios abiertos, altos, bajos y finales para los especificados período y se puede ajustar para una zona horaria específica. Estos son niveles importantes considerados por muchos institucionales y profesionales comerciantes y puede ser útil para que usted sepa los lugares donde podrían ser más activo. Los períodos disponibles son: Día previo. Semana anterior. Mes anterior. Barrio anterior. Año anterior. O:
FREE
Haven FVG Indicator
Maksim Tarutin
5 (1)
El indicador   Haven FVG   es una herramienta para analizar mercados que permite identificar áreas de ineficiencia (Fair Value Gaps, FVG) en el gráfico, proporcionando a los traders niveles clave para el análisis de precios y la toma de decisiones comerciales. Otros productos ->  AQUÍ Características principales: Configuraciones de colores individuales: Color para FVG alcista   (Bullish FVG Color). Color para FVG bajista   (Bearish FVG Color). Visualización flexible de FVG: Cantidad máxima de v
FREE
LT Donchian Channel
Thiago Duarte
4.83 (6)
Donchian Channel is an indicator created by Richard Donchian. It is formed by taking the highest high and the lowest low of the last specified period in candles. The area between high and low is the channel for the chosen period. Its configuration is simple. It is possible to have the average between the upper and lower lines, plus you have alerts when price hits one side. If you have any questions or find any bugs, please contact me. Enjoy!
FREE
Follow The Line MT5
Oliver Gideon Amofa Appiah
4.52 (29)
This indicator obeys the popular maxim that: "THE TREND IS YOUR FRIEND" It paints a GREEN line for BUY and also paints a RED line for SELL. (you can change the colors). It gives alarms and alerts of all kinds. IT DOES NOT REPAINT and can be used for all currency pairs and timeframes. Yes, as easy and simple as that. Even a newbie can use it to make great and reliable trades. NB: For best results, get my other premium indicators for more powerful and reliable signals. Get them here: https://www.m
FREE
Wave Box Market Frenquency
Jean Jacques Huve Ribeiro
4.75 (4)
Totally linked to the result of a movement and the duration he had. Its height records how many ticks the asset walked during a given movement, its width shows us the duration that movement had. Its configuration must be in line with the Weis Wave Indicator configuration to observe the movement force and can indicate a possible accumulation or distribution of the movement;
FREE
Introducing the Consecutive Green/Red Candle Alert Indicator for MT5 - Your Trend Spotting Companion! Are you ready to take your trading to the next level? We present the Consecutive Green/Red Candle Alert Indicator, a powerful tool designed to help you spot trends and potential reversals with ease. Whether you're a new trader looking for clarity in the market or an experienced pro seeking additional confirmation, this indicator is your trusted companion. Key Features of the Consecutive Green
FREE
WaveTrend Plus
Nguyen Thanh Cong
5 (5)
Introduction WaveTrend Plus is an amazing oscillator that can detect optimal entry points in the market with high precision using complex computations of price and momentum. This version packs many improvements compared to the original WaveTrend such as cleaner visuals, oversold/overbought signals and divergence detection Signal Buy when oversold signal appear (green dot below) or when a bullish divergence is detected (green dashed line) Sell when overbought signal appear (red dot above) or
FREE
Projected Volume
Fernando Lahude Ritter
Volume Projection Indicator The Volume Projection Indicator is a specialized tool designed for traders who focus on the relationship between volume and price action. This intuitive indicator projects the expected volume for the ongoing candle, aiding in decision-making during live market conditions. The indicator presents volume data in a histogram format directly on the chart for quick analysis. Features: Bullish Volume Representation : Each green bar in the histogram signifies the volume for a
FREE
Super Trend eu
Emin Ulucanli
4.75 (4)
SUPERTREND; Es un indicador de seguimiento de tendencias basado en el SuperTrend ATR creado por Olivier Seban. Se puede utilizar para detectar cambios en la dirección de la tendencia y localizar paradas. Cuando el precio cae por debajo de la curva del indicador, se vuelve rojo e indica una tendencia bajista. Por el contrario, cuando el precio se mueve por encima de la curva, el indicador se vuelve verde, lo que indica una tendencia alcista. Al igual que otros indicadores, funciona bien en SuperT
FREE
The indicator highlights the points that a professional trader sees in ordinary indicators. VisualVol visually displays different volatility indicators on a single scale and a common align. Highlights the excess of volume indicators in color. At the same time, Tick and Real Volume, Actual range, ATR, candle size and return (open-close difference) can be displayed. Thanks to VisualVol, you will see the market periods and the right time for different trading operations. This version is intended f
FREE
Cybertrade Keltner Channels
Emanuel Andriato
4.75 (4)
Cybertrade Keltner Channels - MT5 Created by Chester Keltner, this is a volatility indicator used by technical analysis. It is possible to follow the trend of financial asset prices and generate support and resistance patterns. In addition, envelopes are a way of tracking volatility in order to identify opportunities to buy and sell these assets. It works on periods longer than the period visible on the chart. All values ​​are available in the form of buffers to simplify possible automations.
FREE
Bienvenido a nuestro   patrón de onda de precios   MT5 --(Patrón ABCD)-- El patrón ABCD es un patrón comercial poderoso y ampliamente utilizado en el mundo del análisis técnico. Es un patrón de precio armónico que los comerciantes utilizan para identificar oportunidades potenciales de compra y venta en el mercado. Con el patrón ABCD, los operadores pueden anticipar posibles movimientos de precios y tomar decisiones informadas sobre cuándo ingresar y salir de las operaciones. Versión EA:   Pri
FREE
Note from Developer: This is the lite version of the Double TMA with Bands Indicator. I will be uploading a paid version that comes with alerts and on screen signal arrows built in. I will also be selling an EA based on this trading system once all backtesting and optimization have been completed. Unlock your trading potential with the Double TMA Indicator with Reversal Detection! Designed for swing and reversal trading, this versatile tool integrates two Triangular Moving Averages (TMA) f
FREE
Coral Indi
Dinh Duong Luong
Coral trend is   a trend-following indicator that is widely popular among FOREX traders . It is usually used as a confluence with other indicators. It uses combinations of moving averages with complex smoothing formulas! It has two configurable parameters: Coefficient   - smoothing ratio (*) Applied price Calculation: Coral = (-0.064) * B6 + 0.672 * B5 - 2.352 * B4 + 2.744 * B3
FREE
El indicador   "Haven Key Levels PDH PDL"   ayuda a los traders a visualizar los niveles clave en el gráfico. Marca automáticamente los siguientes niveles: DO (Daily Open)   — nivel de apertura del día. NYM (New York Midnight)   — nivel de medianoche en Nueva York. PDH (Previous Day High)   — máximo del día anterior. PDL (Previous Day Low)   — mínimo del día anterior. WO (Weekly Open)   — nivel de apertura de la semana. MO (Monthly Open)   — nivel de apertura del mes. PWH (Previous Week High)  
FREE
Pivot Point Fibo RSJ es un indicador que rastrea las líneas de soporte y resistencia del día utilizando las tasas de Fibonacci. Este espectacular indicador crea hasta 7 niveles de soporte y resistencia a través del Pivot Point utilizando las tasas de Fibonacci. Es fantástico cómo los precios respetan cada nivel de este soporte y resistencia, donde es posible percibir posibles puntos de entrada / salida de una operación. Características Hasta 7 niveles de soporte y 7 niveles de resistencia Es
FREE
El Capturador de Tendencias: La Estrategia del Capturador de Tendencias con Indicador de Alerta es una herramienta versátil de análisis técnico que ayuda a los traders a identificar las tendencias del mercado y los posibles puntos de entrada y salida. Presenta una Estrategia dinámica del Capturador de Tendencias, adaptándose a las condiciones del mercado para una clara representación visual de la dirección de la tendencia. Los traders pueden personalizar los parámetros para que se ajusten a su
FREE
Bar Color Trend
Germano Chagas
4.38 (8)
Combining the best of Price Action , Directional Movement , and Divergence/Convergence analysis, Candle Color Trend is a easy and reliable way to identify trend direction. The indicator automatically paints the candles according to the assumption that an uptrend is defined by prices that form a series of higher highs and higher lows. In contrast, a downtrend is defined by prices that form a series of lower highs and lower lows. Additionally, ADX Wilder indicator is used to measure trend weakness
FREE
Time Spaced Moving Averages
Flavio Javier Jarabeck
5 (3)
The concept is simple: Plotting Price behavior within several periods of time. Some Symbols behave very well during the trading day - with this I mean Intraday trading - and this behavior ends up plotting effectively well with the proposed Exponential Moving Averages in this indicator... Obviously that this behavior could not be seen in all Symbols, but you can give it a try... Just drop this indicator in a chart and you will see for yourself... This indicator is intended for "Feeling the Trend"
FREE
This is a buyer and seller aggression indicator that analyzes the shape of each candle and project this data in a histogram form. There are 4 histograms in one. On the front we have two: Upper - Buyer force. Lower - Seller force. At the background we also have two histogram, both with same color. They measure the combined strenght of buyers and sellers. This histograms can be turned off in Input Parameters. It is also possible to have the real or tick volume to help on this force measurement. IN
FREE
Los compradores de este producto también adquieren
Trend Screener Pro MT5
STE S.S.COMPANY
4.85 (79)
Desbloquee el poder del comercio de tendencias con el indicador Trend Screener: ¡su solución definitiva para el comercio de tendencias impulsada por lógica difusa y un sistema multidivisa!Mejore su comercio de tendencias con Trend Screener, el revolucionario indicador de tendencias impulsado por lógica difusa. Es un poderoso indicador de seguimiento de tendencias que combina más de 13 herramientas y funciones premium y 3 estrategias comerciales, lo que lo convierte en una opción versátil para co
Moneytron — профессиональный сигнальный индикатор тренда Индикатор Moneytron предназначен для тех, кто хочет зарабатывать стабильно и системно, торгуя по тренду. Он автоматически определяет: • Точки входа (Buy/Sell сигналы) • 3 уровня тейк-профита (TP1, TP2, TP3) • 3 уровня стоп-лосса (SL1, SL2, SL3) • Показывает реальную статистику успешности сделок прямо на графике Особенности: • Работает на всех валютных парах и металлах • Идеален для таймфреймов M30, H1 и выше • Подходит как для начинающи
Algo Pumping
Ihor Otkydach
5 (7)
PUMPING STATION – Tu estrategia personal "todo incluido" Te presentamos PUMPING STATION, un indicador revolucionario para Forex que transformará tu forma de operar en una experiencia emocionante y eficaz. No es solo un asistente, sino un sistema de trading completo con potentes algoritmos que te ayudarán a operar de forma más estable. Al comprar este producto, recibes GRATIS: Archivos de configuración exclusivos: para una configuración automática y un rendimiento óptimo. Manual en video paso a
Golden Trend Indicator MT5
Noha Mohamed Fathy Younes Badr
4.89 (18)
Golden Trend indicator  is The best indicator for predicting trend movement this indicator never lags and never repaints and never back paints    and give  arrow buy and sell    before the candle appear  and it will help you and  will make your trading decisions clearer its work on all currencies and  gold and crypto and all time frame This unique  indicator uses very secret algorithms to catch the  trends, so you can trade using this indicator and see the trend clear on charts  manual guide and
FX Volume MT5
Daniel Stein
4.82 (17)
FX Volume: Experimente el Verdadero Sentimiento del Mercado desde la Perspectiva de un Bróker Resumen Rápido ¿Desea llevar su estrategia de trading a otro nivel? FX Volume ofrece información en tiempo real sobre cómo los traders minoristas y los brókers están posicionados, mucho antes de que aparezcan informes retrasados como el COT. Ya sea que busque beneficios consistentes o simplemente quiera una ventaja más profunda en los mercados, FX Volume le ayuda a identificar desequilibrios important
Support And Resistance Screener está en un indicador de nivel para MetaTrader que proporciona múltiples herramientas dentro de un indicador. Las herramientas disponibles son: 1. Cribador de estructura de mercado. 2. Zona de retroceso alcista. 3. Zona de retroceso bajista. 4. Puntos pivotes diarios 5. Puntos de pivote semanales 6. Puntos Pivotes mensuales 7. Fuerte soporte y resistencia basado en patrón armónico y volumen. 8. Zonas de nivel de banco. OFERTA POR TIEMPO LIMITADO: El indicador de so
FX Power MT5 NG
Daniel Stein
5 (14)
FX Power: Analiza la Fuerza de las Divisas para Decisiones de Trading Más Inteligentes Descripción General FX Power es tu herramienta esencial para comprender la fuerza real de las principales divisas y el oro en cualquier condición de mercado. Al identificar divisas fuertes para comprar y débiles para vender, FX Power simplifica las decisiones de trading y descubre oportunidades de alta probabilidad. Ya sea que quieras seguir las tendencias o anticipar reversiones utilizando valores extremos
Grabber System MT5
Ihor Otkydach
5 (5)
Te presento un excelente indicador técnico: Grabber, que funciona como una estrategia de trading "todo incluido" lista para usar. En un solo código se integran potentes herramientas de análisis técnico del mercado, señales de trading (flechas), funciones de alertas y notificaciones push. Cada comprador de este indicador recibe además de forma gratuita: Grabber Utility: una herramienta para la gestión automática de órdenes abiertas Video manual paso a paso: cómo instalar, configurar y operar con
Quantum TrendPulse
Bogdan Ion Puscasu
5 (13)
Presentamos   Quantum TrendPulse   , la herramienta de trading definitiva que combina el poder de   SuperTrend   ,   RSI   y   Stochastic   en un indicador integral para maximizar su potencial de trading. Diseñado para traders que buscan precisión y eficiencia, este indicador le ayuda a identificar tendencias del mercado, cambios de impulso y puntos de entrada y salida óptimos con confianza. Características principales: Integración con SuperTrend:   siga fácilmente la tendencia predominante del
TPSproTREND PrO MT5
Roman Podpora
4.72 (18)
VERSION MT4        —        ИНСТРУКЦИЯ RUS           —        INSTRUCTIONS  ENG Funciones principales: Señales de entrada precisas ¡SIN RENDERIZACIÓN! Si aparece una señal, ¡sigue siendo relevante! Esta es una diferencia importante con respecto a los indicadores de redibujo, que pueden proporcionar una señal y luego cambiarla, lo que puede provocar una pérdida de fondos depositados. Ahora puedes ingresar al mercado con mayor probabilidad y precisión. También existe la función de colorear las v
Gold Stuff mt5
Vasiliy Strukov
4.93 (178)
Gold Stuff mt5: un indicador de tendencia diseñado específicamente para el oro, también se puede usar en cualquier instrumento financiero. El indicador no se vuelve a dibujar ni se retrasa. El marco de tiempo recomendado es H1. IMPORTANTE! Póngase en contacto conmigo inmediatamente después de la compra para obtener instrucciones y bonificación!   Puede obtener una copia gratuita de nuestro indicador Strong Support y Trend Scanner, por favor envíe un mensaje privado. ¡a mí! PARÁMETROS Draw Ar
FourAverageMT5
Mikhail Sergeev
5 (2)
FourAverage es una nueva palabra en la detección de tendencias. Con el desarrollo de las tecnologías de la información y un gran número de participantes, los mercados financieros son cada vez menos susceptibles de ser analizados por indicadores obsoletos. Los medios técnicos convencionales de análisis, como la media Móvil o el Estocástico, en su forma pura no son capaces de determinar la dirección de la tendencia o su reversión. ¿Puede un indicador indicar la dirección correcta del precio futuro
FX Levels MT5
Daniel Stein
5 (4)
FX Levels: Zonas de Soporte y Resistencia con Precisión Excepcional para Todos los Mercados Resumen Rápido ¿Busca una manera confiable de identificar niveles de soporte y resistencia en cualquier mercado — ya sean divisas, índices, acciones o materias primas? FX Levels combina el método tradicional “Lighthouse” con un enfoque dinámico vanguardista, ofreciendo una precisión casi universal. Gracias a nuestra experiencia real con brokers y a las actualizaciones automáticas diarias más las de tiem
Matrix Arrow Indicator MT5
Juvenille Emperor Limited
5 (13)
Matrix Arrow Indicator MT5   es una tendencia única 10 en 1 que sigue un indicador   100% sin repintado   de marcos temporales múltiples que se puede usar en todos los símbolos/instrumentos:   divisas ,   materias primas ,   criptomonedas ,   índices ,   acciones .  Matrix Arrow Indicator MT5  determinará la tendencia actual en sus primeras etapas, recopilando información y datos de hasta 10 indicadores estándar, que son: Índice de movimiento direccional promedio (ADX) Índice de canales de prod
IX Power MT5
Daniel Stein
4.86 (7)
IX Power: Descubre perspectivas de mercado para índices, materias primas, criptomonedas y forex Descripción general IX Power es una herramienta versátil diseñada para analizar la fortaleza de índices, materias primas, criptomonedas y símbolos de forex. Mientras que FX Power ofrece la máxima precisión para pares de divisas mediante el uso de datos de todos los pares disponibles, IX Power se centra exclusivamente en los datos del mercado del símbolo subyacente. Esto convierte a IX Power en una e
TPSpro RFI Levels MT5
Roman Podpora
4.55 (20)
Zonas de reversión / Volúmenes máximos / Zonas activas de un jugador importante =       SISTEMA TS TPSPRO INSTRUCCIONES RUS       /       INSTRUCCIONES       ESP       /           Versión MT4        Cada comprador de este indicador recibe adicionalmente GRATIS: 6 meses de acceso a señales comerciales del servicio RFI SIGNALS: puntos de entrada listos para usar según el algoritmo TPSproSYSTEM. Materiales de formación con actualizaciones periódicas: sumérgete en la estrategia y haz crecer tu niv
Este es posiblemente el indicador de reconocimiento automático de formación de precios más completo que puede encontrar para la plataforma MetaTrader. Detecta 19 patrones diferentes, toma las proyecciones de Fibonacci tan en serio como usted, muestra la zona de reversión potencial (PRZ) y encuentra niveles adecuados de stop-loss y take-profit. [ Guía de instalación | Guía de actualización | Solución de problemas | FAQ | Todos los productos ] Detecta 19 formaciones de precios armónicos diferen
MTF Supply Demand Zones MT5
Georgios Kalomoiropoulos
5 (1)
Próxima generación de zonas de oferta y demanda automatizadas. Algoritmo nuevo e innovador que funciona en cualquier gráfico. Todas las zonas se crean dinámicamente de acuerdo con la acción del precio del mercado. DOS TIPOS DE ALERTAS --> 1)CUANDO EL PRECIO LLEGA A UNA ZONA 2)CUANDO SE FORMA UNA NUEVA ZONA No obtienes un indicador inútil más. Obtiene una estrategia comercial completa con resultados probados.     Nuevas características:     Alertas cuando el precio llega a la zona de ofert
El Oscilador de Índice de Precisión (Pi-Osc) de Roger Medcalf de Precision Trading Systems La versión 2 ha sido cuidadosamente recodificada para cargar rápidamente en su gráfico y se han incorporado algunas otras mejoras técnicas para mejorar la experiencia. El Pi-Osc fue creado para proporcionar señales precisas de temporización de operaciones diseñadas para encontrar puntos de agotamiento extremos, los puntos a los que los mercados se ven obligados a llegar solo para eliminar las órdenes de
The   Time_Price_SQ9_Degree   indicator is based on the 9 Gann square. Using this indicator, you can identify strong time and price zones. The indicator displays the levels as a degree value. The degrees can be set in the settings. After launching, the MENU button appears. If it is highlighted, it can be moved to any point on the graph, and after double-clicking on it, it stops being highlighted and menu buttons appear. To hide the menu, just double-click on the button, it will become highlight
FX Dynamic: Rastrea la volatilidad y las tendencias con un análisis ATR personalizable Descripción general FX Dynamic es una herramienta potente que emplea los cálculos de Average True Range (ATR) para brindar a los traders información incomparable sobre la volatilidad diaria e intradía. Al establecer umbrales de volatilidad claros —por ejemplo, 80%, 100% y 130%— puedes identificar rápidamente oportunidades de beneficio o recibir alertas cuando el mercado excede sus rangos habituales. FX Dynam
Indicador único que implementa un enfoque profesional y cuantitativo para el comercio de reversión a la media. Aprovecha el hecho de que el precio se desvía y vuelve a la media de manera predecible y medible, lo que permite reglas claras de entrada y salida que superan ampliamente las estrategias comerciales no cuantitativas. [ Installation Guide | Update Guide | Troubleshooting | FAQ | All Products ] Señales comerciales claras Sorprendentemente fácil de operar Colores y tamaños personalizables
Ante todo, vale la pena enfatizar que esta Herramienta de Trading es un Indicador No Repintado, No Redibujado y No Retrasado, lo que la hace ideal para el trading profesional. Curso en línea, manual del usuario y demostración. El Indicador de Conceptos de Acción del Precio Inteligente es una herramienta muy potente tanto para traders nuevos como experimentados. Combina más de 20 indicadores útiles en uno solo, combinando ideas avanzadas de trading como el Análisis del Trader del Círculo Interi
¿Cansado de trazar líneas de soporte y resistencia? La resistencia de soporte es un indicador de marco de tiempo múltiple que detecta y traza automáticamente los soportes y las líneas de resistencia en el gráfico con un giro muy interesante: a medida que los niveles de precios se prueban con el tiempo y aumenta su importancia, las líneas se vuelven más gruesas y oscuras. [ Guía de instalación | Guía de actualización | Solución de problemas | FAQ | Todos los productos ] Mejora tu análisis técnic
Legend mt5
Vladyslava Shaviernieva
This is an indicator that includes the best basic forex indicators , without redrawing. Based on this data, a sell or buy signal is generated. It does not disappear anywhere after the signal, which gives us the opportunity to see the results on the history. It can be used on any currency pair, crypto, metals, stocks It is best used on an hourly chart, but other periods are also acceptable. The best results for the period H1,H4,daily If customers have any questions, I will answer them and af
DESCRIPCIÓN ICSM (Impulse-Correction SCOB Mapper) es el indicador que analiza el movimiento del precio e identifica impulsos válidos, correcciones y SCOBs (Single Candle Order Block). Es una herramienta poderosa que se puede utilizar con cualquier tipo de análisis técnico porque es flexible, informativa, fácil de usar y mejora sustancialmente la conciencia del trader sobre las zonas de interés más líquidas. CONFIGURACIÓN General | Visuales Tema de color — define el tema de color del ICSM.
Auto Order Block with break of structure based on ICT and Smart Money Concepts (SMC) Futures Break of Structure ( BoS )             Order block ( OB )            Higher time frame Order block / Point of Interest ( POI )    shown on current chart           Fair value Gap ( FVG ) / Imbalance   -  MTF      ( Multi Time Frame )    HH/LL/HL/LH  -  MTF      ( Multi Time Frame )  Choch  MTF      ( Multi Time Frame )  Volume Imbalance     ,  MTF          vIMB Gap’s Power of 3 Equal High / Low’s  
ICT, SMC, SMART MONEY CONCEPTS, SMART MONEY, Smart Money Concept, Support and Resistance, Trend Analysis, Price Action, Market Structure, Order Blocks, BOS/CHoCH,   Breaker Blocks ,  Momentum Shift,   Supply&Demand Zone/Order Blocks , Strong Imbalance,   HH/LL/HL/LH,    Fair Value Gap, FVG,  Premium  &   Discount   Zones, Fibonacci Retracement, OTE, Buy Side Liquidity, Sell Side Liquidity, BSL/SSL Taken, Equal Highs & Lows, MTF Dashboard, Multiple Time Frame, BigBar, HTF OB, HTF Market Structure
Black Dragon indicator mt5
Ramil Minniakhmetov
4.84 (61)
El indicador de detección de tendencias complementará cualquier estrategia y también se puede utilizar como una herramienta independiente. Ventajas Fácil de usar, no sobrecarga el gráfico con información innecesaria; Puede usarse como filtro para cualquier estrategia; Tiene niveles integrados de soporte y resistencia dinámicos, que se pueden usar tanto para obtener ganancias como para establecer límites de pérdidas; El indicador no cambia de color después de que se cierra la vela;  Funciona e
Easy Buy Sell is a market indicator for opening and closing positions. It becomes easy to track market entries with alerts. It indicates trend reversal points when a price reaches extreme values ​​and the most favorable time to enter the market. it is as effective as a Fibonacci to find a level but it uses different tools such as an algorithm based on ATR indicators and Stochastic Oscillator. You can modify these two parameters as you wish to adapt the settings to the desired period. It cannot
Otros productos de este autor
Volume Bar 2 Osc
Dmitry Iglakov
4 (6)
This indicator displays each bar's volume in points as a histogram. The second version of the indicator. Now it is represented as an oscillator. It is more informative and functional. At that it does not load the main chart. GitHub It displays: bar's volume in points as a histogram (buffer 0) average value of the volume for the whole period (buffer 1) bars upper than the client average value with another color (buffer 2) average value of the amount of bars set by a user (buffer 3) Also: setting
FREE
VolumeBar
Dmitry Iglakov
3.5 (2)
Este indicador muestra el volumen de cada barra (diapasón visible) en puntos. Es posible ajustar los parámetros de muestra. El indicador se creó para el uso personal, el análisis de gráficos. Parámetros: ColorL - color de las marcas textuales. Position - posición de las marcas: 0 - abajo, 1 - arriba. FontSize - tamaño de la fuente. ANGLE - ángulo de inclinación del texto.
FREE
This is a script for quick and easy placement of orders (Buy Stop, Sell Stop, Buy Limit, Sell Limit) to the user's choice. Simply drop the script on a chart part where you want to place the selected order. You can also set the automatic calculation of the lot size for the position, depending on the risk as a percentage. Also, you can use the script as a supplement to your trading strategy, since it is possible to specify a magic number. Features Fast placing of a required order (Buy Stop, Sell S
FREE
Este indicador muestra en el gráfico los niveles de soporte y resistencia. Particularidades: Muestra los niveles de soporte y resistencia para los últimos 12 meses. Muestra el máximo y el mínimo de la última semana. Muestra el valor "МА 200". Muestra las brechas (gaps) con filtro establecido. Ajustes del indicador: ShowMA200 – muestra/no muestra el valor "МА 200". ColorMA200 – color de la línea "МА 200". LineStyleMA200  - estilo de la línea 'МА 200". LineWidthMA200  - ancho de la línea "МА 200
The indicator searches Price Action patterns and puts corresponding labels on a chart. It can display only certain selected patterns. Determined Patterns: Inside Bar. Determinative bullish bar Inside Bar. Determinative bearish bar BUOVB (engulfing). Bullish setup BEOVB (engulfing). Bearish setup DBLHC. Bullish setup (bars with similar Lows and higher closure) DBHLC. Bearish setup (bars with similar Highs and lower closure) Pin Bar. Bullish setup Pin Bar. Bullish setup Pin Bar. Bearish setup Pin
Filtro:
Paulo Henrique Aparecido Leonel
173
Paulo Henrique Aparecido Leonel 2022.09.29 19:53 
 

El usuario no ha dejado ningún comentario para su valoración

Respuesta al comentario