Average Daily Range Alert
- Indicadores
- Tatiana Zvereva
- Versión: 1.5
- Actualizado: 14 septiembre 2022
- Activaciones: 5
The Average Daily Range (ADR) is an indicator that shows how far a currency pair can move in a day.
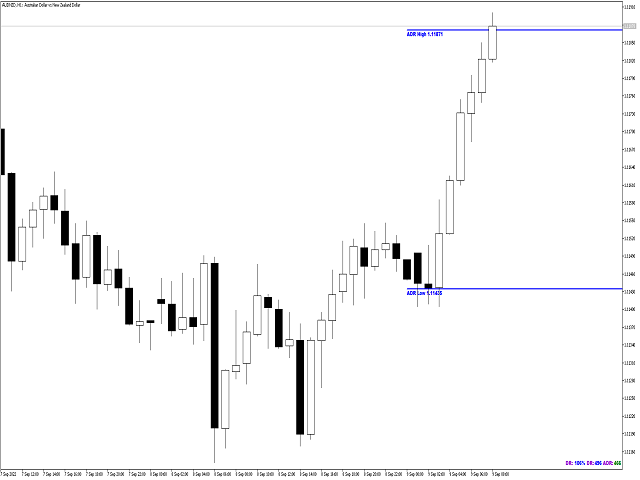
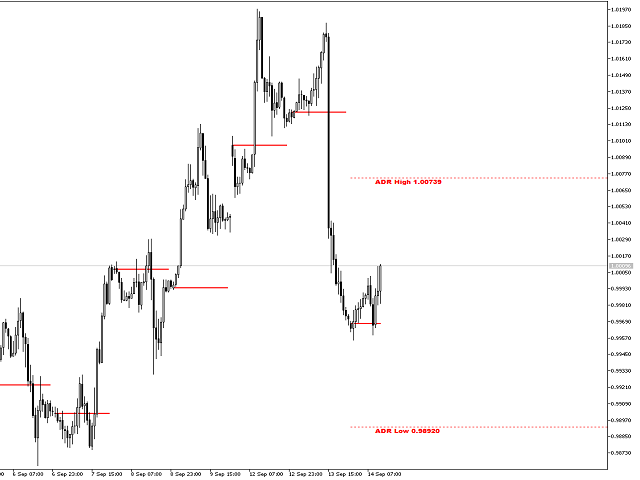
Automatically displays the upper and lower ADR levels.
Automatically calculates the percentage and distance of ADR achieved by the currency pair for the day.
Notifies when the price reaches the ADR level.
Changes the color and thickness of the ADR line when the price reaches it.