TTM Squeeze Momentum MTF
- Indicadores
- Van Nhan Huynh
- Versión: 1.0
- Activaciones: 5
This indicator is based on John Carter's "TTM Squeeze" volatility indicator, as discussed in his book "Mastering the Trade".
In this version, this indicator has some improved features:
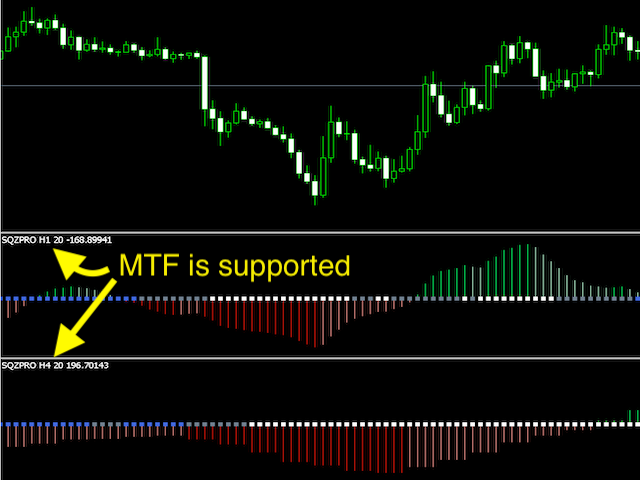
- Multiple timeframes (MTF) is supported. You can analyze multiple timeframes in the same window.
- Histogram is plotted in a different way to help reduce noise.
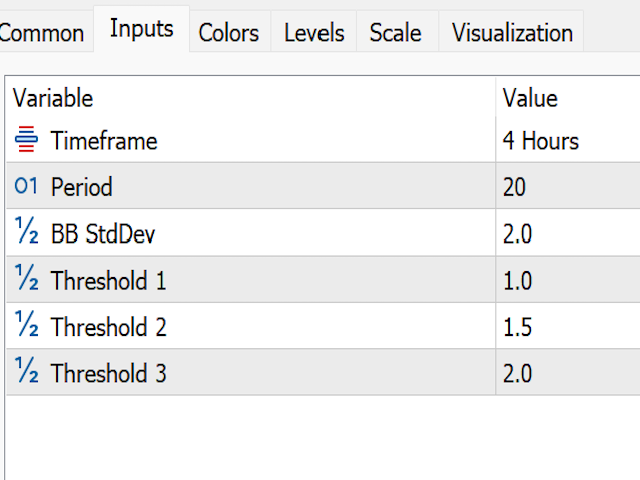
- 3 customizable thresholds to help adjust when the dots change color.
The dot color indicates the market volatility:
- dark blue: very low volatility
- blue: low volatility
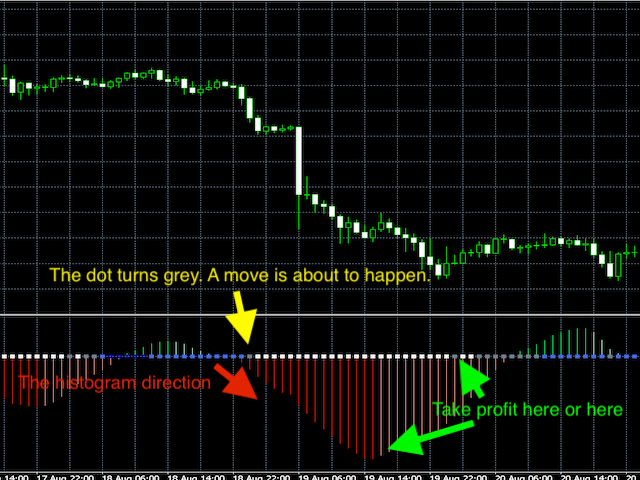
- grey: an explosive move might happen soon
- white: released (exploded)
Strategy:
Mr. Carter suggests waiting for a few dark blue/blue dots (squeezed), and taking the position in the direction of the histogram as soon as the blue/grey dot appears. Exit when the histogram loses its momentum or the dots turn from white to grey/blue.
You can also combine this indicator with other ones like ADX to improve your win rate.
