Multi RSI Pro mt4
- Indicadores
- Natasha Diedericks
- Versión: 1.9
- Actualizado: 15 octubre 2022
- Activaciones: 20
This indicator takes input from the RSI from multiple time frames (M/W/D/H4/H1), and presents the output on the main chart.
Great for scalping.
Features alerts for the current chart's TrendLine above or below price.
TrendLine period setting.
Multi RSI period settings.
How to use:
Simply attach to M5 (Scalping - zoom chart out completely on M5) or use on higher time frames' charts.
Zoom chart out completely to get a better view of the chart.
Hover over the lines to see the time frame applicable.
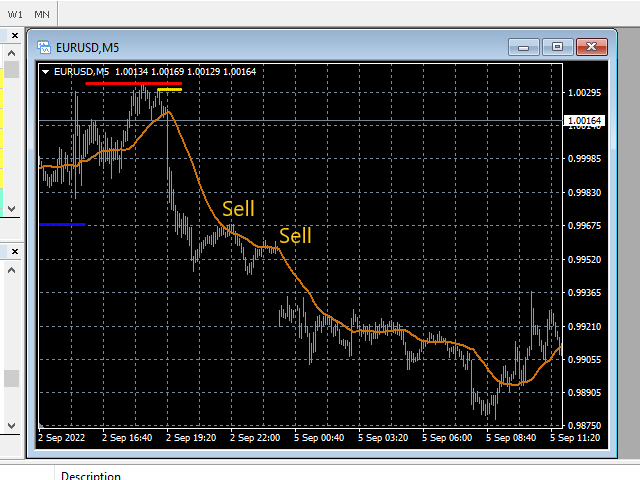
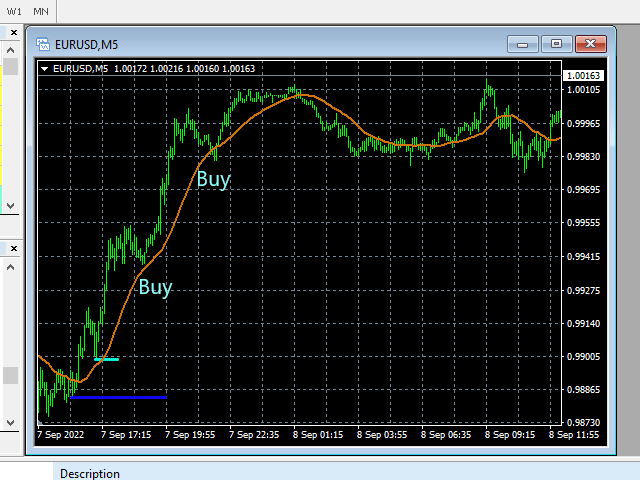
Sell high, Buy low.
e.g, sell trade: Sell when H4 and H1 above price on M5, or Weekly and Daily above price on H4 - wait for TrendLine to cross above price.
e.g, buy trade: Buy when H4 and H1 below price on M5, or Weekly and Daily below price on H4 - wait for TrendLine to cross below price.
See example pictures below.
Or use as you see fit for your strategy.
Best results on Major Pairs, but can also be used on other pairs.
Important to note:
-
Please do not use this indicator haphazardly. Make sure it compliments your strategy.
-
Don't risk money you cannot afford to lose.
-
You use this indicator at your own risk. Please apply money management wisely.
-
Always test your strategy on a demo account before using a new indicator on a live account.

El usuario no ha dejado ningún comentario para su valoración