Change Analyzer
- Indicadores
- Ivan Simonika
- Versión: 1.0
- Activaciones: 5
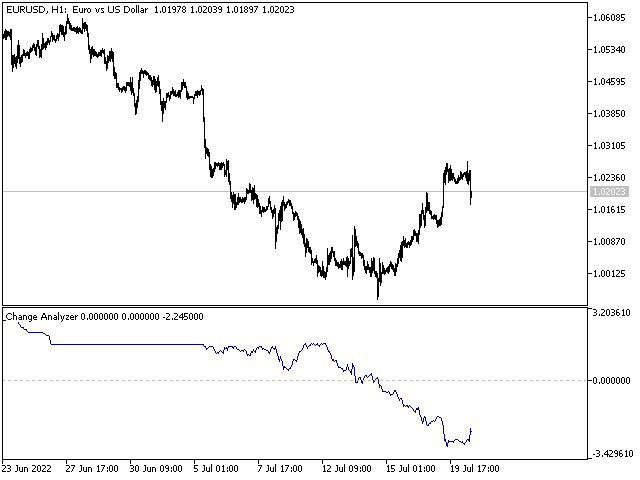
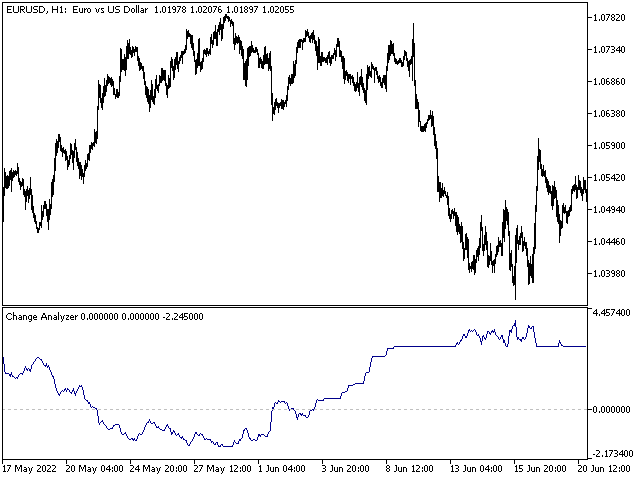
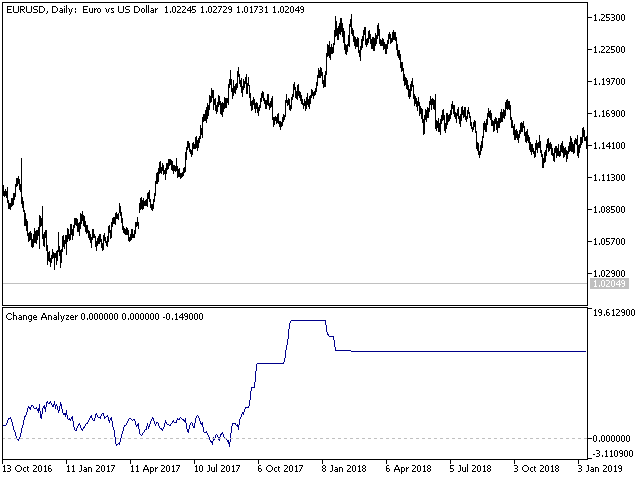
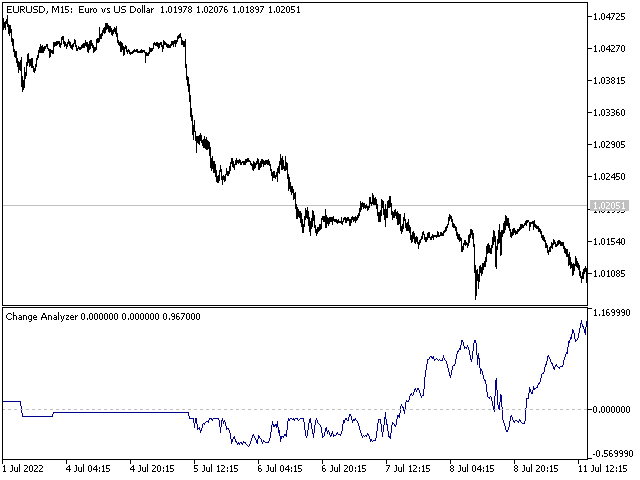
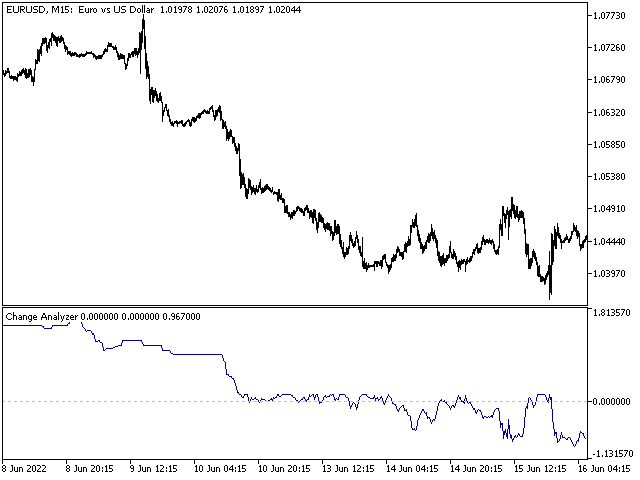
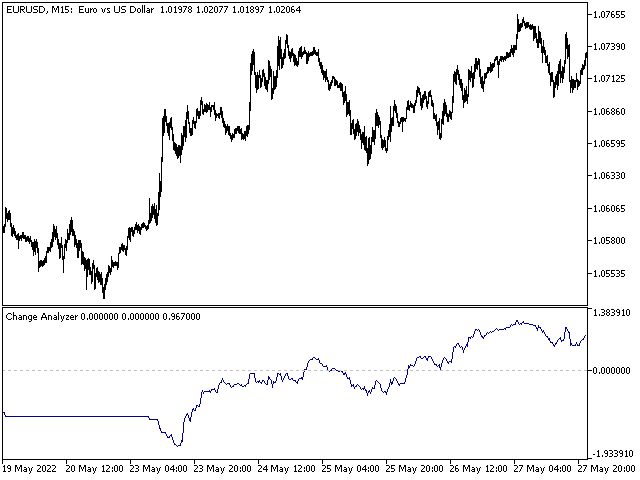
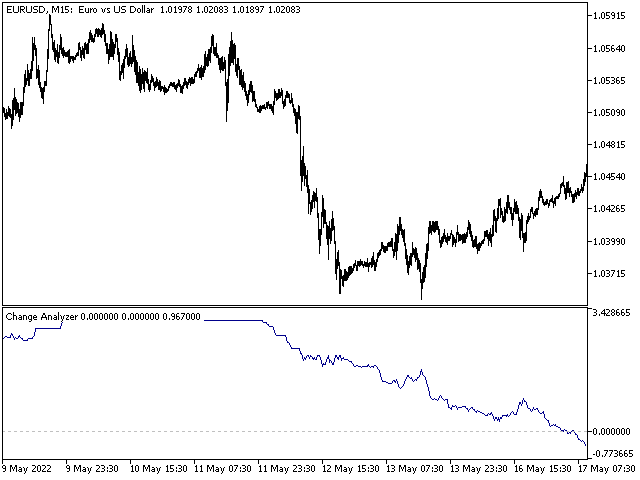
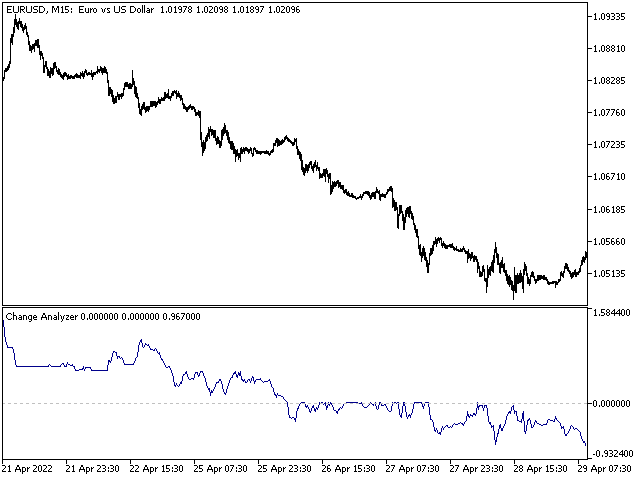
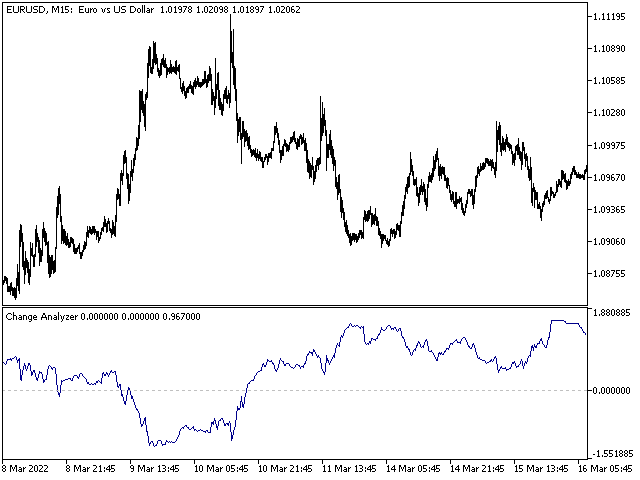
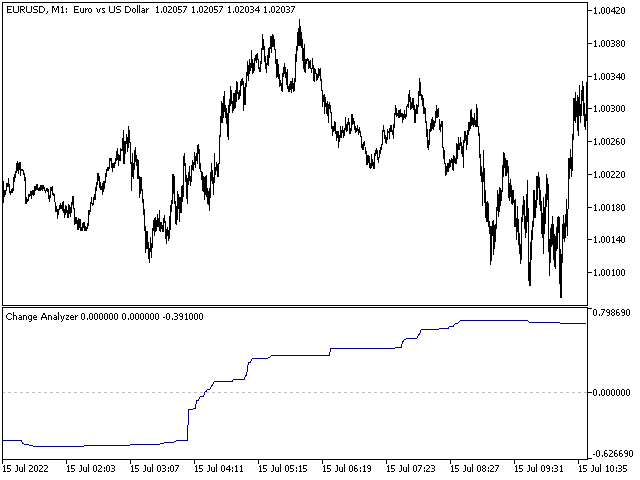
Change Analyzer - The indicator can be called an indicator of market balance. Since the indicator is on the zero line, then the market is balanced in a certain timeframe and a certain instrument.
Based on two virtual windows and their mutual placement, this graph is built. As a result of its work, the price chart normalizes relative to the zero line, which helps to draw conclusions about the price behavior. The indicator is somewhat reminiscent of the overbought and oversold system, but the algorithm is completely different and the analysis results.
The indicator works on two virtual windows. It is necessary to introduce the concept of a virtual window. For example, looking at the chart, we visually see a certain part of the historical data on the window covering the chart at the moment. This is an analogue of the virtual window, set programmatically in this way, the window can "see" the number of bars allowed for it. And the essence of what the indicator's vision sees is the size of the window, that is, the figure showing the distance between the maximum and minimum price values in this window specified in the settings. Thus, a virtual window is formed. The window occupies a certain number of bars, and starts from a certain position relative to the current candle. Everything is set in the settings.
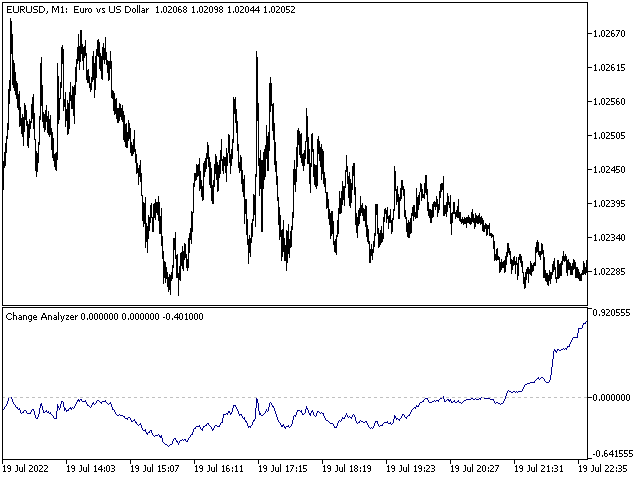
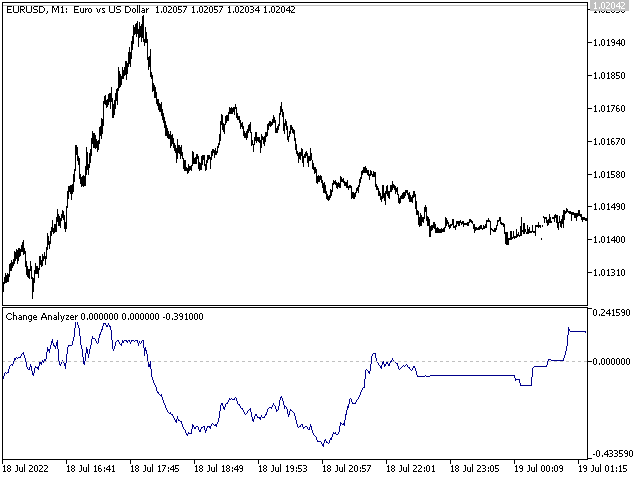
The Change Analyzer can change its appearance a lot depending on the parameters you set. That is, the indicator line is formed from the given two virtual windows, and depending on how the windows are placed, there will be a completely different picture of the indicator.
Examples:
- For example, the windows can start from the last bar and have just different sizes, after which they are compared and as a result of the comparison, the initial line of the chart is formed, the first window can also be smaller, or then the chart will be flipped.
- The second version of the window can be either the same or different, but it can start in such a way that the window starts first, for example, from the first bar, and the second window, for example, from the first bar immediately after the first window. It is as if the windows are next to each other and do not intersect. Then the schedule will be different.
- The third option - a combination of any options with an arbitrary intersection of windows or arbitrary window sizes, will give the value of the resulting line even more.
Options:
- Slow - The length of the first virtual window.
- ShiftSlow - Shift of the second virtual window.
- Fast - The length of the first virtual window.
- ShiftFast - Shift of the second virtual window.
- Scale - Increase the scale of the Difference line.
- AbsOn - Take all values modulo.
- SlowFastVisible - Display two main virtual window dimension lines.
- DifferenceVisible - Display the Difference line.
