• Información general
  • Comentarios
  • Discusión (2)
  • Novedades

Support and Resistance Dashboard MT4

40% off. Original price: $50

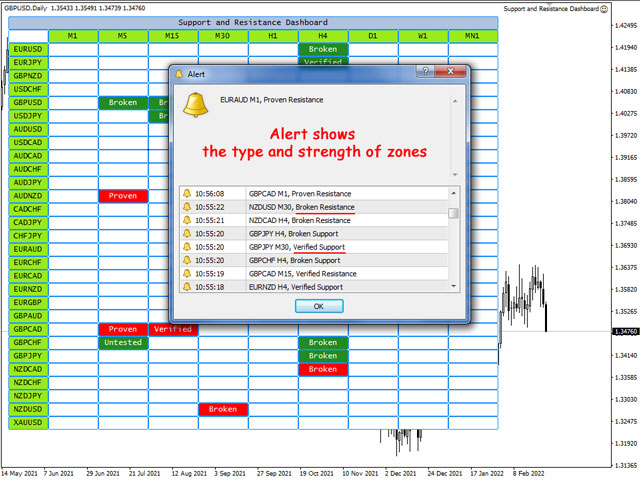
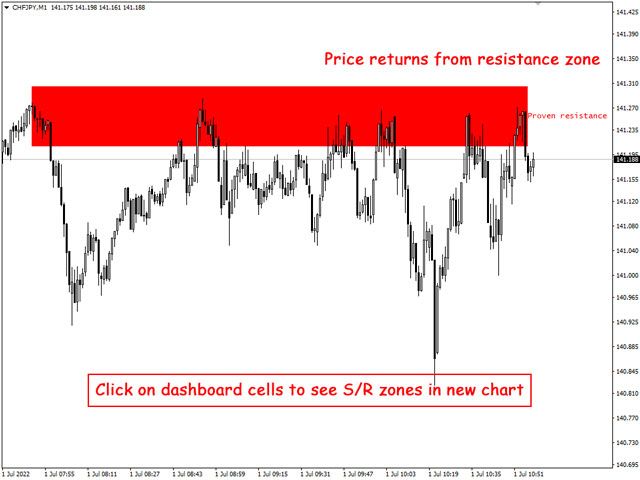
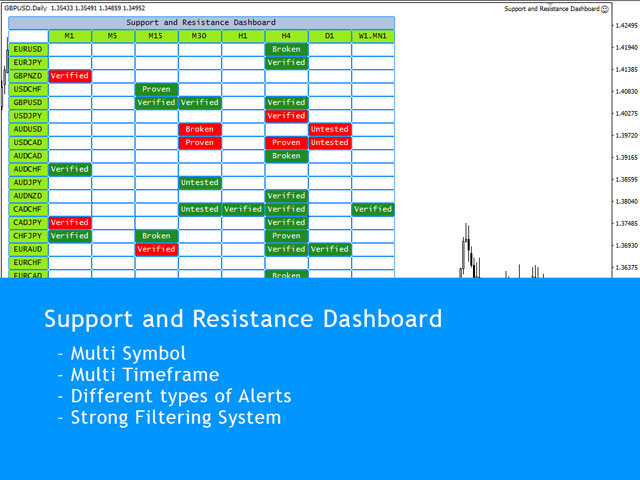
Support and Resistance Dashboard for MT4 is a multi-timeframe and multi-symbol scanner and alert system that finds S/R zones and pivot points for all timeframes and symbols and alerts when price has interaction with them.

If you are using support and resistance (or supply and demand) zones in your trading strategy, this dashboard and its alert and filtering system is a big time saver for you.

Download demo version (works on M1,M5,M30,W1 timeframes)

Full description of scanner parameters -> click here.

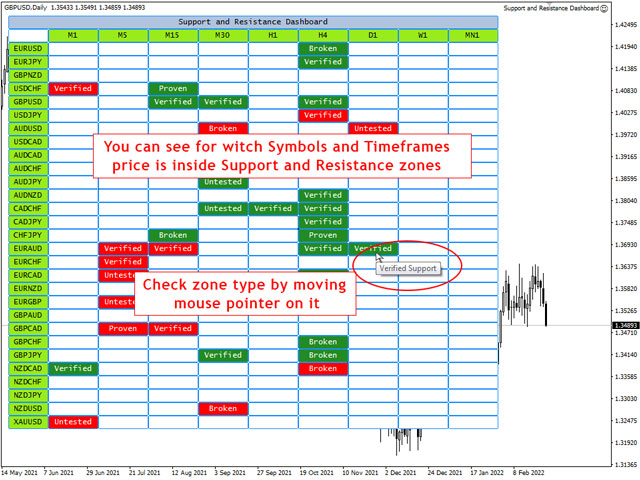
Also, if you are using other trading strategies, you can use this dashboard to avoid getting caught in support and resistance zones. Dashboard shows if the price is in S/R zones without the need to manually check all timeframes.

You don't need any more checking different symbols and timeframes to see if the price is inside the support or resistance zones, just run the dashboard and check the chart when an alert happens (you can select symbols and timeframes that you want to receive alerts).

Informative Dashboard:

  • Dashboard shows if price has interaction with support and resistance zones from M1 to W1 timeframes for all defined symbols.
  • Cell text shows the strength of support and resistance zones and the cell color shows the type of support and resistance zone.
  • The pivot column shows the type and timeframe of pivot point levels that price breaks them or returns to them.
  • By clicking on any of the dashboard cells, you can see the nearest S/R zones to the price and the pivot levels on the new chart.

Dashboard shows Strengths of Support and Resistance Zones:

Zones have different strengths that are:

  • Weak fresh zones: high and low points in trend that price didn't touch them again yet
  • Fresh zones: important high and low points (major turning points) that price didn't touch them again yet
  • Verified zones: strong zones, price touched them before but couldn't break them
  • Proven zones: verified zone that at least four times the price can't break it
  • Broken zones: zones that price breaks them (not applied for weak zones)

Pivot Points Features:

  • Support and resistance dashboard finds the daily, weekly and monthly pivot point levels on the chart.
  • You can receive alert when price breaks a pivot point level or returns to it.
  • You can choose between 5 different calculation type of pivot points (standard, fibonacci, camarilla, woodie and demark).

Powerful alert filters:

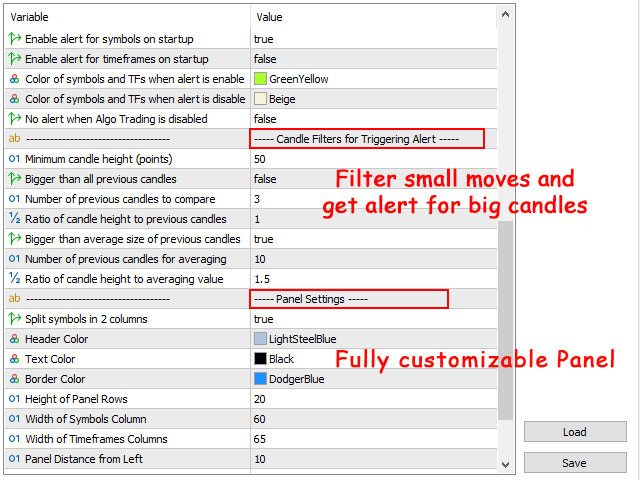
Dashboard has 5 filters to ignoring low quality alerts and finding best prices for order setups. 
  • minimum candle height
  • minimum candle body to height ratio
  • minimum candle height to zone height ratio
  • comparison between candle height and the height of previous candles
  • comparison between candle body and average body length of previous candles

Dashboard Features:

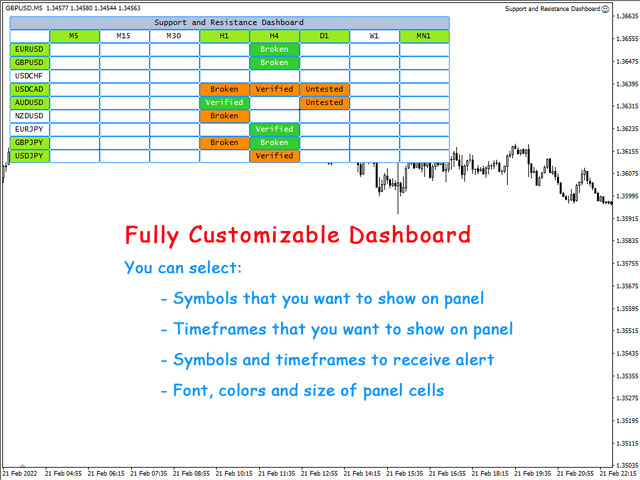
  • You can set the parameters for support and resistance zones in dashboard input parameters.
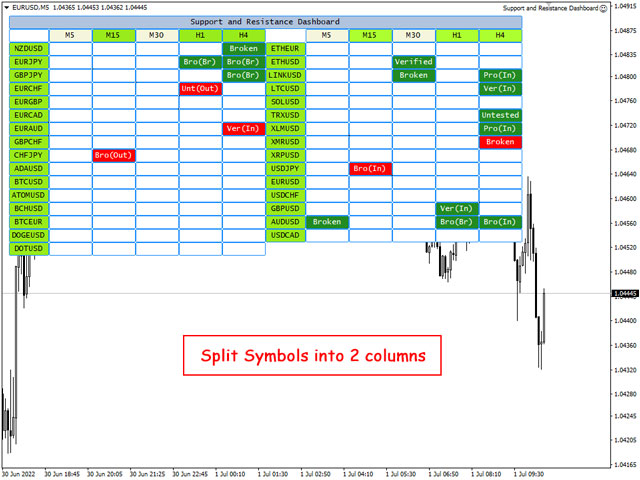
  • You can split the symbols into 2 columns to show more symbols on the chart.
  • You can separate symbols into multiple dashboards with different parameters for each dashboard (for example for different markets).
  • There are a full set of parameters for customizing the appearance of the dashboard .
  • You can enable/disable alerts for symbols and timeframes directly from the dashboard.
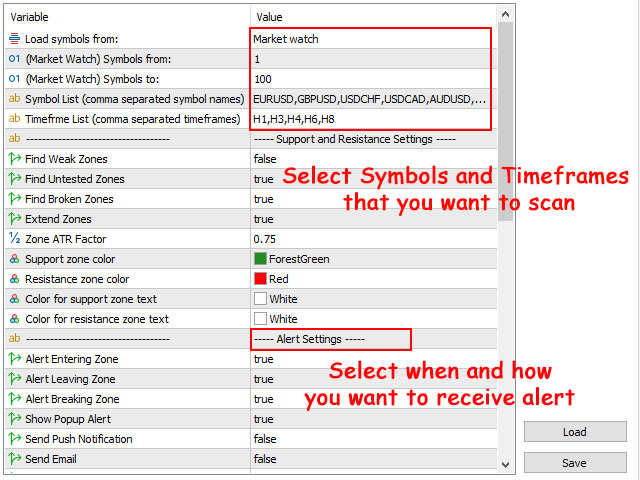
  • Dashboard works for all markets and for all symbols, you can write the symbol names in the settings (comma separate) or simply set the dashboard to read the symbols from the market watch.

Different Alert Types:

You can enable the following alerts at the same time in the dashboard settings.

  • Show Pop Up Alert: Show alert window when alert triggers.
  • Send Push Notification: Send push notification to mobile phone when alert triggers. (You should set metatrader Notifications options)
  • Send Email: Send email when alert triggers. (You should set metatrader Email options)

Notes:

  • Dashboard updates every 1-minute candle open time, run it on more volatile symbols like EURUSD and BTCUSD to receive new price ticks faster.
  • Dashboard finds support and resistance zones based on shevd supply and demand indicator that you can download for free from this link (Dashboard doesn't need the indicator to run).

If you have any question, please ask in the comments section. I'll do my best to answer your questions.

Productos recomendados
Chart Patterns Detect 15 patterns (Ascending Triangle, Descending Triangle, Rising Wedge, Falling Wedge, Bullish Flag, Bearish Flag, Bullish Rectangle, Bearish Rectangle Symmetrical triangle, Head and Shoulders, Inverted Head and Shoulders, Triple top, Triple Bottom, Double Top, Double Bottom) Use historical data to calculate the probability of each pattern to succeed (possibility to filter notification according to the chance of success) gives graphic indication about the invalidation level and
Owl smart levels
Sergey Ermolov
4.34 (35)
Versión MT5  |   FAQ El   Indicador Owl Smart Levels   es un sistema comercial completo dentro de un indicador que incluye herramientas de análisis de mercado tan populares como   los fractales avanzados de Bill Williams , Valable ZigZag que construye   la estructura de onda correcta   del mercado y   los niveles de Fibonacci   que marcan los niveles exactos de entrada. en el mercado y lugares para tomar ganancias. Descripción detallada de la estrategia Instrucciones para trabajar con el indi
Awesome Oscillator by Bill Williams with the ability to fine-tune and replace the averaging algorithms of the indicator, which significantly expands the possibilities of using this oscillator in algorithmic trading and brings it closer in its properties to such an indicator as the MACD. To reduce price noise, the final indicator is processed with an additional Smooth averaging. The indicator has the ability to give alerts, send mail messages and push signals when the direction of movement of th
Noize Absorption Index MT4
Ekaterina Saltykova
5 (1)
Noize Absorption Index - is the manual trading system that measures the difference of pressure between bears forces and bulls forces. Green line - is a noize free index that showing curent situation. Zero value of index shows totally choppy/flat market.Values above zero level shows how powerfull bullish wave is and values below zero measures bearish forces.Up arrow appears on bearish market when it's ready to reverse, dn arrow appears on weak bullish market, as a result of reverse expectation. S
Super Reversal Pattern
Parfait Mujinga Ndalika
Super Reversal Pattern Indicator Unlock the power of advanced pattern recognition with our Super Reversal Pattern Indicator. Designed for traders seeking precision and reliability, this indicator identifies one of the most effective reversal patterns in technical analysis, offering a significant edge in your trading strategy. Key Features: Non-Repainting Accuracy: Enjoy the confidence of non-repainting technology. Once a Super Reversal Pattern is detected, it remains static, providing consis
Trendiness Index
Libertas LLC
5 (3)
"The trend is your friend" is one of the best known sayings in investing, because capturing large trendy price movements can be extremely profitable. However, trading with the trend is often easier said than done, because many indicators are based on price reversals not trends. These aren't very effective at identifying trendy periods, or predicting whether trends will continue. We developed the Trendiness Index to help address this problem by indicating the strength and direction of price trend
The Th3Eng PipFinite indicator is based on a very excellent analysis of the right trend direction with perfect custom algorithms. It show the true direction and the best point to start trading. With StopLoss point and Three Take Profit points. Also it show the right pivot of the price and small points to order to replace the dynamic support and resistance channel, Which surrounds the price. And Finally it draws a very helpful Box on the left side on the chart includes (take profits and Stop loss
Le presentamos el indicador "Candle closing counter", que se convertirá en su asistente indispensable en el mundo del trading. Es por eso que saber cuándo se cerrará la vela puede ayudar: Si usted tiene gusto de negociar usando patrones de la vela, usted sabrá cuando la vela será cerrada. Este indicador le permitirá comprobar si se ha formado un patrón conocido y si hay una posibilidad de negociación. El indicador le ayudará a prepararse para la apertura del mercado y el cierre del mercado.
Ante todo, vale la pena enfatizar que esta Herramienta de Trading es un Indicador No Repintado, No Redibujado y No Retrasado, lo que la hace ideal para el trading profesional. Curso en línea, manual del usuario y demostración. El Indicador de Conceptos de Acción del Precio Inteligente es una herramienta muy potente tanto para traders nuevos como experimentados. Combina más de 20 indicadores útiles en uno solo, combinando ideas avanzadas de trading como el Análisis del Trader del Círculo Interio
Trend Ray
Andriy Sydoruk
The indicator shows the potential trend direction by cyclical-wave dependence. Thus, all the rays of the intersection will be optimal rays, in the direction of which the price is expected to move, taking into account the indicator period. Rays can be used as a direction for potential market movement. But we must not forget that the approach must be comprehensive, the indicator signals require additional information to enter the market.
Daily Candle Predictor es un indicador que predice el precio de cierre de una vela. El indicador está destinado principalmente para su uso en gráficos D1. Este indicador es adecuado tanto para el comercio de divisas tradicional como para el comercio de opciones binarias. El indicador se puede utilizar como un sistema de negociación independiente o puede actuar como una adición a su sistema de negociación existente. Este indicador analiza la vela actual, calculando ciertos factores de fuerza dent
Atomic Analyst
Issam Kassas
5 (2)
En primer lugar, vale la pena enfatizar que este Indicador de Trading no repinta, no redibuja y no se retrasa, lo que lo hace ideal tanto para el trading manual como para el automatizado. Manual del usuario: configuraciones, entradas y estrategia. El Analista Atómico es un Indicador de Acción del Precio PA que utiliza la fuerza y el impulso del precio para encontrar una mejor ventaja en el mercado. Equipado con filtros avanzados que ayudan a eliminar ruidos y señales falsas, y aumentan el poten
Infinity Trend Pro
Yaroslav Varankin
1 (1)
This is a trend indicator without redrawing Developed instead of the binary options strategy (by the color of the Martingale candlestick) Also works well in forex trading When to open trades (binary options) A signal will appear in the place with a candle signaling the current candle It is recommended to open a deal for one candle of the current timeframe M1 and M5 When a blue dot appears, open a deal up When a red dot appears, open a trade down. How to open trades on Forex. When a signal is rec
El Capturador de Tendencias: La Estrategia del Capturador de Tendencias con Indicador de Alerta es una herramienta versátil de análisis técnico que ayuda a los traders a identificar las tendencias del mercado y los posibles puntos de entrada y salida. Presenta una Estrategia dinámica del Capturador de Tendencias, adaptándose a las condiciones del mercado para una clara representación visual de la dirección de la tendencia. Los traders pueden personalizar los parámetros para que se ajusten a s
FREE
Introducing Order Blocks Breaker , a brand-new way to identify and leverage order blocks in your trading strategy. After developing multiple order block tools with unique concepts, I’m proud to present this tool that takes things to the next level. Unlike previous tools, Order Blocks Breaker not only identifies order blocks but also highlights Breaker Order Blocks —key areas where the price is likely to retest after a breakout. MT5 -  https://www.mql5.com/en/market/product/124102/ This tool inco
VR Cub
Vladimir Pastushak
VR Cub es un indicador para obtener puntos de entrada de alta calidad. El indicador fue desarrollado para facilitar los cálculos matemáticos y simplificar la búsqueda de puntos de entrada a una posición. La estrategia comercial para la cual se diseñó el indicador ha demostrado su eficacia durante muchos años. La simplicidad de la estrategia comercial es su gran ventaja, que permite que incluso los operadores novatos negocien con éxito con ella. VR Cub calcula los puntos de apertura de posiciones
Retroceso de Fibonacci & Herramientas de Dibujo de Líneas Extendidas Retroceso de Fibonacci & Herramientas de Dibujo de Líneas Extendidas son aptos para la plataforma MT4 y para operadores que emplean el método de negociación de puntos y la negociación de sección áurea. Ventajas: Sin líneas excusadas ni las excesivamente largas, y es fácil de observar y descubrir oportunidades de negociación. Versión de prueba: https://www.mql5.com/zh/market/product/35884 Funciones principales: 1.
The indicator displays the data of the Stochastic oscillator from a higher timeframe on the chart. The main and signal lines are displayed in a separate window. The stepped response is not smoothed. The indicator is useful for practicing "manual" forex trading strategies, which use the data from several screens with different timeframes of a single symbol. The indicator uses the settings that are identical to the standard ones, and a drop-down list for selecting the timeframe. Indicator Parame
Gold Phoenix
Yaroslav Varankin
The perfect tool for Scalng in the Forex markets You can trade both from signal to signal and using take profit  The algorithm does not use Zigzag!  No redrawing!  This is a channel instrument that uses a moving average as a filter. Moving Average  There are 2 parameters for the settings Ma Period = 5 period Moving Average  Channel 1.0 distance of channel lines from the chart Price Signal Filter - calculation of signal opening and filter There is a complete set of Alert There is a multi-timefram
Candlestick Patterns Analytics is a powerful tool for analyzing candlestick patterns. Do you trade based on candlestick patterns? Then Candlestick Patterns Analytics is designed for you. The undeniable advantage of the indicator: Predicts trading result when trading candlestick patterns; Uses statistical data based on the history of the selected symbol and timeframe. What the indicator does Finds and marks on the chart 29 candlestick patterns; Draws arrows to indicate the classical and stati
Trade with Gann on your side!! MASTER CIRCLE 360 CIRCLE CHART, originally created by Gann admitted that this is “The Mother of all charts”. It is one of the last studies that this great trader left for us. The numeric tab le is apparently quite simple like all the tables and is based on square numbers, the SQUARE OF 12 and is by evolution, one of the most important square numbers. Here we can find CYCLE, PRICE AND TIME thanks to angles and grades, to show past and future support and resistance.
Signal trend indicator. Detects the direction of the trend and is coloured accordingly.  Has built in audible and visual alerts when trends change. Can send notifications to your phone or email. Allows Trend and Counter-Trend trading. Works on all timeframes, all currency pairs, metals, indices and cryptocurrencies. Can be used with binary options. Distinctive features No re-drawing; Simple and clear settings; Four types of alerts; Works on all timeframes and all trading tools; Su
Intraday Levels Advanced fragmenta cada sesión en zonas para trading intradía. Realiza una rejilla de las zonas de precios de cada sesión, sirve como guía para establecer la tendencia de la sesión, las mejores zonas para realizar entradas y las distancias para stop-loss y take-profit. Los parámetros son: Levels Mode: Uno entre los siguientes: Modo Basic: Dibuja los niveles máximo, mínimo y medio de la sesión. Modo Advanced: Dibuja los niveles máximo, mínimo, central e intermedios de la sesi
Line Magnit
Aleksey Trenin
The LineMagnit Indicator for MT4 is a highly precise tool that builds support and resistance levels which magnetically attract prices. This feature allows traders to easily determine the most probable entry and exit points in the market, as well as identify the market's directional forces, as levels are based on capital inflows into the instrument. Equipped with an intuitively understandable graphical interface, the LineMagnit Indicator enables users to quickly locate and analyze support and res
Automatically plots Fibo levels, based on the High & Low prices from the specified time frame Multiple bars may be united: e.g. you can get a Fibo based on the 10-days Highs and Lows My   #1 Utility : 65+ features, including this indicator  |   Contact me  for any questions  |  MT5 version Helps to see potential reversal levels; Patterns formed at the Fibo levels tend to be stronger; Significantly reduces the time spent on manual  plotting ; Settings: Timeframe to calculate the base High & Low p
Strong Retracement Points Pro demo edition! SRP (Strong Retracement/Reversal Points) is a powerful and unique support and resistance indicator. It displays the closest important levels which we expect the price retracement/reversal! If all level are broken from one side, it recalculates and draws new support and resistance levels, so the levels might be valid for several days depending on the market! If you are still hesitating to start using this wonderful tool, you can check this link to see h
Alpha Trend sign has been a very popular trading tool in our company for a long time. It can verify our trading system and clearly indicate trading signals, and the signals will not drift. Main functions: Based on the market display of active areas, indicators can be used to intuitively determine whether the current market trend belongs to a trend market or a volatile market. And enter the market according to the indicator arrows, with green arrows indicating buy and red arrows indicating
An indicator of pattern #31 ("Long Island") from Encyclopedia of Chart Patterns by Thomas N. Bulkowski. The second gap is in the opposite direction. Parameters: Alerts - show alert when an arrow appears   Push - send a push notification when an arrow appears (requires configuration in the terminal) GapSize - minimum gap size in points ArrowType - a symbol from 1 to 17 ArrowVShift - vertical shift of arrows in points   ShowLevels - show levels ColUp - color of an upward line ColDn - color of
Indicador de Forex "Patrón Morning Star" para MT4 El indicador "Patrón Morning Star" es un indicador muy potente para operar con Price Action: no se repite el proceso ni se producen retrasos; El indicador detecta patrones Morning Star alcistas en el gráfico: señal de flecha azul en el gráfico (ver imágenes) Se incluyen alertas para PC, dispositivos móviles y correo electrónico También está disponible su hermano, el indicador bajista "Patrón Evening Star" (siga los enlaces a continuación) El i
For sure, this indicator has become very popular amongst traders. Through coding this indicator will give you the most accurate levels possible for your trading analysis. We have also added in the ability for you to receive alerts when the price breaks above or below a Support or Resistance lines! HOW TO USE The red rectangles represent your resistance/supply zone. The green rectangles represent your support/demand zone.  BONUS FEATURES We coded this indicator with the ability to switch between
Los compradores de este producto también adquieren
Trade Assistant MT4
Evgeniy Kravchenko
4.43 (180)
Ayuda a calcular el riesgo por operación, la fácil instalación de una nueva orden, gestión de órdenes con funciones de cierre parcial, trailing stop de 7 tipos y otras funciones útiles. Atención, la aplicación no funciona en el probador de estrategias. Manual, Description, Download demo Función de línea -   Muestra en el gráfico la línea de apertura, Stop Loss, Take Profit. Con esta función es fácil establecer una nueva orden y ver sus características adicionales antes de la apertura.   Gest
Bienvenido a Trade Manager EA: la herramienta definitiva de gestión de riesgos diseñada para hacer que el trading sea más intuitivo, preciso y eficiente. No es solo una herramienta para realizar órdenes; es una solución integral para la planificación de operaciones, gestión de posiciones y control del riesgo. Ya seas un principiante, un trader avanzado o un scalper que necesita ejecuciones rápidas, Trade Manager EA se adapta a tus necesidades, ofreciendo flexibilidad en todos los mercados, desde
Local Trade Copier EA MT4
Juvenille Emperor Limited
5 (83)
Experimente una copia de operaciones excepcionalmente rápida con Local Trade Copier EA MT4 . Con su fácil configuración de 1 minuto, este copiador de operaciones le permite copiar operaciones entre múltiples terminales de MetaTrader en la misma computadora con Windows o en Windows VPS con velocidades de copiado ultra rápidas de menos de 0.5 segundos. Ya seas un trader principiante o profesional, el Local Trade Copier EA MT4 ofrece una amplia gama de opciones para personalizarlo según tus necesi
Custom Alerts MT4
Daniel Stein
5 (1)
Custom Alerts es una herramienta versátil de monitorización multimercado que identifica configuraciones prometedoras en las ocho divisas principales (USD, CAD, GBP, EUR, CHF, JPY, AUD y NZD), así como en el ORO (XAU), en los 28 pares de Divisas y ORO basados en estas divisas, y hasta en siete índices como US30, UK100, WTI, Bitcoin, etc. Es totalmente personalizable. La herramienta recopila datos de nuestros indicadores FX Power, FX Volume e IX Power y le notifica los eventos significativos.  
Exp COPYLOT CLIENT for MT4
Vladislav Andruschenko
4.69 (62)
Copiadora comercial para MetaTrader 4. Copia operaciones de forex, posiciones, pedidos de cualquier cuenta. Es una de las mejores copiadoras comerciales   MT4 - MT4, MT5 - MT4 para la versión  COPYLOT MT4  (o MT4 - MT5 MT5 - MT5 para la versión COPYLOT MT5 ). Versión MT 5 Descripción completa +DEMO +PDF Cómo comprar Cómo instalar    Cómo obtener archivos de registro    Cómo probar y optimizar    Todos los productos de Expforex Versión copiadora para  MetaTrader 5 terminal (МТ5 - МТ5, МТ4 -
Trade Dashboard MT4
Fatemeh Ameri
5 (38)
Tired of complex order placement and manual calculations? Trade Dashboard is your solution. With its user-friendly interface, placing orders becomes effortless, by a single click, you can open trades, set stop loss and take profit levels, manage trade lot size, and calculate risk to reward ratios, allowing you to only focus on your strategy. Say goodbye to manual calculations and streamline your trading experience with Trade Dashboard. Download  Demo Version  right now. You can find  Details
The product will copy all telegram signal to MT4   ( which you are member  ) , also it can work as remote copier.  Easy to set up, copy order instant, can work with almost signal formats, image signal, s upport to translate other language to English Work with all type of channel or group, even channel have "Restrict Saving Content", work with  multi channel, multi MT5 Work as remote copier: with signal have ticket number, it will copy exactly via ticket number. Support to backtest signal. How to
Mentfx Mmanage
Anton Jere Calmes
5 (15)
The added video will show you the full functionality, effectiveness, and simplicity of this trade manager. Drag and Drop Trade Manager. Draw your entry and have the tool calculate the rest. Advanced targeting and close portions of a trade directly available in tool (manage trades while you sleep). Market order or limit order on either side with factored spread. Just draw the entry, the tool does the rest. Hotkey setup to make it simple. Draw where you want to enter, and the stop loss, the tool c
Telegram To MT4 Receiver
Levi Dane Benjamin
5 (3)
Copie señales de cualquier canal del que sea miembro (incluidos los privados y restringidos) directamente en su MT4.  Esta herramienta ha sido diseñada pensando en el usuario y ofrece muchas características que necesita para administrar y monitorear las operaciones. Este producto se presenta en una interfaz gráfica fácil de usar y visualmente atractiva. ¡Personalice su configuración y comience a usar el producto en minutos! Guía del usuario + Demo  | Versión MT5 | Versión Discord Si desea pro
Trade copier MT4
Alfiya Fazylova
4.52 (29)
Trade Copier es una utilidad profesional diseñada para copiar y sincronizar operaciones entre cuentas comerciales. La copia ocurre desde la cuenta / terminal del proveedor a la cuenta / terminal del destinatario, instalada en la misma computadora o vps. Antes de comprar, puede probar la versión de demostración en una cuenta de demostración. Versión de demostración aquí . Instrucciones completas aquí . Principales funcionalidades y beneficios: Admite la copia de MT4> MT4, MT4> MT5, MT5> MT4, incl
TradePanel MT4
Alfiya Fazylova
4.9 (86)
Trade Panel es un asistente comercial multifuncional. La aplicación contiene más de 50 funciones para el comercio manual y le permite automatizar la mayoría de las acciones comerciales. Antes de comprar, puede probar la versión demo en una cuenta de demostración. Demostración aquí . Instrucciones completas aquí . Comercio. Le permite realizar operaciones comerciales básicas con un solo clic: Apertura de órdenes y posiciones. Abrir una cuadrícula de órdenes. Cierre de órdenes y posiciones. Revers
El MT4 to Telegram Signal Provider es una herramienta fácil de usar y completamente personalizable que permite enviar señales a Telegram, transformando su cuenta en un proveedor de señales. El formato de los mensajes es completamente personalizable! Sin embargo, para un uso sencillo, también puede optar por una plantilla predefinida y habilitar o deshabilitar partes específicas del mensaje. [ Demo ]  [ Manual ] [ Versión MT5 ] [ Versión Discord ] [ Canal de Telegram ] Configuración Está dispo
Copia señales de cualquier canal del que seas miembro (   sin necesidad de un Token de Bot o Permisos de Administrador  directamente a tu MT4. Ha sido diseñado teniendo en cuenta al usuario mientras ofrece muchas características que necesitas Este producto se presenta en una interfaz gráfica fácil de usar y visualmente atractiva. ¡Personaliza tus ajustes y comienza a usar el producto en cuestión de minutos! Guía del usuario + Demo  | Versión MT5 | Versión Telegram Si quieres probar una demo,
Copiadora->Interfaz de interacción cómoda y rápida, los usuarios pueden usarla de inmediato       ->>>> Recomendado para usar en computadoras Windows o VPS Windows Características: Configuraciones de copy trading personalizadas y diversificadas: 1. Se pueden configurar diferentes modos de lote para diferentes fuentes de señal 2. Se pueden configurar diferentes fuentes de señal para copy trading hacia adelante y hacia atrás 3. Las señales se pueden configurar con comentarios 4. Si se debe calibr
Summer 40% discount ($149 -> $88) Everything for chart Technical Analysis indicator mt4 in one tool Draw your supply demand zone with rectangle and support resistance with trendline and get alerts to mobile phone or email alert -  Risk reward indicator Video tutorials, manuals, DEMO download   here .  Find contacts on my   profile . 1.   Extended rectangles and trendlines Object will be extended to the right edge of the chart when price will draw new candles on chart. This is rectangle extend
Equity Protection EA
CARLOS ALBERTO VALLOGGIA
5 (3)
Equity Protection EA Características generales: Control total sobre los resultados de un sesión de trading.- Controla el resultado global, para todos los símbolos de forex, índices, metales, acciones, etc. El control lo realiza sobre el equity global.- Cierre de todas las operaciones, en todos los símbolos, al alcanzar un porcentaje de ganancias o de perdidas.- Configuraciones modificables tanto en importe como en porcentajes.- Protección de los resultados mediante trailing stop global.- Regi
Asistente: Asistente comercial MT4 (haga clic para descargar) Asistente comercial MT5 (haga clic para descargar) Lea atentamente las instrucciones de uso. Lo esencial: Apertura y cierre rápido de posiciones, apertura y cierre de posiciones con un solo clic, colocación de órdenes con un solo clic Comercio de línea de dibujo Sl/tp automático Símbolos de cierre Ganancias protegidas Mover SL Protect SL de seguimiento Control de riesgo de la cuenta La sombra del orden Añadir pedidos automá
Tome el control de su cartera de divisas. ¡Vea instantáneamente dónde se encuentra, qué funciona y qué le causa dolor! VERSIÓN MT5 DISPONIBLE AQUÍ: https://www.mql5.com/en/market/product/58658 El Trade Manager Dashboard está diseñado para mostrarle de un vistazo dónde se encuentra actualmente cada posición que tiene en el mercado de divisas, y hacer que la gestión de riesgos y la exposición a las divisas sean más fáciles de entender. Para los comerciantes que escalan gradualmente en el mercad
Trade Manager MT4 DaneTrades
Levi Dane Benjamin
4.33 (9)
Trade Manager para ayudarle a entrar y salir rápidamente de operaciones mientras calcula automáticamente su riesgo. Incluye funciones que le ayudarán a evitar el exceso de operaciones, las operaciones de venganza y las operaciones emocionales. Las operaciones se pueden gestionar automáticamente y las métricas de rendimiento de la cuenta se pueden visualizar en un gráfico. Estas características hacen que este panel sea ideal para todos los operadores manuales y ayuda a mejorar la plataforma MetaT
MT4 To Notion
Levi Dane Benjamin
5 (2)
Este programa te permitirá exportar todas tus operaciones de tu cuenta de MetaTrader directamente a Notion utilizando una interfaz de usuario muy amigable.  Versión MT5  |  Guía del usuario + Demo Para empezar, utiliza la Guía del usuario y descarga la Plantilla de Notion. Si deseas una demostración, por favor consulta la Guía del usuario. ¡No funciona en el probador de estrategias! Características principales Exporta todas las operaciones de tu cuenta de trading a tu Notion Exporta las operacio
Layer Master Toolbox
Peter Andrew Thomas
5 (3)
GRID TRADING - Layer Master tool kit is the ultimate, easy to use trading toolkit makes it simple to layer grids of Orders over any entry level. This toolkit will make it simple and fast to Open / Enter and Manage your grid trades on MT4. Every function is simple - but clicking and dragging the order zone - you define an area you want your orders, then you can quickly drag the SL and TP levels to where you want them. Hit one button and your orders are sent!!!  Features: It is capable to send h
Grid Manual MT4
Alfiya Fazylova
4.72 (18)
Grid Manual es un panel de negociación para trabajar con una cuadrícula de órdenes. La utilidad es universal, tiene configuraciones flexibles y una interfaz intuitiva. Funciona con una cuadrícula de pedidos no solo en la dirección de promediar pérdidas, sino también en la dirección de aumentar las ganancias. El usuario no necesita crear y mantener una cuadrícula de pedidos, la utilidad lo hará. Basta con abrir un pedido y el "Grid manual" creará automáticamente una grilla de pedidos para el mism
Risk Manager for MT4
Sergey Batudayev
4.56 (9)
Expert Advisor Risk Manager para MT4 es un programa muy importante y, en mi opinión, necesario para todos los comerciantes. Con este Asesor Experto podrá controlar el riesgo en su cuenta de operaciones. El control de riesgos y beneficios puede realizarse tanto en términos monetarios como porcentuales. Para que el Asesor Experto funcione, simplemente adjúntelo al gráfico de pares de divisas y establezca los valores de riesgo aceptables en la divisa de depósito o en % del saldo actual. Func
CAP Strategy Builder EA
MEETALGO LLC
4.83 (30)
The top-selling EAs on the market cost a lot and one day they are suddenly gone. This is because one strategy will not work in the forex market all the time. Our product is unique from all others in the MQL Marketplace because our EA comes with 34+ built-in indicators that allow adding more strategies every time.  You build your strategy and keep updating it. If one strategy does not work, simply build another all using only one EA. This is All-In-One EA in this market place. You can use as trad
Ultimate No Nonsense FX Backtester - You can Run Forward Test Simulation with this tool! Do Not Download the Demo Here, Please Read Below! Step by Step Manual Guide PDF for this backtester PDF List of Commands(Shortcuts) for this backtester Ultimate NNFX Backtester is a powerful utility tool that significantly reduces the length of backtesting process for NNFX followers.  As well as for Forex traders that operates their entries and exits at the close of a candle and manage the risk using A
The product will copy all  Discord  signal   to MT4   ( which you are member  ) , also it can work as remote copier.  Easy to set up. Work with almost signal formats, support to translate other language to English Work with multi channel, multi MT4. Work with Image signal. Copy order instant, auto detect symbol. Work as remote copier: with signal have ticket number, it will copy exactly via ticket number. How to setup and guide: Let read all details about setup and download Discord To MetaTrade
Take a Break
Eric Emmrich
5 (26)
The most advanced news filter and drawdown limiter on MQL market NEW: Take a Break can be backtested against your account history! Check the " What's new " tab for details. Take a Break has evolved from a once simple news filter to a full-fledged account protection tool. It pauses any other EA during potentially unfavorable market conditions and will continue trading when the noise is over. Typical use cases: Stop trading during news/high volatility (+ close my trades before). Stop trading when
This tool will allow you to export MetaTrader indicators data (Buffers) for any financial instrument present in your MetaTrader 4. You can download multiple Symbols and Timeframes in the same csv file. Also, you can schedule the frequency of download (every minute, 5 minutes, 60 minutes, etc.). No need to open a lot of charts in order to get the last data, the tool will download the data directly. The CSV File will be stored in the folder:   \MQL4\Files . How it works Report Tab : Select
Trade Sync MT4
Anna Kolchina
5 (1)
« Trade Sync » — Really fast copying and precise synchronization of trades. Simple installation and configuration of the application within 5 seconds allows you to copy trades between different MetaTrader terminals installed on one Windows PC or Windows VPS at maximum speed. «Trade Sync» contains a large number of options for customizing the application to your specific needs and allows you to cope with even complex user tasks. Separate use: Trade Sync MT4 - allows you to copy (Мt4 > Мt4), Trade
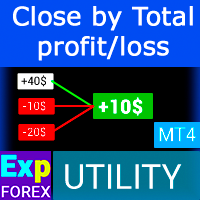
CloseIfProfitorLoss with Trailing
Vladislav Andruschenko
4.86 (28)
Cerrar posiciones en MetaTrader 4 al alcanzar la ganancia / pérdida total con la función de seguimiento de ganancias. Puede habilitar las paradas virtuales (orden separada) , Cálculo y cierre para posiciones de COMPRA y VENTA por separado (COMPRA VENTA separada) , Cerrar y calcular todos los símbolos o solo el símbolo actual (Todos los símbolos) , Habilitar trailing con fines de lucro ( Trailing Profit ) Cierre sobre las pérdidas y ganancias totales en la moneda de depósito, puntos, % del saldo
Otros productos de este autor
RSI divergence indicator finds divergences between price chart and   RSI   indicator and informs you with alerts (popup, mobile notification or email). Its main use is to find trend reversals in the chart. Always use the divergence indicators with other technical assets like support resistance zones, candlestick patterns and price action to have a higher possibility to find trend reversals. Three confirmation type for   RSI   divergences: RSI   line cross 50 level Price returns to previous H/L C
FREE
RSI Divergence Scanner is a multi-timeframe and multi-symbol dashboard and alert that checks all timeframes and symbols to find regular and hidden divergences between price chart and RSI indicator. This divergence scanner is integrated with support and resistance zones so you can check the RSI divergences in the most important areas of the chart to find trend reversals in price chart. Download demo version   (works on M4,M5,M6,M12,H3,H8 timeframes) Full description of scanner parameters ->   cli
25% off. Original price: $40 Stochastic Scanner is a multi symbol multi timeframe Stochastic dashboard that monitors the indicator for price entering and exiting overbought and oversold in up to 28 symbols and 9 timeframes. Download Demo here  (Scans only M1 and M5) Settings description   here MT5 version   here Stochastic Scanner features: Signals price entering and exiting the overbought and oversold zones. Monitors up to 28 customizable instruments and 9 timeframes at the same time. You
40% off. Original price: $50 Advanced Bollinger Bands Scanner is a multi symbol multi timeframe Bollinger bands dashboard that monitors and analyzes the Bollinger Bands indicator from one chart. This panel scans the Bollinger bands indicator in up to 28 configurable instruments and 9 timeframes for price overbought/oversold, price consolidation (Bollinger bands squeeze), and consolidation breakout (squeeze break)  with a deep scan feature to scan all market watch symbols (up to 1000 instrumen
MACD divergence indicator finds divergences between price chart and MACD indicator and informs you with alerts (popup, mobile notification or email) . Its main use is to find trend reversals in the chart. Always use the divergence indicators with other technical assets like support resistance zones, candlestick patterns and price action to have a higher possibility to find trend reversals. Three confirmation type for MACD divergences: MACD line cross zero level Price returns to previous H/L Crea
FREE
40% off. Original price: $50 Ichimoku Trend Finder is a multi symbol multi timeframe trend dashboard that helps traders to monitor and identify potential market trends from one chart. This panel scans the Ichimoku Kinko Hyo indicator in 28 configurable instruments and 9 timeframes for classic Ichimoku trend signals with a deep scan feature to scan all market watch symbols (up to 1000 instruments!).     Download Demo here  (Scans only M1 and M6) Settings description   here MT4 version   here
RSI Divergence Scanner is a multi-timeframe and multi-symbol dashboard and alert that checks all timeframes and symbols to find divergences between price chart and RSI indicator. This divergence scanner is integrated with support and resistance zones so you can check the RSI divergences in the most important areas of the chart to find trend reversals in the price chart. Download demo version   (works on M 1,M5,M30,W1 timeframes) Full description of scanner parameters ->   click here . How to get
RSI divergence indicator finds divergences between price chart and RSI   indicator and informs you with alerts (popup, mobile notification or email). Its main use is to find trend reversals in the chart. Always use the divergence indicators with other technical assets like support resistance zones, candlestick patterns and price action to have a higher possibility to find trend reversals. Three confirmation type for RSI   divergences: RSI   line cross 50 level (doesn't repaint) Price returns to
FREE
MACD Divergence Scanner is a multi-timeframe and multi-symbol dashboard and alert that checks all timeframes and symbols to find regular and hidden divergences between price chart and MACD indicator. This divergence scanner is integrated   with support and resistance zones so you can check the MACD divergences in the most important areas of the chart to find trend reversals in the price chart. Download demo version   (works on M4,M5,M6,M12,H3,H8 timeframes) Full description of scanner parameters
Ichimoku Trend Alert is the Ichimoku Kinko Hyo indicator with Alerts and signal filters. Ichimoku Trend Alert features: Optional check of Ichimoku cloud, Tenkan sen(Conversion Line), Kijun sen(Base Line), Senkou span A, Senkou span B, and Chikou span relative to price, and more. Popup, email, and phone notification alerts for selected symbols and timeframes. There are 9 classic Ichimoku trend filters you can enable/disable in settings: Price/Cloud Order:   Checks the price position relative
FREE
50% off. Original price: $60 Candlestick Pattern Scanner is a multi-timeframe and multi-symbol dashboard and alert system that checks all timeframes and currency pairs for different candlestick patterns that are formed in them. Scanner is integrated with support and resistance zones so you can check the candlestick patterns in the most important areas of the chart to find breakout and reversal patterns in the price chart. Download demo version   (works on M1,M5,M30,W1 timeframes) Read the full
Moving Average Trend Alert is a triple MA indicator that helps traders to identify potential market trends based on 3 MAs alignment and crossover. Moving Average Trend Alert features: Customizable short-term, medium-term, and long-term MAs. Option to filter signals based on a minimum distance between moving averages to avoid premature MAs alignment. Optional Filter of signals with RSI indicator overbought/oversold levels. Optional Filter of signals with ADX indicator. Popup, email, and phone n
FREE
40% off. Original price: $50 Moving Average Trend Scanner is a multi symbol multi timeframe triple MA crossover dashboard that helps traders to monitor, and identify potential market trends from one chart. This panel scans 3 moving averages in up to 28 configurable instruments and 9 timeframes for triple moving average alignment and moving average crossover  with a deep scan feature to scan all market watch symbols (up to 1000 instruments!). Download Demo here  (Scans only M1 and M5) Settin
40% off. Original price: $50 Support and Resistance Dashboard for MT5 is a multi-timeframe and multi-symbol scanner and alert system that finds S/R zones and pivot points for all timeframes and symbols and alerts when price has interaction with them. If you are using support and resistance (or supply and demand) zones in your trading strategy, this dashboard and its alert and filtering system is a big time saver for you. Download demo version   (works on M4,M5,M6,M12,H3,H8 timeframes) Full desc
40% off. Original price: $50 Moving Average Trend Scanner is a multi symbol multi timeframe triple MA crossover dashboard that helps traders to monitor, and identify potential market trends from one chart. This panel scans 3 moving averages in up to 28 configurable instruments and 9 timeframes for triple moving average alignment and moving average crossover with a deep scan feature to scan all market watch symbols (up to 1000 instruments!).   Download Demo   here   (Scans only M1 and M6) Sett
50% off. Original price: $60 Support and Resistance zones indicator for MT4 is a multi-timeframe panel and alert that finds support and resistance zones and pivot points for all timeframes of MetaTrader 4 and gives alert when price has interaction with them. Download demo version (works on GBPUSD, EURJPY and NZDUSD symbols) Read the full description of scanner parameters in the blog page . Many unique features in one indicator: Integrating support and resistance zones and pivot points in one
25% off. Original price: $40 RSI Scanner is a multi symbol multi timeframe RSI dashboard that monitors Relative Strength Index indicator for price entering and exiting overbought and oversold in up to 28 symbols and 9 timeframes. Download Demo here  (Scans only M1, M5 and M10) Settings description   here MT4 version   here RSI Scanner features: Signals RSI entering and exiting the overbought and oversold zones. Monitors 28 customizable instruments and 9 timeframes at the same time. Supports
50% off. Original price: $60 Ichimoku Assistant is a multi-timeframe panel and alert system that scans all timeframes for multiple rules related to different ichimoku strategies. The Ichimoku indicator has 5 different lines, including Tenkan-sen, Kijun-sen, Senku Span A, Senku Span B and Chikou Span. This scanner checks the status of these lines compared to each other and gives alerts based on your selected rules. If you are using ichimoku kinko hyo in your trading strategy, this scanner and it
MACD divergence indicator finds divergences between price chart and MACD indicator and informs you with alerts (popup, mobile notification or email). Its main use is to find trend reversals in the chart. Always use the divergence indicators with other technical assets like support resistance zones, candlestick patterns and price action to have a higher possibility to find trend reversals. Three confirmation type for MACD divergences: MACD line cross zero level Price returns to previous H/L Creat
FREE
50% off. Original price: $60 Candlestick Pattern Scanner is a multi-timeframe and multi-symbol dashboard and alert system that checks all timeframes and currency pairs for different candlestick patterns that are formed in them. Scanner is integrated   with support and resistance zones so you can check the candlestick patterns in most important areas of the chart to find breakout and reversal patterns in the price chart. Download demo version   (works on M4,M5,M6,M12,H3,H8 timeframes) Read the f
50% off. Original price: $60 Order Manager is a trade assistant and trade copier with a money manager that helps traders open, modify and close manual trades and also copy their trades between multiple accounts in the most simple way to help them focus more on their market analysis and open orders with just a few clicks. Download Demo here  (It only works on demo accounts) Full guide   here MT5 version here Order Manager features: Works on all instruments such as currency pairs, indexes, CF
Ichimoku Trend Alert is the Ichimoku Kinko Hyo indicator with Alerts and signal filters. Ichimoku Trend Alert features: Optional check of Ichimoku cloud, Tenkan sen(Conversion Line), Kijun sen(Base Line), Senkou span A, Senkou span B, and Chikou span relative to price, and more. Popup, email, and phone notification alerts for selected symbols and timeframes. There are 9 classic Ichimoku trend filters you can enable/disable in settings: Price/Cloud Order: Checks the price position relative to
FREE
50% off. Original price: $375 Reward Multiplier is a semi-automatic trade manager based on pyramid trading that opens additional orders with the running profit of your trades to maximize return exponentially without increasing the risk. Unlike other similar EAs, this tool shows potential profit/loss and reward to risk ratio before even entering the first trade! Download Demo here  (starting lot is fixed at 0.01) Guide + tips here MT5 version   here You only open the first order. When your
Moving Average Trend Alert is a triple MA indicator that helps traders to identify potential market trends based on 3 MAs alignment and crossover. Moving Average Trend Alert features: Customizable short-term, medium-term, and long-term MAs. Option to filter signals based on a minimum distance between moving averages to avoid premature MAs alignment. Optional Filter of signals with RSI indicator overbought/oversold levels. Optional Filter of signals with ADX indicator. Popup, email, and phone n
FREE
Reward Multiplier is a semi-automatic trade manager based on pyramid trading that opens additional orders with the running profit of your trades to maximize return exponentially without increasing the risk.Unlike other similar EAs, this tool shows potential profit/loss and reward to risk ratio before even entering the first trade! Download full version here  ( In the mini version. Starting lot is fixed at 0.01 (or minimum allowed lot size ) Guide + tips here MT4 version   here You only open the
FREE
Advanced Indicator Scanner is a multi-symbol multi-timeframe scanner that works with hundreds of custom indicators available across the web including mql5 website market and codebase indicators. Advanced Indicator Scanner features: Scans your indicator in 28 customizable instruments and 9 timeframes. Monitors up to 2 lines(buffers) of an indicator. Showing of indicator value on buttons. You can choose between 3 alert modes:  Single symbol and timeframe Multiple timeframes of a symbol Multipl
Reward Multiplier is a semi-automatic trade manager based on pyramid trading that opens additional orders with the running profit of your trades to maximize return exponentially without increasing the risk. Unlike other similar EAs, this tool shows potential profit/loss and reward to risk ratio before even entering the first trade! Download full version here  ( In the mini version. Starting lot is fixed at 0.01 (or minimum allowed lot size ) Guide + tips here MT5 version   here You only open the
FREE
50% off. Original price: $60 Triangle Finder is a multi symbol multi timeframe dashboard that monitors and finds symmetrical triangle pattern in 28 symbols and 9 timeframes with a deep scan feature to scan all market watch symbols (up to 1000 instruments!). Download Demo here  (Scans only M1 and M5) Settings description   here MT5 version   here Triangle Finder features: Realtime monitoring of 28 customizable instruments and 9 timeframes at the same time. Deep scan mode to scan all market w
25% off. Original price: $40 RSI Scanner is a multi symbol multi timeframe RSI dashboard that monitors Relative Strength Index indicator for price entering and exiting overbought and oversold in up to 28 symbols and 9 timeframes. Download Demo here  (Scans only M1 and M5) Settings description   here MT5 version   here RSI Scanner features: Signals RSI entering and exiting the overbought and oversold zones. Monitors 28 customizable instruments and 9 timeframes at the same time. You can choos
40% off. Original price: $50 ATR Scanner Pro is a multi symbol multi timeframe volatility scanner that monitors and analyzes Average True Range indicator value in up to 28 symbols and 9 timeframes in 3 modes : ATR value:   As a volatility dashboard it shows the ATR indicator value in all pairs and timeframes and signals when the ATR value reaches a maximum or minimum in a given duration. Short term ATR/Long term ATR ratio:  It shows ratio of 2 ATRs with different periods. It's useful in detec
Filtro:
No hay comentarios
Respuesta al comentario
Versión 5.0 2023.11.16
+ Dashboard shows if the price gets near to the S/R zones by changing the background color of related cell (near is based on the ATR value).
+ You can receive alerts when the price gets near to the S/R zones (near is based on the ATR value).
+ Minor bug fixes and improvements.
Versión 4.7 2023.11.02
+ Now dashboard can show the price distance to the upper and lower S/R zones and pivot levels (with "Show price distance to nearest S/R Levels" and "Show price distance to nearest Pivot Levels" parameters).
+ Minor improvements.
Versión 4.5 2023.05.09
+ Now the dashboard shows 6 near S/R zones (previously 4) in opened charts when you click on dashboard cells.
+ You can choose which type of price interaction with the S/R zones must be shown on the dashboard (entering, leaving, breaking or being inside the zone).
+ Dashboard optimization for receiving alert when “Every minute” parameter is active.
+ Now the dashboard can show the S/R zones and pivot lines on the new charts opened with custom template.
+ A parameter added to enable alerts for selected timeframes on startup of dashboard.
+ Improving the dashboard appearance.
+ Minor improvements and bug fixes.
Versión 4.0 2022.11.09
+ Pivot point lines and alerts (daily, weekly, and monthly) added to the dashboard.
+ Input parameters modified and updated.
Versión 3.1 2022.10.27
+ You can now choose when the scanner check for alerts: on timeframe candle close or on 1-minute candle close.
+ More informative alert messages.
Versión 3.0 2022.10.20
+ Now dashboard shows the near zones to price (and their name and price labels) when you click on any cell of the dashboard.
+ You can select to update the dashboard each minute or on timeframe candle close.
+ 2 more candle filters added to the dashboard: "Min. candle body to height ratio" and "Min. candle height to zone height ratio".
+ Now you can set different colors for different S/R zones.
+ You can select to show zones in the dashboards chart instead of opening a new chart when clicking on a dashboard cell (useful for wide screens).
+ Detection of broken zones optimized.
+ Now you can choose to disable finding the proven and verified zones (for those who want to work only with fresh zones).
+ "Weak" and "Untested" names for zones changed to more meaningful names "Weak fresh" and "Fresh".
+ 2 parameters "Fractal Fast Factor" and "Fractal Fast Factor" added for more compatibility with "Shved Supply and Demand" indicator.
+ Improvement in dashboard performance and minor improvements in different parts of dashboard.
Versión 2.0 2022.07.01
- Pagination added to the parameters, you can separate the market watch symbols in multiple dashboards.
- Panel shows the symbol and timeframe that is loading (on the header).
- The option “Split symbols in 2 columns” added to the parameters, now you can show more symbols in the dashboard on a single chart.
- Improvement in showing the S/R zones in charts that are opened by clicking on dashboard cells.
- Small bug fixes and performance improvement.