• Información general
  • Comentarios
  • Discusión

AIS Optimal TPSL

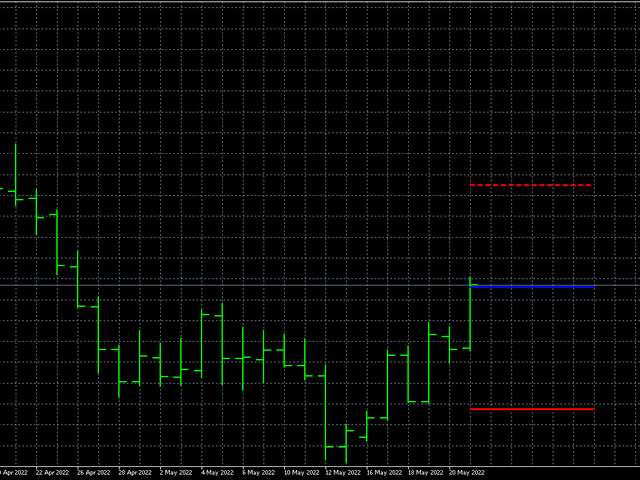
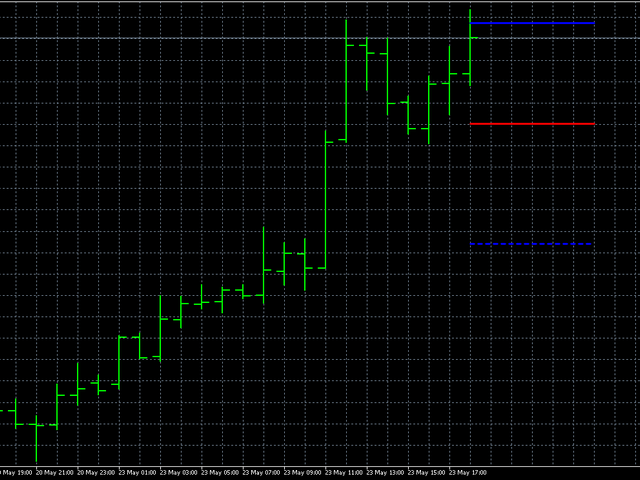
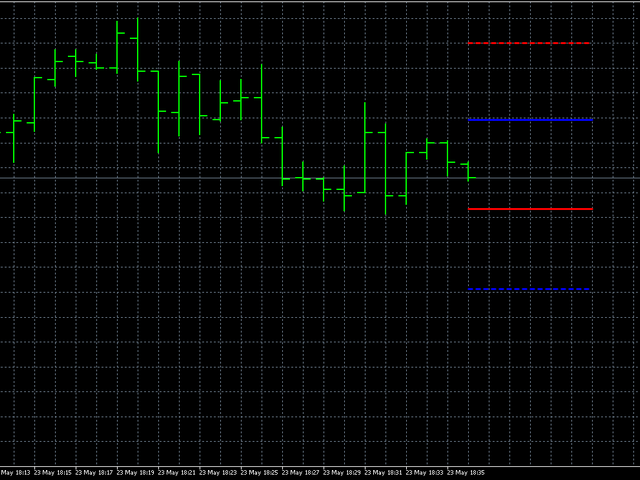
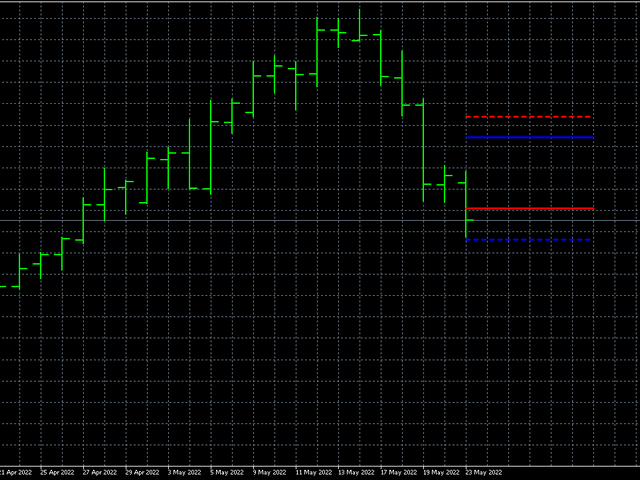
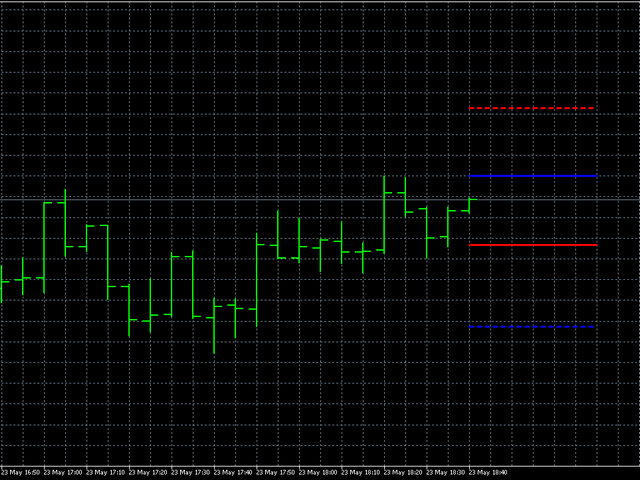
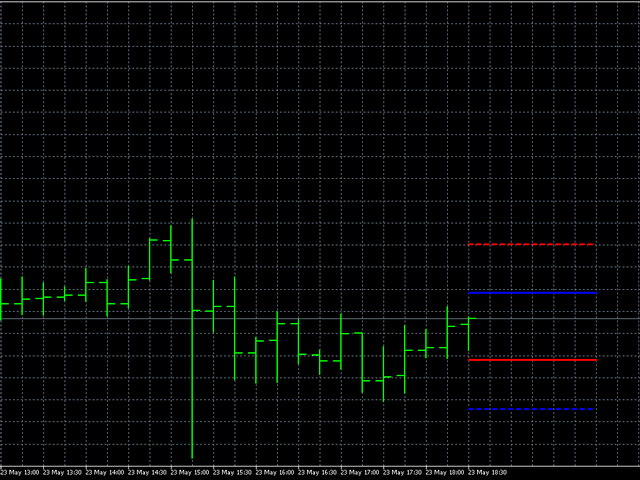
Este indicador muestra los niveles óptimos de toma de ganancias y stop loss. Estos niveles se calculan en base a datos históricos. En el primer inicio, el indicador se entrena en la historia. Después de eso, evalúa la probabilidad de que el precio supere este o aquel nivel en el futuro y selecciona las opciones más óptimas para colocar órdenes stop. Por ejemplo, los valores de Take Profit se seleccionan para que la ganancia sea máxima y la probabilidad de que el precio alcance su nivel sea la más alta posible. El nivel de stop loss debe ser mínimo, pero la probabilidad de alcanzarlo debe ser mínima. Esto da como resultado niveles con la expectativa matemática más alta posible de ganar.
Además, este indicador se puede utilizar en forma de niveles de soporte y resistencia. Para hacer esto, puede combinar diferentes longitudes y compensaciones de pronóstico.
Parámetros del indicador:
  • Duración: duración prevista. Este parámetro indica la duración esperada del comercio futuro en barras.
  • Shift - cambio en barras. Gracias a este parámetro, puede ver las lecturas del indicador en el pasado.
  • Ancho - ancho de línea.
  • ClrBuy: color de línea para las posiciones de compra.
  • ClrSell: color de línea para posiciones de venta.
  • StyleTP: estilo de línea para obtener ganancias.
  • StyleSL: estilo de línea para detener las pérdidas.
  • Información: cuando esta opción está habilitada, los valores de stop loss y take profit se mostrarán en la pestaña "Expertos" de la terminal.
Productos recomendados
Indicator of fractals with adjustable indents. Designed according to an original simplified algorithm for use in EA. The main ones in the indicator are lines showing the levels of the current fractals, which allows you to read the values ​ ​ of the last fractal in one operation. It works on a closed bar, so it does not redraw and does not load the terminal with calculations. It should be understood that the indicator is late with the detection of the fractal by the number of bars on the r
Galactic Volume spread analysis (VSA), es un indicador diseñado para la visualización del Volumen,y la proporción en la que afecta la volatilidad del spread de los diferentes pares.  La estrategia consiste en lo siguiente: Tendencia alcista:  Siempre yendo a favor de la tendencia, aperturar operaciones de compra en los mínimos de la tendencia, siempre que coincida con un alto volumen mostrado por el indicador Galactic VSA. Tendencia bajista:  Siempre yendo a favor de la tendencia, aperturar
The Advanced Bands Squeeze indicator is a custom indicator based on the classic Bollinger Bands as created by John Bollinger. The Bollinger Band Squeeze occurs when volatility falls to low levels and the Bollinger Bands narrow. This low volatility level is called a “Squeeze”.  According to John Bollinger, periods of low volatility are often followed by periods of high volatility, where prices tend to move a lot in either direction. Therefore, a volatility contraction or narrowing of the bands
Mr Beast Paterns with alerts
Luis Mariano Vazquez Marcos
El indicador "MR BEAST PATTERNS WITH ALERTS" es una herramienta avanzada diseñada para identificar y notificar automáticamente patrones de oportunidad en el mercado financiero. Basándose en una combinación de análisis técnico y algoritmos inteligentes, este indicador escanea constantemente el gráfico en busca de patrones específicos que podrían indicar momentos propicios para la toma de decisiones. Características Principales: Detección de Patrones: El indicador identifica patrones de oportunida
SRP Pro
Farhad Kia
5 (1)
Strong Retracement Points Pro edition! SRP (Strong Retracement/Reversal Points) is a powerful and unique support and resistance indicator. It displays the closest important levels which we expect the price retracement/reversal! If all level are broken from one side, it recalculates and draws new support and resistance levels, so the levels might be valid for several days depending on the market! If you are still hesitating to start using this wonderful tool, you can check this link to see how ef
AutoTraderEA Description As the name says, this is an autotrading robot.   It trades on H1 timeframe.  It looks for clear trades, and is very accurate, yet still will take a couple of trades per week. Otherwise losses are minimised through a 130 pip StopLoss which can be modified. AutoTrader gives the user the ability to choose whether to keep trading volumes the same or change in direct proportion to the change in the account equity.   The EA has been backtested only on the EURUSD pair over a
Market Structure Zig Zag
Lesedi Oliver Seilane
4.8 (25)
Free Market structure zig zag to assist in price action trading the screenshots describe how to use and how to spot patterns new version comes with alerts, email alert and  push notification alert can be used on all pairs  can be used on all timeframes  you can add additional confirmation indicators the indicator shows you your higher high and low highs as well as your lower lows and lower highs  the indication makes price action analysis easier to spot.
FREE
Chart Patterns Detect 15 patterns (Ascending Triangle, Descending Triangle, Rising Wedge, Falling Wedge, Bullish Flag, Bearish Flag, Bullish Rectangle, Bearish Rectangle Symmetrical triangle, Head and Shoulders, Inverted Head and Shoulders, Triple top, Triple Bottom, Double Top, Double Bottom) Use historical data to calculate the probability of each pattern to succeed (possibility to filter notification according to the chance of success) gives graphic indication about the invalidation level and
Strength and weakness of currencies : Shows the currency status at any time, values between 50 and -50 are neutral, everything outside indicates a trend change  Waves : Current state of waves, daily, weekly monthly and yearly Recommended volume for trading a specific number of waves Yearly High Low Drawn waves on which the market will react in advance, without redrawing Yearly candle with bonus levels used to display deviations  For more info contact me
Signal Alien
Vitalii Zakharuk
Signal Alien is a handy tool if you are used to trading on a clean chart, but sometimes you need to take a look at this indicator. That is, everything is as simple as possible, positions are closed in the opposite way, that is, as soon as a signal is received to open an order in the direction opposite to your position. For example, you opened a long position (sell), close it when a red arrow appears pointing down. If you are not sure how to determine the inflection point of the trend and are
Introduction to Chart Pattern MT Chart Pattern MT is a chart pattern scanner to detect the triangle pattern, falling wedge pattern, rising wedge pattern, channel pattern and so on. Chart Pattern MT uses highly sophisticated chart pattern detection algorithm. However, we have designed it in the easy to use with intuitive user interface. Chart Pattern MT will show all the patterns in your chart in the most efficient format for your trading. You do not have to do tedious manual pattern detection an
Fear and Greed MT4
Diego Arribas Lopez
MT5 Version Indicador Miedo y Codicia MT4 Dudas a la hora de tomar la decisión de realizar ganacias totales o comenzar a realizar ganancias parciales?  Fear and Greed MT4 proporciona una gran ayuda con un alto nivel de fiabilidad a la hora de tomar dichas decisiones. PRUEBALO GRATIS AHORA! Fear and Greed MT4 es el primer indicador que ofrece información sobre el estado de Miedo y Codicia en el mercado para MT4. Ha sido desarrollado para facilitar la toma de decisiones a la hora de la entrada y
GMMA Trade X is an EA based on GMMA. GMMA parameters such as MovingAveragePeriod1-24, MovingAverageMAShift1-24, MovingAverageShift1-24 and CandlestickShift1-24 can be adjusted. GMMA Trade X applies BTN TECHNOLOGY's state-of-the-art intelligent technology to help you create optimal results for your trades. May your dreams come true through GMMA Trade X. Good luck. = == == Inquiries = == == E-Mail:support@btntechfx.com
Nasdaq 1HPro
Premkumar Gunapati Munirathnam
Hi Friends the BOT for exactly for NASDAQ -1Hr ,30 Min & 15 Min and can try for other currencies by changing the multiplication factor 10. New  Position trading strategy Long term profit Minimal drawdown Reliable profit factor.  Orders Selection based on your equity Please run with optimization as  attached settings with your broker and choose the best parameter for live trading. However please find the recommended settings which you can run with demo account for testing for 30 Min & 1 hour char
The Extreme point indicator helps in determining the probable price reversal points on the chart. The indicator facilitates the search for points to enter the market with greater accuracy. The indicator displays certain impulses, after which there is a high probability of the price continuing its movement in the same direction. The indicator can be used in conjunction with other indicators for a more accurate detection of the position entry points. The indicator can also be used independently. F
Black series MT4
Dmitriy Kashevich
1 (1)
Black series MT4 - The indicator is designed for trading on binary options with Timeframe M1-M5-M15 Multicurrency (Works on cryptocurrency and currency pairs) The signal appears when the candle opens Up to 90% correct signals There is no signal redrawing at all Can be used with other indicators. Good for scalping! In Settings there is: -Indicator working methods -I Allert Arrow color Red signal down Blue signal up Also watch the video how the indicator works and signals
PABT Pattern Indicator - it's classical system one of the signal patterns. Indicator logic - the Hi & Lo of the bar is fully within the range of the preceding bar, look to trade them as pullback in trend. In the way if indicator found PABT pattern it's drawing two lines and arrow what showing trend way.  - First line - it's entry point and drawing at: 1. On the high of signal bar or on middle of the signal bar (depending from indicator mode) for buy; 2. On the low of signal bar or on middle of t
VR Cub
Vladimir Pastushak
VR Cub es un indicador para obtener puntos de entrada de alta calidad. El indicador fue desarrollado para facilitar los cálculos matemáticos y simplificar la búsqueda de puntos de entrada a una posición. La estrategia comercial para la cual se diseñó el indicador ha demostrado su eficacia durante muchos años. La simplicidad de la estrategia comercial es su gran ventaja, que permite que incluso los operadores novatos negocien con éxito con ella. VR Cub calcula los puntos de apertura de posiciones
ECM Channel MT4
Paulo Rocha
5 (1)
ECM Elite Channel is a volatility-based indicator, developed with a specific time algorithm, which consists of finding possible corrections in the market. This indicator shows two outer lines, an inner line (retracement line) and an arrow sign, where the channel theory is to help identify overbought and oversold conditions in the market. The market price will generally fall between the boundaries of the channel. If prices touch or move outside the channel, it's a trading opportunity. The
Pip Titan
Maydilu Isidra Hart
PipTitan is a state-of-the-art Expert Advisor (EA) designed for MetaTrader 4, meticulously crafted to enhance your trading performance with precision and reliability. Harnessing the power of advanced technical analysis and automated trading strategies, PipTitan takes your trading to the next level with its robust features and unparalleled accuracy. Key Features: Buy and Sell Sequences: Executes up to four buy and sell orders, each with specific conditions based on prior trade performance, ensu
This indicator Master XR indicator.Indicator displays trend movement. Indicator calculates automatically line. Features FiltPer - displays indicator period. deviation - displays indicator deviation. deviation2 - displays indicator deviation. How to understand the status: If (Timeframe M1-H1) FiltPer = 100; If ( Timeframe H4-MN) FiltPer = 5-20; ////////////////////////////////////////////////////////////////////////////////////////////////////////////////////////////////////////////////////// /
Owl smart levels
Sergey Ermolov
4.63 (54)
Versión MT5  |   FAQ El   Indicador Owl Smart Levels   es un sistema comercial completo dentro de un indicador que incluye herramientas de análisis de mercado tan populares como   los fractales avanzados de Bill Williams , Valable ZigZag que construye   la estructura de onda correcta   del mercado y   los niveles de Fibonacci   que marcan los niveles exactos de entrada. en el mercado y lugares para tomar ganancias. Descripción detallada de la estrategia Instrucciones para trabajar con el indi
Indicator from the Real Non RePaint MultiTimeFrame   (Real NRP MTF)  series. The indicator is based on the standard one. Does not redraw in any mode: the last closed candle is a rock. Does not look into the future for history at the senior TF. The formula for sensitivity enhancement has been changed (disabled in settings). It works on the current TF or older ones with the display on the current one. The last closed Heiken Ashi candle of the current timeframe before the opening of the new senior
ATR Channel Multiframe
Dmitriy Susloparov
5 (1)
This is a fully multitimeframe version of the ATR Channel standard indicator, which works for any combination of timeframes. The indicator allows viewing price channels from different timeframes in one window, and they will always be displayed in a correct time scale. You can create and set of intervals and freely switch to a higher or lower one. Please note: in the " From Median Price " display mode, it is easy to identify reversal points at intersections of levels from higher timeframes by lev
PROMO: SPEND MORE TIME WITH YOUR FAMILY. ENJOY LIFE… DO NOTHING. We would like to share our coding skills to fellow traders and most especially to people from all walks of life to have the opportunity to trade or invest using auto-trading way to provide other source of income while letting the robot and your money works for you.  Recommendations: Timeframe:   H1 (Any Timeframe) Supported currency pairs:   EURUSD , EURCHF,   USDCAD, AUDCAD, EURAUD and many more except *** JPY*** Pairs ...
Turtle Scalper Pro
Michela Russo
4.81 (27)
Turtle Scalper Pro is a trading robot  for the trading on forex. This is a mix of Trend Following and Counter Trend system.   Backtest Now! This Expert advisor not use   arbitrage, grid, martingale or other dangerous strategy , All Trades are covered by StopLoss and TakeProfit . Important Information Revealed By  purchasing  this Expert Advisor you are entitled  to receive a free copy  of   Spider Crazy Pro ! (All future updates included) -> To Receive it, Please Contact me by   mql5 message  
PZ Trend Trading
PZ TRADING SLU
4.8 (5)
Trend Trading es un indicador diseñado para sacar el máximo provecho posible de las tendencias que tienen lugar en el mercado, mediante el cronometraje de retrocesos y rupturas. Encuentra oportunidades comerciales al analizar qué está haciendo el precio durante las tendencias establecidas. [ Guía de instalación | Guía de actualización | Solución de problemas | FAQ | Todos los productos ] Opere en los mercados financieros con confianza y eficiencia Aproveche las tendencias establecidas sin s
Smart Moving Averages Indicator Smart Moving Averages is an exclusive indicator for Metatrader platform. Instead of calculating moving averages for the selected chart time frame, the Smart Moving Averages indicator gives you the opportunity to calculate moving averages independently from the chart time frame. For instance you can display a 200 days moving average in a H1 chart. Inputs of the indicator are: Timeframe : timeframe to be used for the calculation of the moving average Perio
An Ultimate Tool  for quick and efficient market analysis. Unique combination of solid indicators defining market direction for trend tracking and filtration designed for you to stay on the  right  side of the market. Market Rider Tools   gives you access to one of the most used from professional trades indicators on worldwide, which were not build in for MT4 and MT5 terminals . These are unique non-repainting indicators designed to be used on all time frames for all instruments classes: Fore
Rebecca
Vitalii Zakharuk
The expert system Rebecca goes through the whole history and can work with a currency pair (USDCAD) with a single setting. The Expert Advisor can be launched on any hourly period, but it works with the H1 period. You can start using it with $ 100 and 0.01 lot. Recommended 1000 $. It is necessary to test the bot both on all ticks and in any other mode, the opening prices are also suitable. Rebecca bot, works using the Mockingbird indicator. Work only with the USDCAD currency pair, period H1. T
Los compradores de este producto también adquieren
Gold Stuff
Vasiliy Strukov
4.89 (265)
Gold Stuff: un indicador de tendencia diseñado específicamente para el oro, también se puede usar en cualquier instrumento financiero. El indicador no se vuelve a dibujar ni se retrasa. El marco de tiempo recomendado es H1. Este indicador está escrito por EA Gold Stuff Advisor, puede encontrarlo en mi perfil.  Puede obtener una copia gratuita de nuestro indicador Strong Support y Trend Scanner, por favor envíe un mensaje privado. ¡a mí! IMPORTANTE! Póngase en contacto conmigo inmediatamente d
Scalper Inside PRO
Alexey Minkov
4.75 (59)
An exclusive indicator that utilizes an innovative algorithm to swiftly and accurately determine the market trend. The indicator automatically calculates opening, closing, and profit levels, providing detailed trading statistics. With these features, you can choose the most appropriate trading instrument for the current market conditions. Additionally, you can easily integrate your own arrow indicators into Scalper Inside Pro to quickly evaluate their statistics and profitability. Scalper Inside
TPSpro RFI Levels
Roman Podpora
4.86 (21)
Reversal First Impulse levels (RFI)    INSTRUCTIONS        RUS       -       ENG              R ecommended to use with an indicator   -   TPSpro  TREND PRO -  Version MT5 A key element in trading is zones or levels from which decisions to buy or sell a trading instrument are made. Despite attempts by major players to conceal their presence in the market, they inevitably leave traces. Our task was to learn how to identify these traces and interpret them correctly. Main functions: Displaying activ
Atomic Analyst
Issam Kassas
5 (3)
En primer lugar, vale la pena enfatizar que este Indicador de Trading no repinta, no redibuja y no se retrasa, lo que lo hace ideal tanto para el trading manual como para el automatizado. Manual del usuario: configuraciones, entradas y estrategia. El Analista Atómico es un Indicador de Acción del Precio PA que utiliza la fuerza y el impulso del precio para encontrar una mejor ventaja en el mercado. Equipado con filtros avanzados que ayudan a eliminar ruidos y señales falsas, y aumentan el poten
GOLD Impulse with Alert
Bernhard Schweigert
4.56 (9)
Este indicador es una super combinación de nuestros 2 productos Advanced Currency IMPULSE with ALERT  +   Currency Strength Exotics . ¡Funciona para todos los marcos de tiempo y muestra gráficamente el impulso de fuerza o debilidad para las 8 divisas principales más un Símbolo! Este Indicador está especializado en mostrar la aceleración de la fuerza de la divisa para cualquier símbolo como Oro, Pares Exóticos, Materias Primas, Índices o Futuros. Es el primero de su clase, cualquier símbol
Quantum Breakout Indicator PRO
Bogdan Ion Puscasu
4.96 (26)
Introduciendo       Quantum Breakout PRO   , el innovador indicador MQL5 que está transformando la forma en que comercia con Breakout Zones. Desarrollado por un equipo de operadores experimentados con experiencia comercial de más de 13 años,   Quantum Breakout PRO   está diseñado para impulsar su viaje comercial a nuevas alturas con su innovadora y dinámica estrategia de zona de ruptura. El indicador de ruptura cuántica le dará flechas de señal en las zonas de ruptura con 5 zonas objetivo de
Cycle Sniper
Elmira Memish
4.41 (37)
NEW YEAR SALE PRICE FOR LIMITED TIME!!! Please contact us after your purchase and we will send you the complimentary indicators to complete the system Cycle Sniper is not a holy grail but when you use it in a system which is explained in the videos, you will feel the difference. If you are not willing to focus on the charts designed with Cycle Sniper and other free tools we provide, we recommend not buying this indicator. We recommend watching the videos about the indiactor and system before pu
¡Actualmente 20% OFF ! ¡La mejor solución para cualquier novato o trader experto! Este software funciona con 28 pares de divisas. Se basa en 2 de nuestros principales indicadores (Advanced Currency Strength 28 y Advanced Currency Impulse). Proporciona una gran visión general de todo el mercado de divisas. Muestra los valores de Advanced Currency Strength, la velocidad de movimiento de las divisas y las señales para 28 pares de divisas en todos los (9) marcos temporales. Imagine cómo mejorar
Indicator : RealValueIndicator Description : RealValueIndicator is a powerful tool designed specifically for trading on the EURUSD pair. This indicator analyzes all EUR and USD pairs, calculates their real currency strength values, and displays them as a single realistic value to give you a head start on price. This indicator will tell you moves before they happen if you use it right. RealValueIndicator allows you to get a quick and accurate overview of the EURUSD currency pair tops and bottoms,
TPSproTREND PrO
Roman Podpora
4.78 (18)
TPSpro TRENDPRO  - is a trend indicator that automatically analyzes the market and provides information about the trend and each of its changes, as well as giving signals for entering trades without redrawing! The indicator uses each candle, analyzing them separately. referring to different impulses - up or down impulse. Exact entry points into transactions for currencies, crypto, metals, stocks, indices!  -  Version MT5               DETAILED DESCRIPTION                R ecommended to use with
Introduciendo       Indicador Quantum Trend Sniper   , el innovador indicador MQL5 que está transformando la forma en que identificas y negocias los cambios de tendencia. Desarrollado por un equipo de comerciantes experimentados con experiencia comercial de más de 13 años,       Indicador de francotirador de tendencia cuántica       está diseñado para impulsar su viaje comercial a nuevas alturas con su forma innovadora de identificar cambios de tendencia con una precisión extremadamente alta.
JULY OFFER 80% OFF next price for unlimited version will be 17000$. This is the only time you can get this institutional and professional indicator at this price for unlimited version. Don't dare to miss this. The tool I am about to introduce to you you can't compare it with other tools due to its strategy and accuracy level in predicting the next price directional movement . This tool is designed for serious traders who have decided to make a difference through trading. Be the next person to wi
TrendMaestro
Stefano Frisetti
5 (3)
note: this indicator is for METATRADER4, if you want the version for METATRADER5 this is the link:  https://www.mql5.com/it/market/product/108106 TRENDMAESTRO ver 2.4 TRENDMAESTRO recognizes a new TREND in the bud, he never makes mistakes. The certainty of identifying a new TREND is priceless. DESCRIPTION TRENDMAESTRO identifies a new TREND in the bud, this indicator examines the volatility, volumes and momentum to identify the moment in which there is an explosion of one or more of these data a
FX Volume
Daniel Stein
4.61 (36)
Obtenga su actualización diaria del mercado con detalles y capturas de pantalla a través de nuestro Morning Briefing aquí en mql5 y en Telegram ! FX Volume es el PRIMER y ÚNICO indicador de volumen que proporciona una visión REAL del sentimiento del mercado desde el punto de vista de un bróker. Proporciona una visión impresionante de cómo los participantes institucionales del mercado, como los brokers, están posicionados en el mercado Forex, mucho más rápido que los informes COT. Ver esta info
NAM Order Blocks
NAM TECH GROUP, CORP.
5 (1)
Indicador de detección de Order Blocks multitimeframe para MT4. Características - Panel de control totalmente personalizable, proporciona una interacción completa. - Oculta y muestra el panel de control donde quieras. - Detecta OB en múltiples marcos de tiempo. - Permite seleccionar la cantidad de OB para mostrar. - Interfaz de usuario de diferentes OBs. - Diferentes filtros de OBs (regulares, rejection y sin capitalizar). - Alerta de proximidad de OBs. - Líneas ADR High y Low. - Servicio de not
Entry Points Pro
Yury Orlov
4.7 (226)
Este es un genial indicador para MT4 que ofrece señales precisas para entrar en una transacción sin redibujar. Se puede aplicar a cualquier activo financiero: fórex, criptomonedas, metales, acciones, índices. Nos dará valoraciones bastante precisas y nos dirá cuándo es mejor abrir y cerra una transacción. Eche un vistazo  al vídeo  (6:22), ¡contiene un ejemplo de procesamiento de una sola señal que ha amortizado el indicador! La mayoría de los tráders mejoran sus resultados comerciales durante l
AT Forex Indicator MT4
Marzena Maria Szmit
5 (2)
The AT Forex Indicator MT4 is a sophisticated trading tool designed to provide traders with a comprehensive analysis of multiple currency pairs. This   powerful indicator   simplifies the complex nature of the forex market, making it accessible for both novice and experienced traders. AT Forex Indicator uses   advanced algorithms   to detect trends, patterns and is an essential tool for traders aiming to enhance their forex trading performance. With its robust features, ease of use, and reliabl
RelicusRoad Pro
Relicus LLC
4.73 (140)
Ahora $ 147 (aumentando a $ 499 después de algunas actualizaciones) - Cuentas ilimitadas (PC o Mac) Manual de usuario de RelicusRoad + Videos de capacitación + Acceso al grupo privado de Discord + Estado VIP UNA NUEVA MANERA DE VER EL MERCADO RelicusRoad es el indicador comercial más poderoso del mundo para divisas, futuros, criptomonedas, acciones e índices, y brinda a los comerciantes toda la información y las herramientas que necesitan para mantenerse rentables. Brindamos análisis téc
MTF Supply Demand Zones
Georgios Kalomoiropoulos
4.83 (23)
Próxima generación de zonas de oferta y demanda automatizadas. Algoritmo nuevo e innovador que funciona en cualquier gráfico. Todas las zonas se crean dinámicamente de acuerdo con la acción del precio del mercado. DOS TIPOS DE ALERTAS --> 1)CUANDO EL PRECIO LLEGA A UNA ZONA 2)CUANDO SE FORMA UNA NUEVA ZONA No obtienes un indicador inútil más. Obtiene una estrategia comercial completa con resultados probados.     Nuevas características:     Alertas cuando el precio llega a la z
ZeusArrow Smart Liquidity Finder  Smart Liquidity Finder is Ai controlled indicator based on the Idea of Your SL is My Entry. It scan and draws the major Liquidity areas on chart partitioning them with Premium and Discount Zone and allows you find the best possible trading setups and help you decide the perfect entry price to avoid getting your Stop Loss hunted . Now no more confusion about when to enter and where to enter. Benefit from this one of it's kind trading tool powered by Ai an trade
Welcome to the world of SMC (Smart Money Concepts) Trading, where we empower traders with the tools and knowledge to make smarter trading decisions. Our latest addition to our suite of trading tools is the SMC Trading Pro indicator, version 1.0. Key Features: Major Market Structure Identification with BODY break. Order Block must be in Major Swing ( not Small Swing ). Order Block with Fair Value Gap Detection. Order Block in Discount | Premium zone. Filter for only Bullish, Bearish or All Order
A. ¿Qué es A2SR ?   * Es un indicador técnico líder (sin repintado, sin retraso). -- Guía : -- en https://www.mql5.com/en/blogs/post/734748/page4#comment_16532516 -- y https://www.mql5.com/en/users/yohana/blog A2SR tiene una técnica especial para determinar los niveles de Soporte (demanda) y Resistencia (oferta). A diferencia de la forma ordinaria que vimos en la red, A2SR tiene un concepto original para determinar los niveles reales de SR. La técnica original no se tomó de Internet y tampoco
¡¡ACTUALMENTE 26% DE DESCUENTO !! Este indicador es una super combinación de nuestros dos indicadores principales ( Advanced Currency Strength 28   &  Advanced Currency IMPULSE with ALERT ). Muestra los valores de la Fuerza de la Divisa para TICK-UNIDADES y señales de alerta para 28 pares de divisas. Se pueden utilizar 11 Tick-Units diferentes. Son 1, 2, 3, 4, 5, 6, 10, 12, 15, 20 y 30 segundos. La barra de Tick-Unit en la sub-ventana se mostrará y se desplazará hacia la izquierda cuando haya
This indicator uses support and resistance, volume and some special formula to calculate the volume to filter the candles. If the volume reaches a specific value, And at the same time, Candle breaks the support/resistance line, There would be a signal and we can enter the market. Signals appear when the current candle closes. then you can enter the trade when a new candle appears. Please don't forget to follow your money management plan. MT5 Version Support/Resistance Breakout MT5 :   https:
Volume by Price MT4
Brian Collard
4.71 (14)
The Volumebyprice.com Indicator for MetaTrader 4 features Volume Profile and Market Profile TPO (Time Price Opportunity). Volume and TPO histogram bar and line charts. Volume Footprint charts. TPO letter and block marker collapsed and split structure charts. Static, dynamic and flexible range segmentation and compositing methods with relative and absolute visualizations. Session hours filtering and segment concatenation with Market Watch and custom user specifications. Graphical layering, posit
Beast Super Signal
Dustin Vlok
4.76 (101)
¿Está buscando un potente indicador de compraventa de divisas que pueda ayudarlo a identificar oportunidades comerciales rentables con facilidad? No busque más allá de Beast Super Signal. Este indicador basado en tendencias fácil de usar monitorea continuamente las condiciones del mercado, buscando nuevas tendencias en desarrollo o saltando sobre las existentes. Beast Super Signal da una señal de compra o venta cuando todas las estrategias internas se alinean y están en 100% de confluencia entr
FxBears Powers
Rachid Lafhil
3 (2)
️️ Attention:      The price will soon be raised to what it was before ($500).      No more losses with this indicator, test it for years ago and see if there is losses in one day results. but before testing it please see the explaining video down here.    FxBears Powers is working on all forex pairs, metals, commodities, futures, indices, energies, crypto, and everything...and on all timeframes from M1 to MN.   It's based on supply and demand zones, price action, and some internal indicators,
30% DISCOUNT ! DISCOUNT ! DISCOUNT ONLY FOR 5 USERS at125$ valid for 1 day only.Grab it The PERFECT TREND HIT creates   BUY and SELL  perfect trend   arrow signals based on ADX EMA AND RSI And all filters inbuilt with accurate trend entries. Furthermore, the indicator and template display the trend direction, strength, and trade recommendation for independent price charts. ROCK WITH THE TREND Moreover, it shows the final trade recommendation to BUY or SELL with all filters and displays that info
Gold Channel is a volatility-based indicator, developed with a specific timing algorithm for the XAUUSD pair, which consists of finding possible corrections in the market. This indicator shows two outer lines, an inner line (retracement line) and an arrow sign, where the theory of the channel is to help identify overbought and oversold conditions in the market. The market price will generally fall between the boundaries of the channel. If prices touch or move outside the channel it is a tra
Currency Strength Exotics
Bernhard Schweigert
4.88 (33)
¡ACTUALMENTE 20% DE DESCUENTO ! ¡La mejor solución para cualquier operador novato o experto! Este indicador está especializado en mostrar la fuerza de la divisa para cualquier símbolo como Pares Exóticos, Materias Primas, Índices o Futuros. Es el primero de su clase, cualquier símbolo se puede añadir a la 9 ª línea para mostrar la verdadera fuerza de la moneda de Oro, Plata, Petróleo, DAX, US30, MXN, TRY, CNH etc. Se trata de una herramienta de trading única, de alta calidad y asequible por
Otros productos de este autor
AIS Money Management MT5
Aleksej Poljakov
5 (1)
El script se basa en la simulación de transacciones comerciales utilizando un generador de números aleatorios. Esto le permite obtener resultados completamente diferentes, incluso con los mismos parámetros de entrada. Cuando ejecuta el script, se abre un cuadro de diálogo en el que puede establecer los valores deseados para las variables externas. En el bloque,   TradingOptions   define los parámetros básicos que se necesitan para simular el comercio. StartBalance : establece el tamaño inicial
FREE
La elección de los niveles de StopLoss y TakeProfit puede tener un impacto muy fuerte en el rendimiento general de las operaciones. Además de los parámetros obvios de una transacción comercial (el tamaño de una posible ganancia o pérdida probable), los niveles de StopLoss y TakeProfit también afectan la duración esperada de la transacción y la rentabilidad de la negociación en general. Si ya ha determinado la duración óptima de la transacción utilizando el script " AIS-ODT ", entonces puede come
FREE
This script allows selecting the TakeProfit and StopLoss levels. It analyzes the history data, and then calculates the probability of reaching a given price level. How the script works Suppose you have a trading strategy and you want to select the TakeProfit and StopLoss levels. Run the script and set the parameter: Number of Bars - the average position holding time in bars. Once the script operation is complete, the AIS-PPL.csv file will be created in the Files folder in the terminal data cat
FREE
El script se basa en la simulación de transacciones comerciales utilizando un generador de números aleatorios. Esto le permite obtener resultados completamente diferentes, incluso con los mismos parámetros de entrada. Cuando ejecuta el script, se abre un cuadro de diálogo en el que puede establecer los valores deseados para las variables externas. En el bloque, TradingOptions define los parámetros básicos que se necesitan para simular el comercio. StartBalance : establece el tamaño inicial de l
FREE
This script allows selecting the TakeProfit and StopLoss levels. It analyzes the history data, and then calculates the probability of reaching a given price level. How the script works Suppose you have a trading strategy and you want to select the TakeProfit and StopLoss levels. Run the script and set the parameter: Number of Bars - the average position holding time in bars. Once the script operation is complete, the AIS-PPL.csv file will be created in the Files folder in the terminal data cat
FREE
MinDeposit MT5
Aleksej Poljakov
3 (1)
The script analyzes the history of quotes and gives recommendations on the minimum deposit. The calculations take into account the variability of prices and the standard deviation. Margin requirements for the instrument are also taken into account. The result of the script is the minimum recommended deposit for trading the given currency pair.
FREE
MinDeposit
Aleksej Poljakov
5 (1)
The script analyzes the history of quotes and gives recommendations on the minimum deposit. The calculations take into account the variability of prices and the standard deviation. Margin requirements for the instrument are also taken into account. The result of the script is the minimum recommended deposit for trading the given currency pair.
FREE
Este script está diseñado para que el comerciante pueda determinar la duración promedio de las transacciones comerciales, en la cual la relación de posibles ganancias y pérdidas será óptima. Primero, veamos el enfoque general para determinar la duración óptima de las transacciones comerciales. Introducimos las siguientes variables: R   - el resultado de la transacción; T   - el tiempo durante el cual la transacción estuvo abierta; W : el tiempo entre el cierre de la transacción anterior y la ape
FREE
La elección de los niveles de StopLoss y TakeProfit puede tener un impacto muy fuerte en el rendimiento general de las operaciones. Además de los parámetros obvios de una transacción comercial (el tamaño de una posible ganancia o pérdida probable), los niveles de StopLoss y TakeProfit también afectan la duración esperada de la transacción y la rentabilidad de la negociación en general. Si ya ha determinado la duración óptima de la transacción utilizando el script " AIS-ODT ", entonces puede come
FREE
Este script está diseñado para que el comerciante pueda determinar la duración promedio de las transacciones comerciales, en la cual la relación de posibles ganancias y pérdidas será óptima. Primero, veamos el enfoque general para determinar la duración óptima de las transacciones comerciales. Introducimos las siguientes variables: R - el resultado de la transacción; T - el tiempo durante el cual la transacción estuvo abierta; W : el tiempo entre el cierre de la transacción anterior y la apertur
FREE
The script allows selecting the required 'Filter level' value of the AIS-MTF MT5 indicator. Run the script on the required chart and selected timeframe. Once its operation is complete, the HPS.csv file will be created in the Files folder. Open the file. You will see three columns. The 'Filter lvl' column represents the value of the 'Filter level' for the AIS-MTF indicator. Am. dev. - degree and direction of the indicator's deviation from the price level (sorted in ascending order). Negative valu
FREE
El indicador de promedios correctos de AIS le permite establecer el comienzo de un movimiento de tendencia en el mercado. Otra cualidad importante del indicador es una clara señal del final de la tendencia. El indicador no se redibuja ni se recalcula. Valores mostrados h_AE - límite superior del canal AE l_AE - límite inferior del canal AE h_EC - Valor predicho alto para la barra actual l_EC - Valor predicho bajo para la barra actual Señales al trabajar con el indicador. La señal prin
El indicador de promedio móvil ponderado AIS calcula un promedio móvil ponderado y le permite determinar el comienzo de un movimiento de tendencia del mercado. Los coeficientes de peso se calculan teniendo en cuenta las características específicas de cada barra. Esto le permite filtrar los movimientos aleatorios del mercado. La señal principal que confirma el comienzo de una tendencia es un cambio en la dirección de las líneas del indicador y el precio que cruza las líneas del indicador.
El indicador de factibilidad de grado avanzado de AIS está diseñado para predecir los niveles que el precio puede alcanzar en el futuro. Su trabajo es analizar las últimas tres barras y construir un pronóstico basado en eso. El indicador se puede utilizar en cualquier período de tiempo y cualquier par de divisas. Con la ayuda de la configuración, puede lograr la calidad deseada del pronóstico. Profundidad de pronóstico: establece la profundidad de pronóstico deseada en barras. Se recomienda s
The indicator is designed to measure the price volatility. This allows determining the moments for opening or closing trade positions more accurately. High intensity of the market indicates the instability of its movement, but allows for better results. And, conversely, low intensity of the market indicates the stability of its movement. Parameters Bars to process - the number of bars to measure the price movements. A low value of this parameter allows determining the moments of rapid price mo
This indicator uses the Fibonacci p-numbers to smooth a price series. This allows combining the advantages of the simple and exponential moving averages. The smoothing coefficients depend on the level of the p-number, which is set in the indicator parameters. The higher the level, the greater the influence of the simple moving average and the less significant the exponential moving average. Parameters Fibonacci Numbers Order - order of the Fibonacci p-number, specified by trader. Valid values
The indicator is based on the analysis of interaction of two filters. The first filter is the popular Moving Average. It helps to identify linear price movements and to smooth minor price fluctuations. The second filter is the Sliding Median. It is a non-linear filter. It allows to filter out noise and single spikes in the price movement. A predictive filter implemented in this indicator is based on the difference between these filters. The indicator is trained during operation and is therefore
This indicator studies the price action as a combination of micro-trends. All micro-trends are analyzed and averaged. Price movement is filtered based on this averaging. IP_High and IP_Low (blue and red dashed lines) show the instantaneous price movement. They display the forecast only for the current price values, taking into account only the number of bars defined by the 'Filter level' parameter. SP_High and SP_Low (blue and red solid lines) smooth the price movements with respect to history.
The script allows selecting the required 'Filter level' value of the AIS-MTF indicator. Run the script on the required chart and selected timeframe. Once its operation is complete, the HPS.csv file will be created in the Files folder. Open the file. You will see three columns. The 'Filter lvl' column represents the value of the 'Filter level' for the AIS-MTF indicator. Am. dev. - degree and direction of the indicator's deviation from the price level (sorted in ascending order). Negative values i
FREE
Este indicador implementa un proceso de suavizado lineal simple. Una de las desventajas del suavizado exponencial es el rápido decaimiento de la señal. Esto hace que sea imposible realizar un seguimiento completo de las tendencias a largo plazo en el rango de precios. El suavizado lineal le permite ajustar con mayor precisión y precisión el filtrado de la señal. El indicador se configura seleccionando parámetros: LP: este parámetro le permite seleccionar el período de suavizado. Cuanto ma
Este indicador es un filtro híbrido secuencial basado en una combinación de propiedades medias y medias móviles. El uso de la mediana permite filtrar valores atípicos anormales e impulsos aleatorios en los valores de las series de precios. Al mismo tiempo, el filtro de mediana no actúa sobre la tendencia en el movimiento de precios, dejándolo sin cambios. Como el filtro de la mediana no es lineal, se utiliza el promedio utilizando un promedio móvil simple para suavizar sus valores. Este enfoq
Este indicador es una combinación de dos filtros modificados de Lanczos. El primer filtro sirve para extrapolar el precio. Basado en valores pasados, predice un posible movimiento de precios dentro de la barra actual. Es decir, muestra cuál sería el precio si las tendencias pasadas permanecieran sin cambios. El segundo filtro para suavizar y promediar los precios dentro de la ventana, determinado por el nivel del filtro. Gracias a la selección de ponderaciones, este filtro responde más activamen
Echemos un vistazo a la naturaleza de los cambios de precios en el mercado de divisas, sin prestar atención a las razones por las que se producen estos cambios. Este enfoque nos permitirá identificar los principales factores que afectan el movimiento de precios. Por ejemplo, tomemos los precios de apertura de las barras en el par de divisas EUR-USD y el período H1. Para estos precios, construimos el diagrama de Lameray (Figura 1). En este diagrama, se puede ver que el movimiento del precio se pr
Este indicador es más informativo. Su trabajo se basa en la suposición de que el movimiento de los precios en el mercado puede representarse como el ruido de un color en particular, que depende de los parámetros de la distribución de los valores de los precios. Gracias a esto, es posible analizar el cambio de precio desde diferentes ángulos y, considerando el movimiento del precio como ruido de un color en particular, se puede obtener información sobre el estado actual de las cosas en el mercad
A pesar de algunos inconvenientes del indicador " AIS Color Noise Filter ", la idea de usarlo para suavizar las series de precios y los precios de previsión parece bastante atractiva. Esto se debe a varias razones: En primer lugar, tener en cuenta varios componentes de ruido permite elaborar un pronóstico sobre factores independientes entre sí, lo que puede mejorar la calidad del pronóstico; en segundo lugar, las características de ruido de las series de precios se comportan de manera bastante
Muy a menudo, en el estudio de series financieras se aplica su suavizado. Mediante el suavizado, puede eliminar componentes de alta frecuencia; se cree que están causados ​​por factores aleatorios y, por lo tanto, no son significativos. El suavizado siempre incluye alguna forma de promediar los datos, en la que los cambios aleatorios en las series de tiempo se absorben mutuamente. Muy a menudo, para este propósito, se utilizan métodos de media móvil simple o ponderada, así como el suavizado exp
Para aislar componentes a largo plazo y no aleatorios, es necesario saber no solo cuánto ha cambiado el precio, sino también cómo se produjeron estos cambios. En otras palabras, estamos interesados ​​no solo en los valores de los niveles de precios, sino también en el orden en que estos niveles se reemplazan entre sí. A través de este enfoque, se pueden encontrar factores a largo plazo y estables que influyen (o pueden influir) en el cambio de precio en un momento dado. Y el conocimiento de est
Uno de los poderosos métodos de análisis es el modelado de series financieras utilizando procesos de Levy. La principal ventaja de estos procesos es que pueden usarse para modelar una gran cantidad de fenómenos, desde los más simples hasta los más complejos. Basta con decir que la idea del movimiento de los precios fractales en el mercado es solo un caso especial de los procesos de Levy. Por otro lado, con la selección adecuada de los parámetros, cualquier proceso de Levy puede representarse co
Muy a menudo, el comerciante se enfrenta a la tarea de determinar en qué medida el precio puede cambiar en un futuro próximo. Para este propósito, puede usar el tipo de distribución Johnson SB. La principal ventaja de esta distribución es que puede usarse incluso con una pequeña cantidad de datos acumulados. El enfoque empírico utilizado para determinar los parámetros de esta distribución le permite determinar con precisión los niveles máximos y mínimos del canal de precios. Estos valores se pu
Este indicador le permite determinar la probabilidad de que el precio alcance uno u otro nivel. Su algoritmo es bastante simple y se basa en el uso de datos estadísticos sobre los niveles de precios de un par de divisas en particular. Gracias a los datos históricos recopilados, es posible determinar en qué medida cambiará el precio durante la barra actual. A pesar de su simplicidad, este indicador puede proporcionar asistencia invaluable en el comercio. Entonces, con su ayuda, es posible determ
Filtro:
No hay comentarios
Respuesta al comentario