• Información general
  • Comentarios (6)
  • Discusión (24)
  • Novedades

RSI Divergence Scanner MT5

5

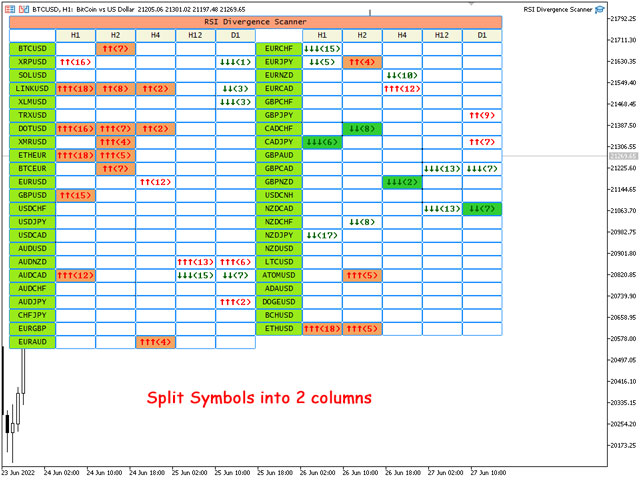
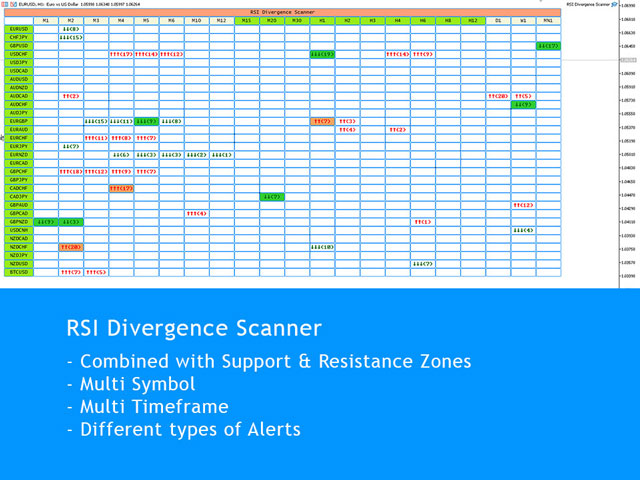
RSI Divergence Scanner is a multi-timeframe and multi-symbol dashboard and alert that checks all timeframes and symbols to find regular and hidden divergences between price chart and RSI indicator.

This divergence scanner is integrated with support and resistance zones so you can check the RSI divergences in the most important areas of the chart to find trend reversals in price chart.

Download demo version (works on M4,M5,M6,M12,H3,H8 timeframes)

Full description of scanner parameters -> click here.

How to get the most from the scanner -> read this article.

Using RSI divergences alongside other technical tools like price action, candlestick patterns and support resistance zones gives reliable signals for possible trend reversals.

If you are using RSI Divergence in your trading strategy, this scanner helps you find the best opportunities to trade without spending much time in front of your system.

RSI Divergence Scanner Features:

  • Scanner finds both regular (classic) and hidden divergences
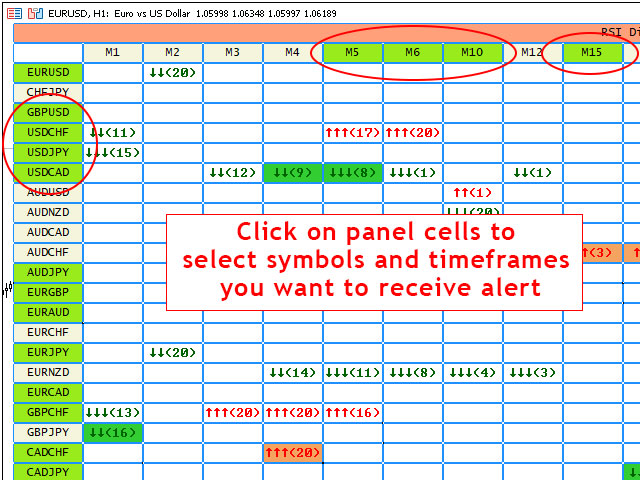
  • Run the dashboard on one chart and see the RSI Divergence for all selected symbols and timeframes.
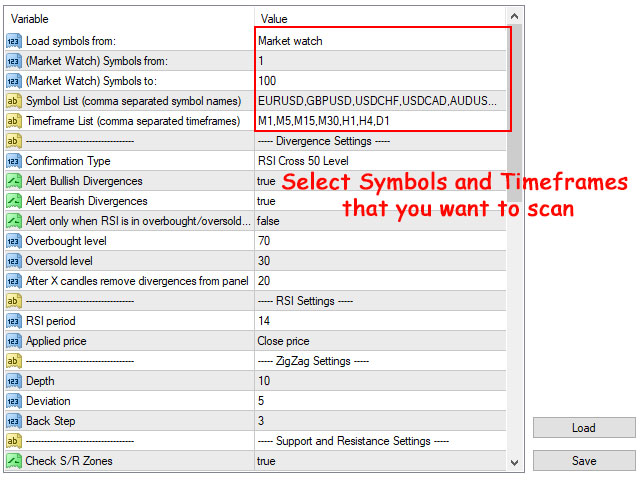
  • You can set the scanner to only search for divergences that occur in overbought/oversold levels (that you set in parameters).
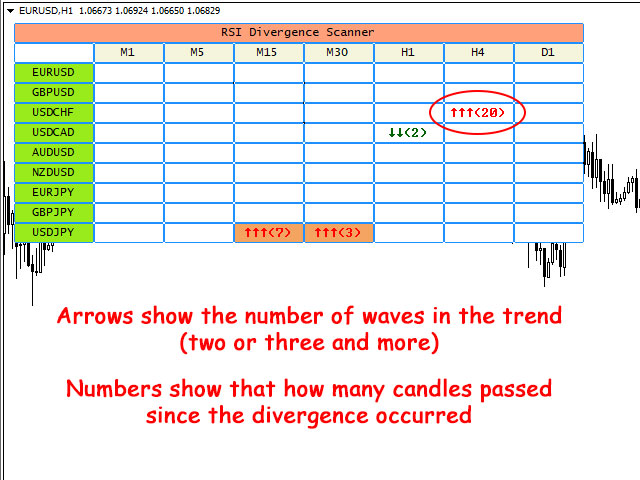
  • The panel shows that how many candles passed since the divergence occurred.
  • The panel shows the number of trend waves (2 or 3 and more) that leads to the divergence.
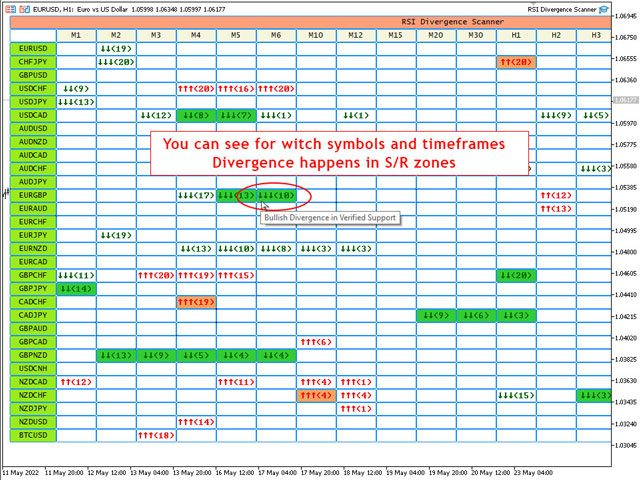
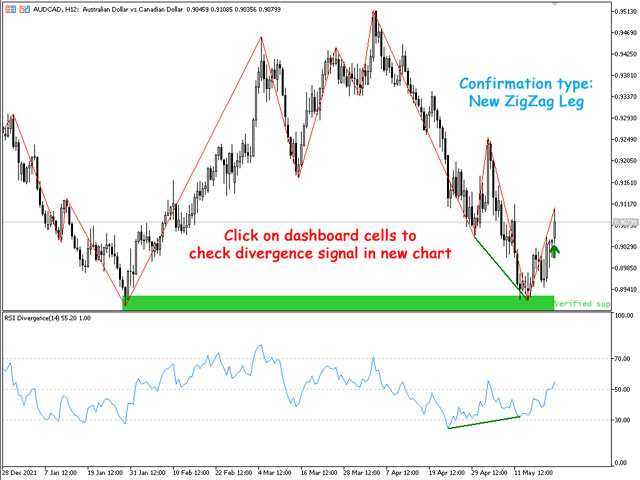
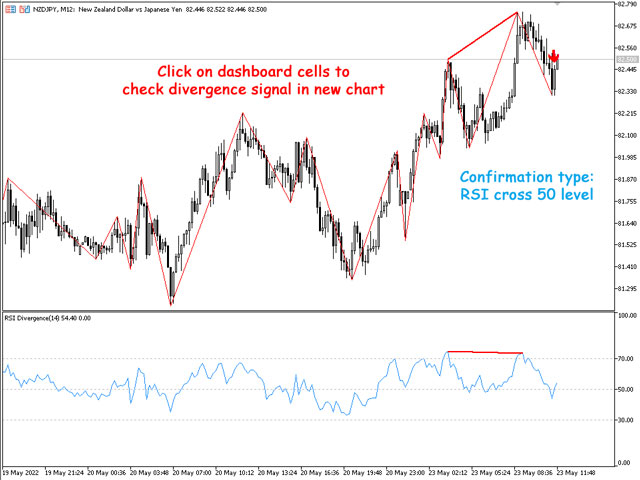
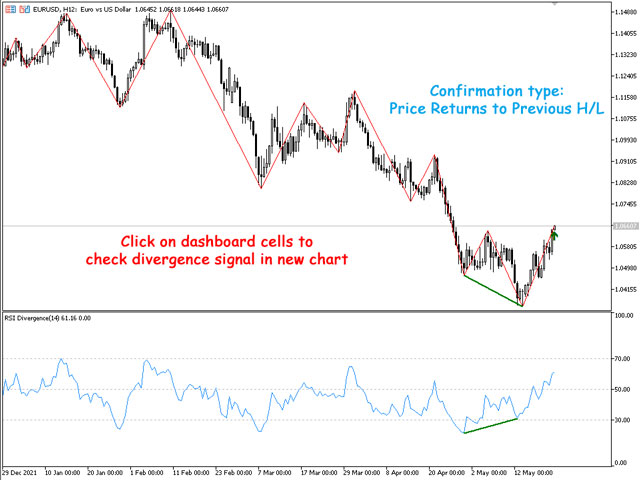
  • When you click on table cells, you can see the S/R zone, divergence line and divergence arrow on the opened price chart.
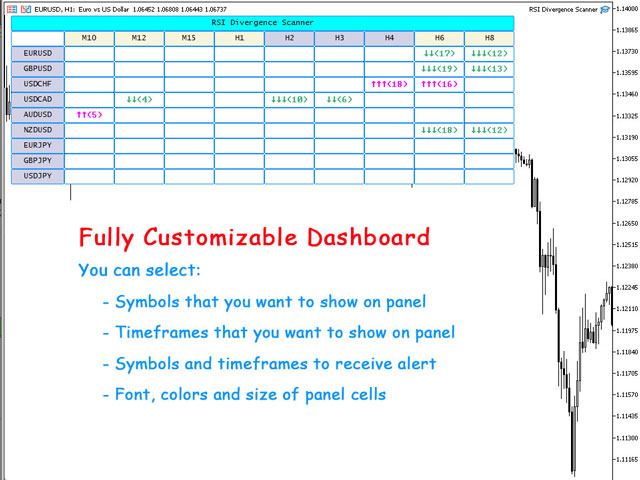
  • You can split the symbols into 2 or 3 columns to show more symbols on the chart.
  • You can separate symbols into multiple dashboards with different parameters for each dashboard (for example for different markets).
  • You can enable/disable alerts for symbols and timeframes directly from the scanner dashboard.
  • Scanner works in all markets (Forex, Stocks, Indices, Commodities, Crypto ...), you can write the symbol names in the settings (comma separated) or simply set the scanner to read the symbols from market watch.

Different confirmations for divergences

There are 7 confirmation option for RSI divergences that you can select in input parameters:

  • Candlestick Patterns
  • RSI line cross 50 level
  • Price returns to previous H/L (known as change of character or momentum shift)
  • Heiken Ashi indicator - Changing the Color
  • Stochastic indicator - Lines Cross
  • Strong Reversing Candle (may not happen)
  • Immediate alert without confirmation

Integrated with support and resistance zones

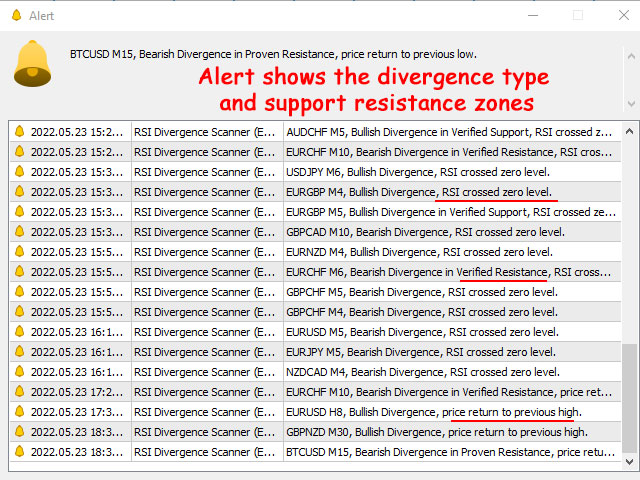
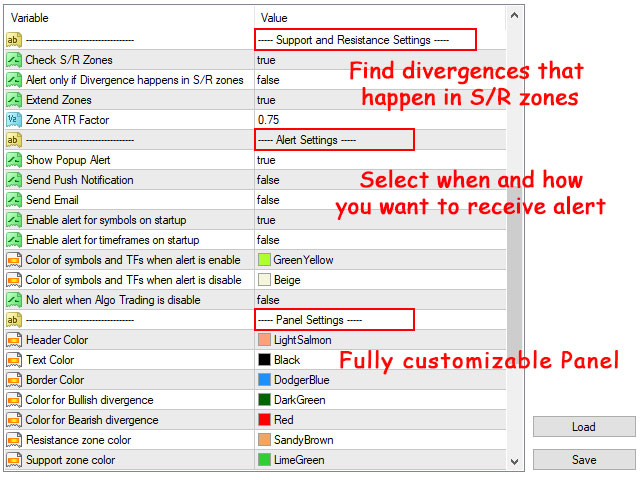
  • You can set the scanner to only receive alerts for RSI divergences that are inside the support and resistance zones.
  • You can see witch RSI divergences happen in support resistance zones through cell colors.
  • You can set the parameters for support and resistance zones in scanner input parameters.
  • Support and resistance zones are calculated based on shved supply and demand indicator that you can download for free from this link (scanner doesn't need it).

Different Alert Types:

You can enable the following alerts at the same time in the scanner settings.

  • Show Pop Up Alert: Show alert window when scanner alert triggers.
  • Send Push Notification: Send push notification to mobile phone when scanner alert triggers. (You should set metatrader Notifications options)
  • Send Email: Send email when scanner alert triggers. (You should set metatrader Email options)

Notes:

  • RSI Divergence Scanner uses ZigZag indicator to determine trend direction and HH/LL of the price, you can change the ZigZag parameters in the indicator's input window.
  • You can add the free RSI Divergence Indicator to your default chart template, so when you click on the dashboard cells, you can see the divergence on the opened chart (dashboard doesn't need the indicator to run).
  • Dashboard works smoothly for 50 symbols and all 21 timeframes on an average PC, you can add more symbols when you reduce the number of timeframes.
  • If there are many symbols in the market watch, in the first run of the scanner on the chart it may take some time to load the history data for all timeframes of all symbols.
  • If you don't want to find RSI divergences on W1 and MN1 timeframes, don't load them on the dashboard. Charts must have at least 300 candles for checking the trend and finding the divergences.
  • Dashboard updates every 1-minute candle open time, run it on more volatile symbols like EURUSD and BTCUSD to receive new price ticks faster.

Comentarios 6
Vladimir Shramchenko
446
Vladimir Shramchenko 2024.10.17 11:04 
 

Thank you for your hard work. A very high-quality product that shows the rapidly turning formations of the market. And you can quickly apply it in your Trading System.

JAMTRADERS
36
JAMTRADERS 2024.05.30 11:34 
 

great tool for traders who use RSI divergence as tool when trading. very easy to use and it lessen my time scanning the market for possible entry

(less time scanning---->less stress--->less emotion----->GOOD TRADING)

thank you so much sir

simon.metivier
76
simon.metivier 2024.03.06 01:29 
 

It's a wonderful tool, it helps saving me a lot of time looking for divergence on multiple instruments with several Timeframe on each. I am using divergences without confirmation and all are spot on everytime and pop instantly at the close of the candle. If there was one thing I'd like to add, it would be the possibility to receive alert for divergences without confirmation and (at the same time) with confirmation (Candlestick Pattern or another type). Because I like to work and see which type of confirmation is best for working indices. Again thanks for your great work.

Productos recomendados
MACD Divergence Scanner is a multi-timeframe and multi-symbol dashboard and alert that checks all timeframes and symbols to find regular and hidden divergences between price chart and MACD indicator. This divergence scanner is integrated   with support and resistance zones so you can check the MACD divergences in the most important areas of the chart to find trend reversals in the price chart. Download demo version   (works on M4,M5,M6,M12,H3,H8 timeframes) Full description of scanner parameters
Introducing the Consecutive Green/Red Candle Alert Indicator for MT5 - Your Trend Spotting Companion! Are you ready to take your trading to the next level? We present the Consecutive Green/Red Candle Alert Indicator, a powerful tool designed to help you spot trends and potential reversals with ease. Whether you're a new trader looking for clarity in the market or an experienced pro seeking additional confirmation, this indicator is your trusted companion. Key Features of the Consecutive Gre
Wolfe Wave Scanner MT5
Reza Aghajanpour
5 (6)
**  All Symbols  x  All Timeframes  scan just by pressing scanner button ** *** Contact me  to send you instruction and add you in "Wolfe Wave Scanner group" for sharing or seeing experiences with other users. Introduction: A Wolfe Wave is created with five-wave patterns in price. It shows supply and demand and a fight towards a balance price. T hese waves of price actions can help traders identify the boundaries of   the trend . Also  It helps forecast how the price will move in the near futu
The Penta-O is a 6-point retracement harmonacci pattern which usually precedes big market movements. Penta-O patterns can expand and repaint quite a bit. To make things easier this indicator implements a twist: it waits for a donchian breakout in the right direction before signaling the trade. The end result is an otherwise repainting indicator with a very reliable trading signal. The donchian breakout period is entered as an input. [ Installation Guide | Update Guide | Troubleshooting | FAQ | A
Cumulative delta indicator As most traders believe, the price moves under the pressure of market buying or selling. When someone redeems an offer standing in the cup, the deal is a "buy". If someone pours into the bid standing in the cup - the deal goes with the direction of "sale". The delta is the difference between purchases and sales. A cumulative delta - the difference between the cumulative sum of purchases and sales for a certain period of time. It allows you to see who is currently contr
This indicator can automatically scan the RSI values of all varieties on the mt5 and set an alarm. Note that it is fully automatic scanning, you do not need to enter which varieties, do not need to open the variety chart, as long as there are some varieties in the market quotation column, will be automatically scanned to reach the set rsi alarm value, will pop up the alarm, and cycle with the market changes to scan the latest RSI values of all varieties, and alarm. This is very helpful t
KopierMaschine - локальный копировщик сделок между различными счетами MetaTrader 4 и MetaTrader 5 в любом направлении расположенных на одном компьютере с интуитивно понятным интерфейсом. Направления копирования: MT4 --> MT5 MT4 --> MT4 MT5 --> MT5 MT5 --> MT4 для копирования между терминалами MetaTrader 4 и   MetaTrader   5 необходимо приобрести версию продукта   KopierMaschine  для    MetaTrader  4 Особенности Программа работает в двух режимах Master и Slave На один подчиненный счет можно коп
Schaff Trend Cycle STC
Mohammad Taher Halimi Tabrizi
The Schaff Trend Cycle indicator is the product of combining Slow Stochastics and the moving average convergence/divergence (MACD). The MACD has a reputation as a trend indicator, but it's also notorious for lagging due to its slow responsive signal line. The improved signal line gives the STC its relevance as an early warning sign to detect currency trends. this indicator is converted from Trading View code of STC Indicator - A Better MACD [SHK]
Gartley Projections D
Oleksandr Medviediev
3 (2)
El indicador identifica los patrones armónicos (XABCD) según los desarrollos de H.M.Gartley ("Beneficios en el mercado de valores", 1935г). Proyecta el punto D como un punto en la proyección en perspectiva (especifique ProjectionD_Mode = true en la configuración). No vuelve a dibujar. Cuando se cierra una barra del período de trabajo, si el punto del patrón identificado no se ha movido durante las barras Patterns_Fractal_Bars, aparece una flecha en el gráfico (en la dirección del movimiento
Price Breakout pattern Scanner is the automatic scanner for traders and investors. It can detect following patterns automatically from your chart. Head and Shoulder - Common tradable pattern. Reverse Head and Shoulder - This pattern is the reverse formation of the Head and Shoulder. Double Top - When the price hits resistance level twice and decline toward the support level, the trader can anticipate sudden bearish breakout through the support level. Double Bottom - The double bottom pattern is
FXC iMACD-DivergencE MT5 Indicator This is an advanced MACD indicator that finds trend-turn divergences on the current symbol. The indicator detects divergence between the MACD and the price movements as a strong trend-turn pattern. Main features: Advanced divergence settings Price based on Close, Open or High/Low prices Give Buy/Sell open signals PUSH notifications E-mail sending Pop-up alert Customizeable Information panel Input parameters: MACD Fast-EMA: The Fast-EMA variable of the MACD
Introducing the Power Trade Plus indicator designed by a small group of traders with a few years of experience trading the market profitably.  The Power Trade Plus is derived from the Power Trade indicator,  the indicator strive in powerful sniper entries and take profit levels,  with an algorithm that's can determine the markets volatility and Provides entries based on the current market volatility. This indicator is much more effective in stock ,currencies and indices.
DarwinIA Silver Rating 95.09 - Asignación mensual 145.000 € - Julio 2024 Este es un Experto exclusivo, único en su clase, del que sólo se venderá una copia para usarlo en Darwinex Zero. Dado que en Darwinex existe un estricto control del copy trading, el uso de expertos exclusivos es obligatorio. Este Experto es totalmente compatible con las reglas y expectativas de Darwinex. Este Experto funciona como un cazador, analizando meticulosamente el movimiento del precio, la fuerza y la tendencia.
This plots  Fibonacci deviation levels above and below a moving average of the price. Companion indicator to the " Golden Bull Wave Trader "  expert advisor which uses volume\price trend to determine price reversals. https://www.mql5.com/en/market/product/56291 The expert advisor and this indicator were created in order to: Identify ideal and repeatable trade entries with high level of certainty Create a day trading strategy which doesn’t require a hard SL and TP Use alternate risk management me
ATrend
Zaha Feiz
4.88 (8)
ATREND: Cómo Funciona y Cómo Usarlo #### Cómo Funciona El indicador "ATREND" para la plataforma MT5 está diseñado para proporcionar a los traders señales de compra y venta robustas mediante una combinación de metodologías de análisis técnico. Este indicador utiliza principalmente el Rango Verdadero Promedio (ATR) para medir la volatilidad, junto con algoritmos de detección de tendencias para identificar posibles movimientos del mercado. Deja un mensaje después de la compra y recibe un regalo es
Introduction to X3 Chart Pattern Scanner X3 Cherart Pattern Scanner is the non-repainting and non-lagging indicator detecting X3 chart patterns including Harmonic pattern, Elliott Wave pattern, X3 patterns, and Japanese Candlestick patterns. Historical patterns match with signal patterns. Hence, you can readily develop the solid trading strategy in your chart. More importantly, this superb pattern scanner can detect the optimal pattern of its kind. In addition, you can switch on and off individu
Introduction to Chart Pattern MT Chart Pattern MT is a chart pattern scanner to detect the triangle pattern, falling wedge pattern, rising wedge pattern, channel pattern and so on. Chart Pattern MT uses highly sophisticated chart pattern detection algorithm. However, we have designed it in the easy to use with intuitive user interface. Chart Pattern MT will show all the patterns in your chart in the most efficient format for your trading. You do not have to do tedious manual pattern detection an
MACDivergence MTF MT5
Pavel Zamoshnikov
4 (5)
Advanced ideas of the popular MACD indicator: It detects and displays classic and reverse divergences (two methods of detecting divergences). It uses different color to highlight an uptrend and a downtrend. Two methods of determining a trend: а) MACD crosses the 0 level (classic signal); б) MACD crosses its own average (early signal). This is a multi-timeframe indicator: it can display MACD data from other timeframes. Two methods of drawing: classic histogram and line. It generates sound and vis
Elliott Wave Trend was designed for the scientific wave counting. This tool focuses to get rid of the vagueness of the classic Elliott Wave Counting using the guideline from the template and pattern approach. In doing so, firstly Elliott Wave Trend offers the template for your wave counting. Secondly, it offers Wave Structural Score to assist to identify accurate wave formation. It offers both impulse wave Structural Score and corrective wave Structure Score. Structural Score is the rating to sh
Description : Rainbow EA MT5 is a simple Expert advisor based on   Rainbow MT5 indicator witch is based on Moving average with period 34. The indicator is incorporated in the EA, therefore, it is not required for the EA to operate, but if you wish, you can download it from   my product page . The Expert Advisor settings are as follows : Suitable for Timeframes up to H1 The parameters below can be set according to your trading rules. StopLoss ( Stop Loss in pips) TakeProfit ( Take Profit in pi
Noize Absorption Index - is the manual trading system that measures the difference of pressure between bears forces and bulls forces. Green line - is a noize free index that showing curent situation. Zero value of index shows totally choppy/flat market.Values above zero level shows how powerfull bullish wave is and values below zero measures bearish forces.Up arrow appears on bearish market when it's ready to reverse, dn arrow appears on weak bullish market, as a result of reverse expectation.
Atomic Analyst MT5
Issam Kassas
4.28 (18)
En primer lugar, vale la pena enfatizar que este Indicador de Trading no repinta, no redibuja y no se retrasa, lo que lo hace ideal tanto para el trading manual como para el automatizado. Manual del usuario: configuraciones, entradas y estrategia. El Analista Atómico es un Indicador de Acción del Precio PA que utiliza la fuerza y el impulso del precio para encontrar una mejor ventaja en el mercado. Equipado con filtros avanzados que ayudan a eliminar ruidos y señales falsas, y aumentan el poten
KT Renko Patterns MT5
KEENBASE SOFTWARE SOLUTIONS
KT Renko Patterns scans the Renko chart brick by brick to find some famous chart patterns that are frequently used by traders across the various financial markets. Compared to the time-based charts, patterns based trading is easier and more evident on Renko charts due to their uncluttered appearance. KT Renko Patterns features multiple Renko patterns, and many of these patterns are extensively explained in the book titled Profitable Trading with Renko Charts by Prashant Shah. A 100% automate
Modificación multidivisa y multitemporal del indicador Índice de Fuerza Relativa (RSI). Puede especificar las monedas y plazos que desee en los parámetros. Además, el panel puede enviar notificaciones cuando se cruzan niveles de sobrecompra y sobreventa. Al hacer clic en una celda con un punto, se abrirá este símbolo y punto. Este es el escáner MTF. La clave para ocultar el panel del gráfico es "D" de forma predeterminada. De manera similar al medidor de fortaleza de la moneda, el Panel pue
¡El nivel Premium es un indicador único con más del 80% de precisión de predicciones correctas! ¡Este indicador ha sido probado por los mejores especialistas en comercio durante más de dos meses! ¡El indicador del autor no lo encontrarás en ningún otro lugar! ¡A partir de las capturas de pantalla, puede ver por sí mismo la precisión de esta herramienta! 1 es ideal para operar con opciones binarias con un tiempo de vencimiento de 1 vela. 2 funciona en todos los pares de divisas, accion
Este indicador encuentra los patrones de retroceso AB = CD. El patrón de retroceso AB = CD es una estructura de precios de 4 puntos en la que el segmento de precios inicial está parcialmente retrocedido y seguido de un movimiento equidistante desde la finalización del retroceso, y es la base básica de todos los patrones armónicos. [ Guía de instalación | Guía de actualización | Solución de problemas | FAQ | Todos los productos ] Tamaños de patrones personalizables Relaciones de CA y BD pe
Incinerat8
Paulos Ngwenya
This algorithm uses real time data to generate signals with an accuracy rate of 80%. It shows entries and where you should place both the stoploss and the take profit for each trade. It determines trend! It can even help you to become a signal provider! And it can generate up to 8 signals a day! You get access to a free forex trading community  Operates on any broker compatible to synthetic indices and forex   if you need any assistance whatsapp +2774 35 35 744 or telegram link @pipsempire01
An Ultimate Tool  for quick and efficient market analysis. Unique combination of solid indicators defining market direction for trend tracking and filtration designed for you to stay on the   right   side of the market. Market Rider Oscillators  gives you access to one of the most used from professional trades indicators on worldwide, which were not build in for MT4 and MT5 terminals . These are unique non-repainting oscillators designed to be used on all time frames for all instruments class
Gann Box (o Gann Square) es un método de análisis de mercado basado en el artículo "Fórmula matemática para predicciones de mercado" de W.D. Gann. Este indicador puede trazar tres modelos de cuadrados: 90, 52 (104), 144. Hay seis variantes de cuadrículas y dos variantes de arcos. Puede trazar varios cuadrados en un gráfico simultáneamente. Parámetros Square — selección de un modelo cuadrado: 90 — cuadrado de 90 (o cuadrado de nueve); 52 (104) — cuadrado de 52 (o 104); 144 — cuadrado univer
Now, you have your own AUTO-CLOSE program ! Once your account target or drawdown hits, all open orders will be closed automatically. ========================================== INPUTS: Account target:   Put the exact account target. Once the equity hits it or went above that, all orders closed. Please add buffer to consider slippage. Use fixed value or dynamic value:   Choose whether you will need a fixed value or dynamic value for drawdown.  DYNAMIC SETTINGS: Equity-based or Balance-based drawdo
Los compradores de este producto también adquieren
Trade Assistant MT5
Evgeniy Kravchenko
4.38 (165)
Ayuda a calcular el riesgo por operación, la fácil instalación de una nueva orden, gestión de órdenes con funciones de cierre parcial, trailing stop de 7 tipos y otras funciones útiles. Atención, la aplicación no funciona en el probador de estrategias. Puede descargar la versión Demo en la página de descripción  Manual, Description, Download demo Función de línea -   Muestra en el gráfico la línea de apertura, Stop Loss, Take Profit. Con esta función es fácil establecer una nueva orden y ver
Bienvenido a Trade Manager EA: la herramienta definitiva de gestión de riesgos diseñada para hacer que el trading sea más intuitivo, preciso y eficiente. No es solo una herramienta para realizar órdenes; es una solución integral para la planificación de operaciones, gestión de posiciones y control del riesgo. Ya seas un principiante, un trader avanzado o un scalper que necesita ejecuciones rápidas, Trade Manager EA se adapta a tus necesidades, ofreciendo flexibilidad en todos los mercados, desde
TradePanel MT5
Alfiya Fazylova
4.85 (116)
Trade Panel es un asistente comercial multifuncional. La aplicación contiene más de 50 funciones para el comercio manual y le permite automatizar la mayoría de las acciones comerciales. Antes de comprar, puede probar la versión demo en una cuenta de demostración. Demostración aquí . Instrucciones completas aquí . Comercio. Le permite realizar operaciones comerciales básicas con un solo clic: Apertura de órdenes y posiciones. Abrir una cuadrícula de órdenes. Cierre de órdenes y posiciones. Revers
Custom Alerts MT5
Daniel Stein
5 (2)
Adelántese a los movimientos del mercado con alertas personalizadas: Su escáner multimercado definitivo Las alertas personalizadas son una potente herramienta de supervisión del mercado todo en uno que le permite identificar fácilmente configuraciones de alto potencial en múltiples mercados. Con una cobertura de las ocho divisas principales (USD, CAD, GBP, EUR, CHF, JPY, AUD, NZD), oro (XAU) y hasta siete índices clave (incluidos US30, UK100, WTI y Bitcoin), las alertas personalizadas le mantie
The product will copy all telegram signal to MT5 ( which you are member) , also it can work as remote copier.  Easy to set up, copy order instant, can work with almost signal formats, image signal,  s upport to translate other language to English Work with all type of channel or group, even channel have "Restrict Saving Content", work with  multi channel, multi MT5 Work as remote copier: with signal have ticket number, it will copy exactly via ticket number. Support to backtest signal. How to s
Trade Dashboard MT5
Fatemeh Ameri
4.96 (52)
Tired of complex order placement and manual calculations? Trade Dashboard is your solution. With its user-friendly interface, placing orders becomes effortless, by a single click, you can open trades, set stop loss and take profit levels, manage trade lot size, and calculate risk to reward ratios, allowing you to only focus on your strategy. Say goodbye to manual calculations and streamline your trading experience with Trade Dashboard. Download  Demo Version  right now. You can find  Details of
Telegram To MT5 Receiver
Levi Dane Benjamin
4.88 (8)
Copie las señales de cualquier canal del que sea miembro (incluidos los privados y restringidos) directamente a su MT5.  Esta herramienta ha sido diseñada pensando en el usuario al ofrecer muchas características que necesita para gestionar y monitorear las operaciones. Este producto se presenta en una interfaz gráfica fácil de usar y visualmente atractiva. ¡Personalice su configuración y comience a usar el producto en minutos! Guía del usuario + Demo  | Versión MT4 | Versión Discord Si desea
$450 (-20%) instead of $565 until 11/29 B e sure to watch this video before using A community for users, product discussion, update news, and first line of support  Use Webmoney For payments in cryptocurrencies. How I use this algo tool   Lazy Trader is NOT SUITABLE FOR SCALPING EVERY MINUTE MOVEMENT, ESPECIALLY IN CRYPTO. WITHOUT UNDERSTANDING WHAT IS HAPPENING ON THE CHART, THERE IS NO POINT IN BLINDLY HOPING FOR PROFITS! Lazy Trader does NOT USE openAI chat-gpt-4 technologies, which are ad
-25% discount ($149 -> $111) Everything for chart Technical Analysis indicator mt5 in one tool Draw your supply demand zone with rectangle and support resistance with trendline and get alerts to mobile phone or email alert -  Risk reward indicator mt5 Video tutorials, manuals, DEMO download   here .   Find contacts on my   profile . 1.   Extended rectangles and trendlines Object will be extended to the right edge of the chart when price will draw new candles on chart. This is rectangle extend
Trade Assistant 38 in 1
Makarii Gubaydullin
4.89 (18)
Herramienta multifuncional con más de 65 funciones, incluidas: Calculadora de lotaje, Acción del precio, Calculo RR, Gestor de posiciones, Zonas de Oferta y Demanda Versión demo   |   Manual de usuario   |   MT4 La utilidad no funciona en el probador de estrategias: puede descargar la   Versión Demo AQUÍ   para probar el producto. Pongase en contacto   conmigo para cualquier pregunta / ideas para mejorar / en caso de encontrar un problema Simplifica, acelera y automatiza su operativa de tradi
RiskGuard Management
MONTORIO MICHELE
5 (17)
ATTENTION the expert does not work in strategy tester, for a trial version visit my profile. Manual RiskGuard Management   RiskGuard management was born with the idea of ​​helping traders from their initial journey to becoming expert and aware traders. Compatible with any operating system whether Mac or Windows. The operations panel is integrated into the graph giving the possibility to choose size and position between right and left, while the various buttons light up when they can be used,
Unlimited Trade Copier Pro MT5 is a tool to copy trade remotely to multiple MT4, MT5 and cTrader accounts at different computers/locations over internet. This is an ideal solution for you if you are a signal provider and want to copy your trades to other receivers globally on your own rules. One provider can copy trades to multiple receivers and one receiver can get trade from multiple providers as well. The provider can even set the subscription expiry for each receiver, so that receiver will n
YuClusters
Yury Kulikov
4.93 (41)
Atención: la versión de demo para revisión y prueba está aquí . YuClusters es un sistema de análisis de mercado profesional. El comerciante tiene oportunidades únicas para analizar el flujo de órdenes, volúmenes comerciales, movimientos de precios utilizando varios gráficos, perfiles, indicadores y objetos gráficos. YuClusters opera con datos basados ​​en Time & Sales o información de ticks, dependiendo de lo que esté disponible en las cotizaciones de un instrumento financiero. YuClusters le pe
DashPlus es una herramienta avanzada de gestión de operaciones diseñada para mejorar la eficiencia y efectividad de sus transacciones en la plataforma MetaTrader 5. Ofrece un conjunto integral de funciones, que incluyen cálculo de riesgos, gestión de órdenes, sistemas avanzados de cuadrícula, herramientas basadas en gráficos y análisis de rendimiento. Características Clave 1. Cuadrícula de Recuperación Implementa un sistema de cuadrícula de promediado y flexible para gestionar operaciones durant
-25% discount ($199 -> $149) Advanced trading tool: One click smart orders that execute under your conditions Developed by trader for trading community:  position size calculator (lot size), open position after price action, strategy builder, set and forget trading, mobile notifications... Risk Management -  Risk percentage position size calculator, gain percentage, target risk reward ratio, spread and commissions are included in calculations 7 Advanced order types  - Set and forget trading w
Bots Builder Pro MT5
Andrey Barinov
4 (5)
This is exactly what the name says. Visual strategy builder . One of a kind. Turn your trading strategies and ideas into Expert Advisors without writing single line of code. Generate mql source code files with a few clicks and get your fully functional Expert Advisors, which are ready for live execution, strategy tester and cloud optimization. There are very few options for those who have no programming skills and can not create their trading solutions in the MQL language. Now, with Bots Build
Grid Manual MT5
Alfiya Fazylova
4.88 (16)
Grid Manual es un panel de negociación para trabajar con una cuadrícula de órdenes. La utilidad es universal, tiene configuraciones flexibles y una interfaz intuitiva. Funciona con una cuadrícula de pedidos no solo en la dirección de promediar pérdidas, sino también en la dirección de aumentar las ganancias. El usuario no necesita crear y mantener una cuadrícula de pedidos, la utilidad lo hará. Basta con abrir un pedido y el "Grid manual" creará automáticamente una grilla de pedidos para el mism
Ultimate Trailing Stop EA MT5
BLAKE STEVEN RODGER
4.5 (6)
This EA Utility allows you to manage (with advanced filtering) unlimited open orders (manual or EA) with 16 trailing stop methods: fixed, percent, ATR Exit, Chandelier Exit, Moving Average, Candle High Low Exit, Bollinger Bands, Parabolic, Envelope, Fractal, Ichimoku Kijun-Sen, Alligator, Exit After X Minutes or Bars, RSI and Stochastic. The trailing stop can be either real or virtual, and you can exit fully or with a partial close percent on touch or bar close.  Moreover, you can add (overri
Auto Trade Copier for MT5
Vu Trung Kien
4.27 (22)
Auto Trade Copier está diseñado para copiar los oficios entre múltiples cuentas MT5 / terminales con una precisión absoluta. Con esta herramienta, puede actuar como proveedor (fuente ) o receptor (destino ) . Cada acciones comerciales podrán ser clonados del proveedor al receptor sin demora. Las siguientes son las funciones destacadas :     Cambie entre proveedores o función del receptor en una sola herramienta.     Un proveedor puede copiar los oficios a las cuentas de múltiples receptor
Take a Break MT5
Eric Emmrich
4.75 (16)
The most advanced news filter and drawdown limiter on MQL market NEW: Take a Break can be backtested against your account history! Check the " What's new " tab for details. Take a Break has evolved from a once simple news filter to a full-fledged account protection tool. It pauses any other EA during potentially unfavorable market conditions and will continue trading when the noise is over. Typical use cases: Stop trading during news/high volatility (+ close my trades before). Stop trading when
DrawDown Limiter
Haidar, Lionel Haj Ali
5 (18)
Drawdown Limiter EA You are in the right place if you were searching for Drawdown control, Drawdown limiter, Balance protection, Equity Protection or Daily Drawdown Limit related to Prop Firm, FTMO, or Funded account trading, or if you want to protect your trading account. Have you suffered from controlling your drawdown when trading funded accounts? This EA is meant for you. Prop firms usually set a rule called “Trader Daily Drawdown”, and if it is not respected, you are disqualified.  I am an
Asistente: Asistente comercial MT4 (haga clic para descargar) Asistente comercial MT5 (haga clic para descargar) Lea atentamente las instrucciones de uso. Lo esencial: Apertura y cierre rápido de posiciones, apertura y cierre de posiciones con un solo clic, colocación de órdenes con un solo clic Comercio de línea de dibujo Sl/tp automático Símbolos de cierre Ganancias protegidas Mover SL Protect SL de seguimiento Control de riesgo de la cuenta La sombra del orden Añadir pedidos automá
Mentfx Mmanage mt5
Anton Jere Calmes
4.25 (8)
The added video will showcase all functionality, effectiveness, and uses of the trade manager. Drag and Drop Trade Manager. Draw your entry and have the tool calculate the rest. Advanced targeting and close portions of a trade directly available in tool (manage trades while you sleep). Market order or limit order on either side with factored spread. Just draw the entry, the tool does the rest. Hotkey setup to make it simple. Draw where you want to enter, and the stop loss, the tool calculates al
Time saving and fast execution Whether you’re traveling or sleeping, always know that Telegram To MT5 performs the trades for you. In other words, Our   Telegram MT5 Signal Trader  will analyze the trading signals you receive on your selected Telegram channels and execute them to your Telegram to MT5 account. Reduce The Risk Telegram To Mt5   defines the whole experience of copying signals from   Telegram signal copier to MT5 platforms. Users not only can follow all instructions from the signa
El kit de herramientas de acción del precio EA está diseñado principalmente para revendedores, pero se puede usar en todos los marcos de tiempo para ingresar rápidamente al mercado con un tamaño de lote calculado correctamente en función de su nivel de parada. Le permite ingresar operaciones rápidamente (al instante o en velas altas y bajas con pendientes). órdenes) y luego ajustar las paradas y tomar ganancias a medida que se mueve el mercado. Para obtener una lista completa de todas las fun
The  Easy Strategy Builder (ESB)  is a " Do It Yourself " solution that allows you to create a wide range of the automated trading strategies without any line of codes. This is the world’s easiest method to automate your strategies that can be used in STP, ECN and FIFO brokers. No drag and drop is needed. Just by set conditions of your trading strategy and change settings on desired values and let it work in your account. ESB has hundreds of modules to define unlimited possibilities of strategi
Trading Chaos Expert
Gennadiy Stanilevych
5 (10)
Este producto de programa no tiene análogos en el mundo, ya que se trata de un "mando de control" universal de operaciones comerciales, comenzando desde la obtención de las señales comerciales, la automatización de la entrada en la posición, el establecimiento de stop loss y take profit, así como de trailing de beneficio de multitud de transacciones simultáneamente en una ventana abierta. Gestión intuitiva y comprensible del experto en "tres clicks" en la pantalla del monitor, permite utilizar a
Gmail to MT5
Nguyen Hoang Phu
Gmail to MT5 is a tool that automates the process of transferring trading signals from your Gmail inbox directly to your MetaTrader 5 trading platform. It's a bridge that connects these two platforms, allowing you to receive and execute trades based on information sent via email. No DLL, no .exe, and no external software Can receive TradingView signals Would you like more features? We'd be glad to implement them based on your needs How to set up: Create an app password at https://myaccount.goog
Trader Evolution
Siarhei Vashchylka
5 (4)
" Trader Evolution " - A utility designed for traders who use wave and technical analysis in their work. One tab of the utility is capable of money management and opening orders, and the other can help in making Elliott wave and technical analysis. Manual (Be sure to read before purchasing) | Version for MT4 Advantages 1. Trading in a few clicks. Immediate and pending orders are available in the panel 2. Money management. The program automatically selects the appropriate lot size 3. Simpli
Designed for automated trading on the Nasdaq (US100, USTEC, NAS100, NDX100, etc.). It will not work on other assets! To correctly   test, it is necessary to configure the TesterTimeShift parameter.  TesterTimeShift   is the time difference in hours between the terminal time and the time in the visual mode of the strategy tester. This is based on research by BIASMACHINE And the related Telegram notification service . It uses statistical patterns identified in the research to find and plac
Otros productos de este autor
RSI divergence indicator finds divergences between price chart and   RSI   indicator and informs you with alerts (popup, mobile notification or email). Its main use is to find trend reversals in the chart. Always use the divergence indicators with other technical assets like support resistance zones, candlestick patterns and price action to have a higher possibility to find trend reversals. Three confirmation type for   RSI   divergences: RSI   line cross 50 level Price returns to previous H/L C
FREE
Advanced Indicator Scanner is a multi-symbol multi-timeframe scanner that works with hundreds of custom indicators available across the web including mql5 website market and codebase indicators. Advanced Indicator Scanner features: Scans your indicator in 28 customizable instruments and 9 timeframes. Monitors up to 2 lines(buffers) of an indicator. Showing of indicator value on buttons. You can choose between 3 alert modes:  Single symbol and timeframe Multiple timeframes of a symbol Multipl
MACD divergence indicator finds divergences between price chart and MACD indicator and informs you with alerts (popup, mobile notification or email) . Its main use is to find trend reversals in the chart. Always use the divergence indicators with other technical assets like support resistance zones, candlestick patterns and price action to have a higher possibility to find trend reversals. Three confirmation type for MACD divergences: MACD line cross zero level Price returns to previous H/L Crea
FREE
RSI divergence indicator finds divergences between price chart and RSI   indicator and informs you with alerts (popup, mobile notification or email). Its main use is to find trend reversals in the chart. Always use the divergence indicators with other technical assets like support resistance zones, candlestick patterns and price action to have a higher possibility to find trend reversals. Three confirmation type for RSI   divergences: RSI   line cross 50 level (doesn't repaint) Price returns to
FREE
Ichimoku Trend Alert is the Ichimoku Kinko Hyo indicator with Alerts and signal filters. Ichimoku Trend Alert features: Optional check of Ichimoku cloud, Tenkan sen(Conversion Line), Kijun sen(Base Line), Senkou span A, Senkou span B, and Chikou span relative to price, and more. Popup, email, and phone notification alerts for selected symbols and timeframes. There are 9 classic Ichimoku trend filters you can enable/disable in settings: Price/Cloud Order:   Checks the price position relative
FREE
RSI Divergence Scanner is a multi-timeframe and multi-symbol dashboard and alert that checks all timeframes and symbols to find divergences between price chart and RSI indicator. This divergence scanner is integrated with support and resistance zones so you can check the RSI divergences in the most important areas of the chart to find trend reversals in the price chart. Download demo version   (works on M 1,M5,M30,W1 timeframes) Full description of scanner parameters ->   click here . How to get
40% off. Original price: $50 Support and Resistance Dashboard for MT5 is a multi-timeframe and multi-symbol scanner and alert system that finds S/R zones and pivot points for all timeframes and symbols and alerts when price has interaction with them. If you are using support and resistance (or supply and demand) zones in your trading strategy, this dashboard and its alert and filtering system is a big time saver for you. Download demo version   (works on M4,M5,M6,M12,H3,H8 timeframes) Full desc
40% off. Original price: $50 Support and Resistance Dashboard for MT4 is a multi-timeframe and multi-symbol scanner and alert system that finds S/R zones and pivot points for all timeframes and symbols and alerts when price has interaction with them. If you are using support and resistance (or supply and demand) zones in your trading strategy, this dashboard and its alert and filtering system is a big time saver for you. Download demo version   (works on M 1,M5,M30,W1   timeframes) Full descrip
Moving Average Trend Alert is a triple MA indicator that helps traders to identify potential market trends based on 3 MAs alignment and crossover. Moving Average Trend Alert features: Customizable short-term, medium-term, and long-term MAs. Option to filter signals based on a minimum distance between moving averages to avoid premature MAs alignment. Optional Filter of signals with RSI indicator overbought/oversold levels. Optional Filter of signals with ADX indicator. Popup, email, and phone n
FREE
50% off. Original price: $60 Candlestick Pattern Scanner is a multi-timeframe and multi-symbol dashboard and alert system that checks all timeframes and currency pairs for different candlestick patterns that are formed in them. Scanner is integrated with support and resistance zones so you can check the candlestick patterns in the most important areas of the chart to find breakout and reversal patterns in the price chart. Download demo version   (works on M1,M5,M30,W1 timeframes) Read the full
25% off. Original price: $40 Stochastic Scanner is a multi symbol multi timeframe Stochastic dashboard that monitors the indicator for price entering and exiting overbought and oversold in up to 28 symbols and 9 timeframes. Download Demo here  (Scans only M1 and M5) Settings description   here MT5 version   here Stochastic Scanner features: Signals price entering and exiting the overbought and oversold zones. Monitors up to 28 customizable instruments and 9 timeframes at the same time. You
40% off. Original price: $50 Advanced Bollinger Bands Scanner is a multi symbol multi timeframe Bollinger bands dashboard that monitors and analyzes the Bollinger Bands indicator from one chart. This panel scans the Bollinger bands indicator in up to 28 configurable instruments and 9 timeframes for price overbought/oversold, price consolidation (Bollinger bands squeeze), and consolidation breakout (squeeze break)  with a deep scan feature to scan all market watch symbols (up to 1000 instrumen
Ichimoku Trend Alert is the Ichimoku Kinko Hyo indicator with Alerts and signal filters. Ichimoku Trend Alert features: Optional check of Ichimoku cloud, Tenkan sen(Conversion Line), Kijun sen(Base Line), Senkou span A, Senkou span B, and Chikou span relative to price, and more. Popup, email, and phone notification alerts for selected symbols and timeframes. There are 9 classic Ichimoku trend filters you can enable/disable in settings: Price/Cloud Order: Checks the price position relative to
FREE
50% off. Original price: $60 Ichimoku Assistant is a multi-timeframe panel and alert system that scans all timeframes for multiple rules related to different ichimoku strategies. The Ichimoku indicator has 5 different lines, including Tenkan-sen, Kijun-sen, Senku Span A, Senku Span B and Chikou Span. This scanner checks the status of these lines compared to each other and gives alerts based on your selected rules. If you are using ichimoku kinko hyo in your trading strategy, this scanner and it
40% off. Original price: $50 Ichimoku Trend Finder is a multi symbol multi timeframe trend dashboard that helps traders to monitor and identify potential market trends from one chart. This panel scans the Ichimoku Kinko Hyo indicator in 28 configurable instruments and 9 timeframes for classic Ichimoku trend signals  with a deep scan feature to scan all market watch symbols (up to 1000 instruments!).    Download Demo here  (Scans only M1 and M5) Settings description   here MT5 version   here
40% off. Original price: $50 Ichimoku Trend Finder is a multi symbol multi timeframe trend dashboard that helps traders to monitor and identify potential market trends from one chart. This panel scans the Ichimoku Kinko Hyo indicator in 28 configurable instruments and 9 timeframes for classic Ichimoku trend signals with a deep scan feature to scan all market watch symbols (up to 1000 instruments!).     Download Demo here  (Scans only M1 and M6) Settings description   here MT4 version   here
MACD divergence indicator finds divergences between price chart and MACD indicator and informs you with alerts (popup, mobile notification or email). Its main use is to find trend reversals in the chart. Always use the divergence indicators with other technical assets like support resistance zones, candlestick patterns and price action to have a higher possibility to find trend reversals. Three confirmation type for MACD divergences: MACD line cross zero level Price returns to previous H/L Creat
FREE
MACD Divergence Scanner is a multi-timeframe and multi-symbol dashboard and alert that checks all timeframes and symbols to find regular and hidden divergences between price chart and MACD indicator. This divergence scanner is integrated   with support and resistance zones so you can check the MACD divergences in the most important areas of the chart to find trend reversals in the price chart. Download demo version   (works on M4,M5,M6,M12,H3,H8 timeframes) Full description of scanner parameters
50% off. Original price: $60 Candlestick Pattern Scanner is a multi-timeframe and multi-symbol dashboard and alert system that checks all timeframes and currency pairs for different candlestick patterns that are formed in them. Scanner is integrated   with support and resistance zones so you can check the candlestick patterns in most important areas of the chart to find breakout and reversal patterns in the price chart. Download demo version   (works on M4,M5,M6,M12,H3,H8 timeframes) Read the f
50% off. Original price: $375 Reward Multiplier is a semi-automatic trade manager based on pyramid trading that opens additional orders with the running profit of your trades to maximize return exponentially without increasing the risk. Unlike other similar EAs, this tool shows potential profit/loss and reward to risk ratio before even entering the first trade! Download Demo here  (starting lot is fixed at 0.01) Guide + tips here MT5 version   here You only open the first order. When your
40% off. Original price: $50 Moving Average Trend Scanner is a multi symbol multi timeframe triple MA crossover dashboard that helps traders to monitor, and identify potential market trends from one chart. This panel scans 3 moving averages in up to 28 configurable instruments and 9 timeframes for triple moving average alignment and moving average crossover  with a deep scan feature to scan all market watch symbols (up to 1000 instruments!). Download Demo here  (Scans only M1 and M5) Settin
50% off. Original price: $60 Order Manager is a trade assistant and trade copier with a money manager that helps traders open, modify and close manual trades and also copy their trades between multiple accounts in the most simple way to help them focus more on their market analysis and open orders with just a few clicks. Download Demo here  (It only works on demo accounts) Full guide   here MT5 version here Order Manager features: Works on all instruments such as currency pairs, indexes, CF
Moving Average Trend Alert is a triple MA indicator that helps traders to identify potential market trends based on 3 MAs alignment and crossover. Moving Average Trend Alert features: Customizable short-term, medium-term, and long-term MAs. Option to filter signals based on a minimum distance between moving averages to avoid premature MAs alignment. Optional Filter of signals with RSI indicator overbought/oversold levels. Optional Filter of signals with ADX indicator. Popup, email, and phone n
FREE
Reward Multiplier is a semi-automatic trade manager based on pyramid trading that opens additional orders with the running profit of your trades to maximize return exponentially without increasing the risk.Unlike other similar EAs, this tool shows potential profit/loss and reward to risk ratio before even entering the first trade! Download full version here  ( In the mini version. Starting lot is fixed at 0.01 (or minimum allowed lot size ) Guide + tips here MT4 version   here You only open the
FREE
50% off. Original price: $60 Support and Resistance zones indicator for MT4 is a multi-timeframe panel and alert that finds support and resistance zones and pivot points for all timeframes of MetaTrader 4 and gives alert when price has interaction with them. Download demo version (works on GBPUSD, EURJPY and NZDUSD symbols) Read the full description of scanner parameters in the blog page . Many unique features in one indicator: Integrating support and resistance zones and pivot points in one
40% off. Original price: $50 Moving Average Trend Scanner is a multi symbol multi timeframe triple MA crossover dashboard that helps traders to monitor, and identify potential market trends from one chart. This panel scans 3 moving averages in up to 28 configurable instruments and 9 timeframes for triple moving average alignment and moving average crossover with a deep scan feature to scan all market watch symbols (up to 1000 instruments!).   Download Demo   here   (Scans only M1 and M6) Sett
25% off. Original price: $40 RSI Scanner is a multi symbol multi timeframe RSI dashboard that monitors Relative Strength Index indicator for price entering and exiting overbought and oversold in up to 28 symbols and 9 timeframes. Download Demo here  (Scans only M1 and M5) Settings description   here MT5 version   here RSI Scanner features: Signals RSI entering and exiting the overbought and oversold zones. Monitors 28 customizable instruments and 9 timeframes at the same time. You can choos
40% off. Original price: $50 ATR Scanner Pro is a multi symbol multi timeframe volatility scanner that monitors and analyzes Average True Range indicator value in up to 28 symbols and 9 timeframes in 3 modes : ATR value:   As a volatility dashboard it shows the ATR indicator value in all pairs and timeframes and signals when the ATR value reaches a maximum or minimum in a given duration. Short term ATR/Long term ATR ratio:  It shows ratio of 2 ATRs with different periods. It's useful in detec
Reward Multiplier is a semi-automatic trade manager based on pyramid trading that opens additional orders with the running profit of your trades to maximize return exponentially without increasing the risk. Unlike other similar EAs, this tool shows potential profit/loss and reward to risk ratio before even entering the first trade! Download full version here  ( In the mini version. Starting lot is fixed at 0.01 (or minimum allowed lot size ) Guide + tips here MT5 version   here You only open the
FREE
50% off. Original price: $60 Order Manager is a trade assistant and trade copier with a money manager that helps traders open, modify and close manual trades and also copy their trades between multiple accounts in the most simple way to help them focus more on their market analysis and open orders with just a few clicks. Download Demo here  (It only works on demo accounts for 14 days) Full guide   here MT4 version here Order Manager features: Works on all instruments such as currency pairs,
Filtro:
Vladimir Shramchenko
446
Vladimir Shramchenko 2024.10.17 11:04 
 

Thank you for your hard work. A very high-quality product that shows the rapidly turning formations of the market. And you can quickly apply it in your Trading System.

JAMTRADERS
36
JAMTRADERS 2024.05.30 11:34 
 

great tool for traders who use RSI divergence as tool when trading. very easy to use and it lessen my time scanning the market for possible entry

(less time scanning---->less stress--->less emotion----->GOOD TRADING)

thank you so much sir

simon.metivier
76
simon.metivier 2024.03.06 01:29 
 

It's a wonderful tool, it helps saving me a lot of time looking for divergence on multiple instruments with several Timeframe on each. I am using divergences without confirmation and all are spot on everytime and pop instantly at the close of the candle. If there was one thing I'd like to add, it would be the possibility to receive alert for divergences without confirmation and (at the same time) with confirmation (Candlestick Pattern or another type). Because I like to work and see which type of confirmation is best for working indices. Again thanks for your great work.

Amir Atif
71504
Respuesta del desarrollador Amir Atif 2024.03.07 16:55
Hi Simon
Thank you for your positive feedback.
Adding an option to select 2 Confirmation type at the same time makes thing very complicated from the programming aspects. But you can run the scanner on 2 separate chart with different settings, it may slow down the scanners but is useful for finding the best settings for divergence signals.
Regards
Adama Diop
403
Adama Diop 2023.01.24 03:36 
 

Hi sir, where can I find the updated version? Mine doesn't show all the symbols I input ad it also doesn't show arrows or open chart when I click on it. Thanks

Amir Atif
71504
Respuesta del desarrollador Amir Atif 2023.01.24 08:33
Hi Adama
For updating the scanner delete the previous version then install the new one. For loading your symbols, change the "Load symbols from" parameter and give the scanner enough time to load the history data for all symbols and timeframes, then click on cells to open the new chart and load divergence arrow and lines.
Please let me know if there are any problems.
Regards
Onuoha Osisioma
25
Onuoha Osisioma 2022.12.28 11:52 
 

a very expensive mistake of an application. would seriously want my money refunded to be frank and sincere. sent a mssg to mr atif. no response from him

Amir Atif
71504
Respuesta del desarrollador Amir Atif 2022.12.28 13:56
Hi, I responded to your message 6 hours after you sent the message to me and gave you full instructions for solving your problem.
Looks like you don't check your messages. I'll attach the screenshot of my response in the comment section.
Regards
Ajuda Conf
28
Ajuda Conf 2022.10.05 17:23 
 

Powerful scan, I've adjusted the parameters for my operative and I'm making money from the market with the tool. It is very valuable, you will not regret it. Thank you very much.

Respuesta al comentario
Versión 7.1 2024.06.23
! A few bug fixes for options that were added in the last version.
Versión 7.0 2024.05.30
+ "Hidden Divergence Ratios" section added to define the shape of the hidden divergence (like "Regular Divergence Ratios" section for regular divergences).
+ "Max. divergence candles" and "Min. divergence candles" options added to define the minimum and maximum time range of the divergences.
+ Now you can choose to calculate the ZigZag indicator with the close price of candles instead of the high and low prices. (experimental)
+ Minor bug fixes and improvements.
Versión 6.3 2023.11.02
+ The option “Mark divergences that happen after a long trend” added to the dashboard (for “Check trend length for regular divergences” parameter).
+ Improvement in detecting divergences with “Stochastic indicator” confirmation type.
+ Minor bug fixes and improvements.
Versión 6.2 2023.10.16
+ "Stochastic indicator" added for confirming the divergences, now you can choose to receive alert when the stochastic indicator lines cross each other. Also, you can set that the crossing must be in the overbought/oversold levels of the stochastic indicator.
+ Average body filter (for 2-bar and 3-bar patterns) and average height filter (for 1-bar patterns) parameters added to the dashboard, by enabling these filters you can set the dashboard to show only divergences that confirm by big size candlestick patterns.
+ Now you can use dashboard signals in your EAs. If you set the dashboard to show the divergences in new charts, then you can use the divergence information embedded in the Arrow name in your EA.
+ Now you can set the dashboard to mark the divergences that happen after a long trend (with L letter).
Versión 6.1 2023.09.19
+ Stochastic indicator confirmation type added to the scanner. By selecting this option, divergence will confirm when Stochastic lines cross each other. You also can choose that lines cross must be in overbought or oversell levels.
+ "Confirm with Candlestick Patterns before other confirmations" option added to the scanner, by enabling it the divergences must first be confirmed by candlestick patterns, then confirm by selected confirmation type.
+ Fixed a bug in detecting candlestick patterns.
Versión 6.0 2023.09.05
+ Candlestick patterns (10 patterns) added to "Confirmation type" parameter, with this option divergence will be confirmed if a candlestick pattern forms after it.
+ Now you can filter divergences with 2 Moving Average indicators from same or upper timeframes, you can set timeframe and period of these MAs separately for each timeframe of the dashboard.
+ You can reverse the Moving Average filters and find divergences that are in the opposite direction of the MA, also you can set for each filter to be applied to which type of divergence (regular, hidden or both), also the filters can be reversed separately.
+ An option added to the dashboard to not remove the failed divergences from the dashboard, it is useful when you want to practice the divergence trading.
+ Now you can choose what information to see on the dashboard cells: “Divergence type, candles passed” or “Divergence type, divergence direction, candles passed” or “Compact detailed info”.
+ A parameter added to the scanner to use a second ZigZag indicator for detecting more divergences. Enabling this parameter slows down the scanner, so use it if you are loading a limited number of symbols and timeframes in the dashboard.
- Some bug fixes and other improvements.
Versión 5.2 2023.03.24
Fixed a bug in changing the cell colors for S/R zones in the previous update.
Versión 5.1 2023.02.23
+ Added Moving Average indicator filter, you can now set the scanner to find divergences based on the direction of the moving average and/or the position of the divergence relative to the MA.
- Fixed a bug in loading symbols from the symbol list when the symbol names have lowercase letters.
Versión 5.0 2023.02.22
+ Now you can set the scanner to only find divergences that happen at the end of a long trend.
+ Two new confirmation type ("Changing the color of Heiken Ashi indicator" and "Strong Reversing Candle") added to the scanner and "New zigzag leg" confirmation type removed from the scanner.
+ Two filters (and their parameters) added for detecting the strong reversing candle.
+ You can choose to show the divergence lines and arrow on the opened charts with custom chart template (in addition to the default chart template).
+ Minor improvements and bug fixes.
Versión 4.0 2023.01.14
+ "Max. divergence pullback percent (Fibonacci retracement)" option added to the scanner, with this option you can set the maximum acceptable percent for the last pullback in the trend.
+ "Min. length ratio (last wave/previous wave)" options added to the scanner, with this parameter you can define the minimum acceptable length of the last wave of the trend compared to the length of the wave before it.
+ "Max. length ratio (last wave/previous wave)" options added to the scanner, with this parameter you can define the maximum acceptable length of the last wave of the trend compared to the length of the wave before it.
+ "Min. time ratio (last wave/previous wave)" parameter added to the scanner, with this parameter you can define the minimum acceptable duration of the last wave of the trend compared to the duration of the wave before it.
+ "Max. time ratio (last wave/previous wave)" parameter added to the scanner, with this parameter you can define the maximum acceptable duration of the last wave of the trend compared to the duration of the wave before it.
+ Improving the dashboard appearance.
- Fixing a bug where sometimes the dashboard didn't send immediate alert for new divergences.
Versión 3.6 2022.12.20
- "Min. divergence pullback percent (Fibonacci retracement)" option added to the scanner, this option helps to filter out regular divergences caused by small pullbacks in the trend.
- "Cell background color" option added for the dashboard.
Versión 3.5 2022.12.07
+ You can select for each symbol to alert only bullish or bearish divergences by clicking on its cell on dashboard.
+ Panel cells show the strength of divergences (weak, medium, strong).
+ Panel cells show when divergence happens in RSI oversold/overbought levels (by showing O letter in the cell).
+ You can see divergence lines for both price and RSI indicator when checking divergences in new charts.
+ You can see nearest support and resistance zones when checking divergences in new charts to see the price distance to S/R levels.
Versión 3.4 2022.10.29
+ A parameter added to enabling alerts for selected timeframes on startup of dashboard.
Versión 3.3 2022.09.28
+ Now you can split the symbols into 3 columns for showing more symbols in the dashboard on a single chart.
! Fixed a bug in receiving alerts when selecting “No Confirmation” option in the confirmation type parameter.
Versión 3.2 2022.09.10
Added a parameter to automatically open divergence chart after detecting the divergence, without clicking on dashboard cell.
Versión 3.1 2022.09.04
+ Added an option to receive alert immediately after divergence detected by scanner (before any confirmation, this may create repeated alerts).
Versión 3.0 2022.08.24
+ Finding hidden divergences added to the scanner.
+ Now you can load a custom chart template when clicking on the dashboard cells.
! Fixed a bug in showing the zones when MetaTrader starts up.
Versión 2.2 2022.06.28
Fixed a bug in splitting symbols into 2 columns.
Versión 2.1 2022.06.27
“Split symbols in 2 columns” option added to parameters, now you can show more symbols in dashboard on a single chart.