• Información general
  • Comentarios
  • Discusión (1)
  • Novedades

Traders Inside Volume Profile VPR

Volume Profile Indicator used by professional Traders at Traders Inside Ltd.

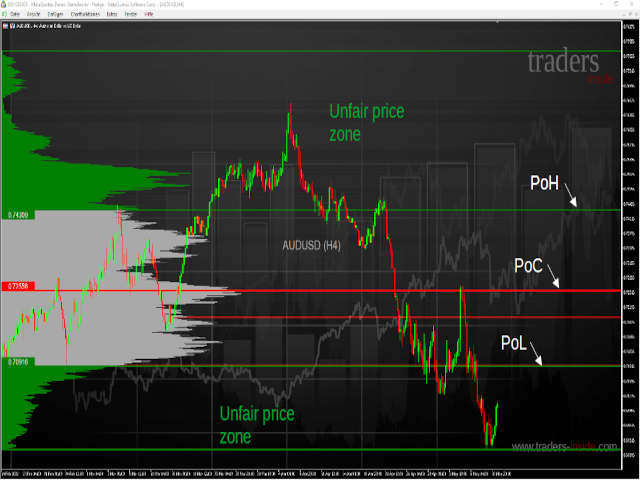
If you want to succeed in trading you need to know if current price is cheap, expensive or fair valued.

Key features:

  • Fair price (Point of control, POC), high and low price zones (POH, POL)
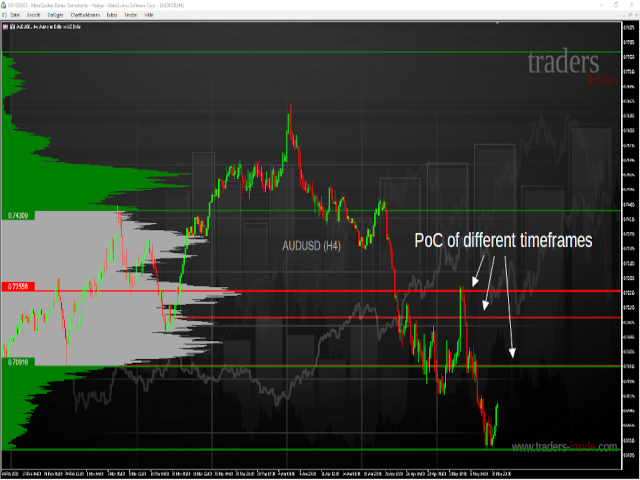
  • POC in different timeframes for better orientation
  • Symbol and timeframe
  • Chart resize on open positions/orders, VPRmax/min
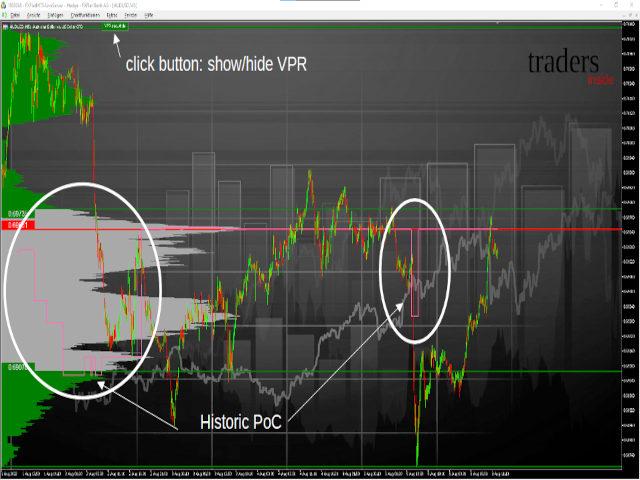
  • Historic POC - see, how POC has changed the last periods
  • Button to show/hide VPR

Calculated Bars (best results) - you can change it in indicator settings:

  • M1: 1440
  • M5: 1440
  • M30: 500
  • H1: 1440
  • H4: 1440
  • Daily: 660
  • Weekly: 260
  • Monthly: 120

If you want to learn how to trade volume profile like professionals visit https://www.traders-inside.com.

Productos recomendados
HiLo Activator Plus
Rodrigo Galeote
5 (1)
HiLo Activator es uno de los indicadores más utilizados para determinar tendencia. Encuéntrelo aquí esta versión personalizada de Gekko con la capacidad de personalizar el período y los colores. Este indicador también traza flechas hacia arriba y hacia abajo cuando hay un cambio en la tendencia, lo que indica puntos de entrada y salida muy fuertes HiLo se adapta bien a diferentes tipos de períodos para la negociación intradiaro. Puedes entender fácilmente cuándo es el momento de comprar o vender
Volume Speedometer
Flavio Javier Jarabeck
Imagine the ability to have Volume Speed second by second presented to you in the form of a speedometer... Well, imagine no more... Welcome to the new Minions Labs creation: Volume Speedometer . Volume Speedometer is a Minions Labs idea that was born trying to show in realtime what is happening with the Volume Flow of orders (or Ticks, if you don't have that) during the day. This indicator was created to be used in Intraday trading and the goal is to give you a "heads up" when the Volume flow is
XCalper HiLo Activator
Aecio de Feo Flora Neto
HiLo Activator v1.02 by xCalper The HiLo Activator is similar to moving average of previous highs and lows. It is a trend-following indicator used to display market’s direction of movement. The indicator is responsible for entry signals and also helps determine stop-loss levels. The HiLo Activator was first introduced by Robert Krausz in the Feb. 1998 issue of Stocks & Commodities Magazine.
Supply and Demand Monster
Tsog Erdene Borjigon Enkhkhudulmur
Supply and demand zones are at the heart of   supply and demand trading . These zones are areas that show  liquidity at a specific price.  The supply zone is also called the distribution zone, while the demand zone is called the accumulation zone.   Our indicator automatically draw supply and demand zones in Metatrader 5. It give opportunity to understand trading zone and avoiding risk.
Extrend
Ignacio Agustin Mene Franco
Extrend !  es un indicador oscilador ,  Donde mide las tendencias alcistas y bajistas  ideal para hacer scalping y largos !  la estrategia consta de el cruce de lineas ,  donde lleva 2 tipos de lineas , una azul y una verde ! donde la linea azul da el cruce por arriba de la verde  da señal de entrada ,  donde la linea verde cruza por abajo la linea azul da señal de venta ! Sirve para todas las temporalidades !  Buen Profit ! World Inversor  . 
The moving average is the easiest indicator to recognize changes in the price of a currency. It is excellent to set multiple indicators for each period or type and see the transition. However, setting multiple moving averages is very troublesome, isn't it? Moreover, displaying multiple currency pairs will increase the time and effort. It is an indicator that saves you the trouble. You can display multiple moving averages at once. You can freely set up to 4 lines, line thickness, color a
Based on the Dow Theory, the system automatically draws a turning point, which is the starting point for buying or selling. It also automatically tells you whether the market is in a buying or selling condition and recognizes the environment. It is also a good tool to prevent false trades and to make profitable trades. We are live-streaming the actual operation of the system. Please check for yourself if it is usable. Please check it out for yourself. https://www.youtube.com/@ganesha_forex We
[ MT4 Version ]   [ Kill Zones ]  [ SMT Divergences ] How to trade using Order Blocks:  Click here Experience the ultimate in trading precision with the  Order Blocks ICT  indicator, designed to empower traders with unparalleled insights into market dynamics. This advanced tool leverages order flow and volume analysis to reveal crucial buying and selling pressures driving price action. Why Choose Order Blocks ICT? Unleash Market Insights: Order Flow Analysis:  Discern buying and selling pressure
EA de Monte Carlo en Seguimiento de Tendencias para Beneficio Continuo No se ha aplicado una optimización excesiva mediante IA o numerosos filtros. Información Básica Par de Divisas:  SILVER  (XAGUSD) Estilo de Trading:   Trading Diario Número Máximo de Posiciones:   1 ( Si el lote de entrada excede el lote máximo por posición establecido por el corredor, el lote de entrada se dividirá en múltiples posiciones.) Tamaño Máximo del Lote:   Según las regulaciones del corredor Marco de Tiempo Utiliz
Master Calendar Osw
William Oswaldo Mayorga Urduy
MASTER CALENDAR OSW Este Indicador fue creado inicialmente para mi uso personal, pero lo he ido mejorando poco a poco e implementando funciones para ayudas de mi trading del día a día y se seguirán implementando funciones si son de utilidad. DETALLES DEL CALENDARIO. >Calendario móvil y detallado de las noticias cercanas a la fecha actual, con datos como: fecha, País, Moneda, Sector de la noticia, Nombre de la Noticia, y datos Previo, Predicción y Actual. >El Calendario se actualiza automáticamen
Vice Trend Analyzer
Joseph Njuguna Njeri
Presentando el Indicador Sniper de Tendencias Definitivo para MetaTrader 5 (MT5) Alcanza entradas precisas y maximiza tus ganancias con nuestro indicador de última generación Lleva tu trading al siguiente nivel con el Indicador Sniper de Tendencias , una herramienta avanzada diseñada para traders que buscan tanto precisión como profundidad en su análisis. Este poderoso indicador utiliza algoritmos matemáticos únicos para identificar las tendencias más fuertes del mercado, ofreciéndote puntos de
Setup 9.1 strategy created by the North American trader Larry Williams . SIMPLE setup, effective, with a good level of accuracy and excellent return. Attention : The Demo version only works on the tester, if you are interested in running it in real time, please contact me and I will provide another version. Buy Signal: Exponential moving average of 9 (MME9) is falling, wait it to TURN UP (in closed candle). Place a buy stop order 1 tick above the HIGH of the candle that caused the turn to occur.
Aroon Precision Trends MT5
Maestri Investment Group Ltd.
Introducing the Aroon Indicator - Your Ultimate Trend Analysis Tool! Are you looking to take your trading game to the next level? Want to identify lucrative entry and exit points in the financial markets with ease? Look no further! The Aroon Indicator is here to revolutionize your trading strategy and help you make informed decisions like never before. Developed by the brilliant mind of Tushar Chande, the Aroon Indicator is a powerful technical analysis tool designed to measure the strength a
Atomic Analyst MT5
Issam Kassas
4.32 (19)
En primer lugar, vale la pena enfatizar que este Indicador de Trading no repinta, no redibuja y no se retrasa, lo que lo hace ideal tanto para el trading manual como para el automatizado. Manual del usuario: configuraciones, entradas y estrategia. El Analista Atómico es un Indicador de Acción del Precio PA que utiliza la fuerza y el impulso del precio para encontrar una mejor ventaja en el mercado. Equipado con filtros avanzados que ayudan a eliminar ruidos y señales falsas, y aumentan el poten
Recognizer 1 2 3 Patterns
Gennadiy Stanilevych
5 (2)
Este indicador está destinado para reconocer y marcar en el gráfico 1-2-3 patrones de compra y de venta. El indicador ayudará al trader a detectar los fractales de inicio y de señal, indicar los posibles puntos de entrada en el mercado en todos los períodos de tiempo del programa МetaTrader 5. En el gráfico se dibujan las líneas de Fibonachi que indican supuestos objetivos del movimiento partiendo de la teoría de ondas. Las formaciones 1-2-3 adquieren una especial importancia después de la forma
WanaScalper
Isaac Wanasolo
1 (1)
A scalping indicator based on mathematical patterns, which on average gives signals with relatively small SL, and also occasionally helps to catch big moves in the markets (more information in the video) This indicator has three main types of notifications: The first type warns of a possible/upcoming signal on the next bar The second type indicates the presence of a ready signal to enter the market/open a position The third type is for SL and TP levels - you will be notified every time price re
Volunacci MT5
Mohammed Kaddour
Volonacci Indicator It is an indicator that combines Fibonacci and volume to determine the price direction This indicator helps you identify Fibonacci angles according to the strategy The Volonacci indicator is indeed an interesting combination of Fibonacci levels and volume. This indicator uses Fibonacci tools to identify potential support and resistance levels, and enhances this by using volume to confirm the strength behind the price action. MT4 Version  https://www.mql5.com/en/market/produ
Noize Absorption Index - is the manual trading system that measures the difference of pressure between bears forces and bulls forces. Green line - is a noize free index that showing curent situation. Zero value of index shows totally choppy/flat market.Values above zero level shows how powerfull bullish wave is and values below zero measures bearish forces.Up arrow appears on bearish market when it's ready to reverse, dn arrow appears on weak bullish market, as a result of reverse expectation.
El indicador Martinware Manual Trading Helper tiene como objetivo ayudar a las personas a comenzar sus vidas en el comercio manual. Se puede usar para mostrar algunas imágenes genéricas en el lado derecho del gráfico, donde se pueden mostrar observaciones operativas personalizadas o simplemente un rectángulo en blanco que oculta el gráfico mientras se realiza la prueba inversa. Además, puede reproducir periódicamente una lista de sonidos. Para mostrar un rectángulo en blanco, simplemente deje
FREE
Heiken Ashi Smoothed Strategy is a very simple but powerful system to get forex market trend direction. This indicator is actually 2 indicators in 1 pack, Heiken Ashi and Heiken Ashi Smoothed Moving Average both included. Because HA (Heiken Ashi) and HAS (Heiken Ashi Smoothed) are calculated in the same one system event with necessary buffers and loop only, so it is the FAST, OPTIMIZED and EFFICIENT HA having the combined indicator of MetaTrader 5. You can choose to display HA and HAS in the sam
Gold Step
Ignacio Agustin Mene Franco
Step Gold.  es un oscilador Echo para operar los indices sinteticos y forex  a nivel profesional , agarrando largas tendencias sea long o short  sirve para toda las temporalidades ,  tambien para hacer scalping ,  nivel muy bueno en los pares de crash y boom ,  volatilitys , jump  en los pares de forex , eur/usd usd/jpy , gbp/eur , aud/cad y demas !  cuando toca techo da señal a un short  cuando toca piso da señal a un long !  Disfrutenlo.
This indicator builds upon the previously posted Nadaraya-Watson smoothers. Here we have created an envelope indicator based on Kernel Smoothing with integrated alerts from crosses between the price and envelope extremities. Unlike the Nadaraya-Watson estimator, this indicator follows a contrarian methodology. Please note that by default this indicator can be subject to repainting. Users can use a non-repainting smoothing method available from the settings. The triangle labels are designed so
Multiple Timeframe MACD indicator. This indicator was built for making multiple timeframe analysis possible in MT5 using MACD Indicator. MACD Indicator traditionally shows two lines and one histogram. MACD Line(Yellow) is calculated by subtracting 12period EMA(fast) from 26period EMA (slow). Signal Line(Blue) is created by a 9period EMA from MACD Line. Histogram is just the difference between MACD and Signal lines. Histogram is colored based on the difference between its value and the previous h
El indicador Oferta Demanda RSJ PRO calcula y traza las zonas de "Oferta" y "Demanda" en el gráfico, identificando el tipo de Zona (Débil, Fuerte, Verificada, Probada) y en caso de reevaluaciones de la Zona muestra cuántas veces se volvió a probar. Las zonas de "oferta" son las zonas de precios donde se ha producido más oferta que demanda, lo que hace bajar los precios. Las zonas de "demanda" son las zonas de precios donde se ha producido más demanda que oferta, lo que hace subir los precios.
The "RMA Signal Indicator MT5" refers to an indicator called "RMA" (Running Moving Average) Signal Indicator designed specifically for the MetaTrader 5 (MT5) trading platform. The RMA is a variation of the Moving Average indicator that emphasizes recent price data. The specific details and functionality of the "RMA Signal Indicator MT5" may depend on the developer or the version you are using. However, in general, here is a general approach to using a signal indicator like RMA on the MT5 platfor
El indicador rastrea la tendencia en 5 tiempos de gráfico diferentes para el mismo activo, en base a 6 señales para cada tiempo de gráfico. El objetivo principal del indicador es mostrarnos la tendencia mayoritaria del activo financiero en el que se colocó. El sistema transmite la información de las tendencias en varios tiempos gráficos, de esta forma el usuario puede tener una visión amplia del movimiento del activo, este tipo de herramienta hace que el usuario tenga una mayor tasa de acierto
Best Tested Pairs :-  Step Index (Also can use on other pairs which spread is lowest) How does the Magic Storm work The Magic Storm will commence only if the Initial Trade becomes a losing trade. In case the initial trade is a profitable one, or has been closed by the trader there is no need for the Magic Stormto be initiated. Let’s assume that the initial trade was a 1 lot buy trade with Recovery Zone Range Pips is 50 and Recovery Zone Exit Pips is 150 pips. The take profit for this tr
¡El nivel Premium es un indicador único con más del 80% de precisión de predicciones correctas! ¡Este indicador ha sido probado por los mejores especialistas en comercio durante más de dos meses! ¡El indicador del autor no lo encontrarás en ningún otro lugar! ¡A partir de las capturas de pantalla, puede ver por sí mismo la precisión de esta herramienta! 1 es ideal para operar con opciones binarias con un tiempo de vencimiento de 1 vela. 2 funciona en todos los pares de divisas, acciones, m
SafeProfit Market Profile es el indicador de seguimiento más avanzado del mercado Forex. Fue desarrollado para rastrear el perfil de mercado de cada sesión del día: asiático, europeo y americano. Con este indicador operarás Intradía sonriendo ... sabiendo exactamente dónde están posicionados los Big Players y el momento exacto hacia donde se dirigen. El indicador es simple, rápido y objetivo, rastreando cada movimiento de los Grandes Jugadores en precio. Salga de la estadística del 95% que solo
Advanced 4xZeovo MT5 Indicator (MetaTrader 5)   Product Description  4xZeovo is a powerful trading indicator system monitoring 24/7 financial markets. Metatrader5 tool designed to find the best buying/selling opportunities and notifies the user.    Making life easy for traders in helping with the two most difficult decisions with the use of advanced innovate trading indicators aiming to encourage users to hold the winning positions and take profit at the best times.    Equipped with a unique tra
Los compradores de este producto también adquieren
Quantum TrendPulse
Bogdan Ion Puscasu
5 (11)
Presentamos   Quantum TrendPulse   , la herramienta de trading definitiva que combina el poder de   SuperTrend   ,   RSI   y   Stochastic   en un indicador integral para maximizar su potencial de trading. Diseñado para traders que buscan precisión y eficiencia, este indicador le ayuda a identificar tendencias del mercado, cambios de impulso y puntos de entrada y salida óptimos con confianza. Características principales: Integración con SuperTrend:   siga fácilmente la tendencia predominante del
TPSproTREND PrO MT5
Roman Podpora
4.6 (15)
TPSpro TREND PRO  - is a trend indicator that automatically analyzes the market and provides information about the trend and each of its changes, as well as giving signals for entering trades without redrawing! The indicator uses each candle, analyzing them separately. referring to different impulses - up or down impulse. Exact entry points into transactions for currencies, crypto, metals, stocks, indices!  ИНСТРУКЦИЯ RUS         INSTRUCTIONS  ENG       R ecommended to use with an indicator   -
Golden Trend Indicator MT5
Noha Mohamed Fathy Younes Badr
4.86 (14)
Golden Trend indicator  is The best indicator for predicting trend movement this indicator never lags and never repaints and never back paints    and give  arrow buy and sell    before the candle appear  and it will help you and  will make your trading decisions clearer its work on all currencies and  gold and crypto and all time frame This unique  indicator uses very secret algorithms to catch the  trends, so you can trade using this indicator and see the trend clear on charts  manual guide and
TPSpro RFI Levels MT5
Roman Podpora
4.71 (17)
INSTRUCCIONES       RUSO   -   ING        Se   recomienda utilizar con un indicador.       -       TPSpro   TENDENCIA PRO -   Versión MT5 Un elemento clave en el trading son las zonas o niveles desde los que se toman las decisiones de compra o venta de un instrumento de trading. A pesar de los intentos de los principales actores de ocultar su presencia en el mercado, inevitablemente dejan rastros. Nuestra tarea era aprender a identificar estos rastros e interpretarlos correctamente. Funciones p
Este es un genial indicador para MT5 que ofrece señales precisas para entrar en una transacción sin redibujar. Se puede aplicar a cualquier activo financiero: fórex, criptomonedas, metales, acciones, índices. Nos dará valoraciones bastante precisas y nos dirá cuándo es mejor abrir y cerra una transacción. Eche un vistazo  al vídeo  (6:22), ¡contiene un ejemplo de procesamiento de una sola señal que ha amortizado el indicador! La mayoría de los tráders mejoran sus resultados comerciales durante l
Ahora $ 147 (aumentando a $ 499 después de algunas actualizaciones) - Cuentas ilimitadas (PC o Mac) Manual de usuario de RelicusRoad + Videos de capacitación + Acceso al grupo privado de Discord + Estado VIP UNA NUEVA MANERA DE VER EL MERCADO RelicusRoad es el indicador comercial más poderoso del mundo para divisas, futuros, criptomonedas, acciones e índices, y brinda a los comerciantes toda la información y las herramientas que necesitan para mantenerse rentables. Brindamos análisis técnico
TPA True Price Action indicator reveals the true price action of the market makers through 100% non-repainting signals strictly at the close of a candle! TPA shows entries and re-entries, every time the bulls are definitely stronger than the bears and vice versa. Not to confuse with red/green candles. The shift of power gets confirmed at the earliest stage and is ONE exit strategy of several. There are available now two free parts of the TPA User Guide for our customers. The first "The Basics"
Was: $249  Now: $149   Market Profile defines a number of day types that can help the trader to determine market behaviour. A key feature is the Value Area, representing the range of price action where 70% of trading took place. Understanding the Value Area can give traders valuable insight into market direction and establish the higher odds trade. It is an excellent addition to any system you may be using. Inspired by Jim Dalton’s book “Mind Over Markets”, this indicator is designed to suit the
Blahtech Supply Demand MT5
Blahtech Limited
4.54 (13)
Was: $299  Now: $149  Supply Demand uses previous price action to identify potential imbalances between buyers and sellers. The key is to identify the better odds zones, not just the untouched ones. Blahtech Supply Demand indicator delivers functionality previously unavailable on any trading platform. This 4-in-1 indicator not only highlights the higher probability zones using a multi-criteria strength engine, but also combines it with multi-timeframe trend analysis, previously confirmed swings
Bill Williams Advanced
Siarhei Vashchylka
5 (9)
Bill Williams Advanced is designed for automatic chart analysis using Bill Williams' "Profitunity" system. The indicator analyzes four timeframes at once. Manual (Be sure to read before purchasing) Advantages 1. Automatically analyzes the chart using the "Profitunity" system of Bill Williams. The found signals are placed in a table in the corner of the screen. 2. Equipped with a trend filter based on the Alligator indicator. Most of the system signals are recommended to be used only according t
El indicador muestra la dirección de la tendencia de varios plazos en una ventana. Si la tendencia de varios plazos coincide, se dibujan flechas. También puede cambiar al histograma, que indica la tendencia en el plazo actual. El indicador dibuja puntos de entrada y puntos de salida aproximados en el gráfico. Advertencia: dado que el indicador es multi timeframe, cuando se utiliza en el probador de estrategias, las cotizaciones para todos los timeframes necesarios deben descargarse con antelac
Mega Spikes Max
Niccyril Chirindo
5 (1)
Are you tired of missing out on the biggest opportunities in Boom and Crash trading? Mega Spikes Max is your ultimate tool for dominating the markets, giving you the precision and confidence you need to succeed. Why Choose Mega Spikes Max? Stay Ahead with Real-Time Alerts Never miss a profitable trade again. Get instant notifications directly to your mobile or desktop when a spike is imminent, even if you're away from your screen. Accurate Spike Detection Engineered for pinpoint accuracy, Mega
AriBot
Arman Belassarov
AriMax   – AI-Powered Trading Robot AriMax is a cutting-edge AI-powered trading robot designed to help traders maximize profits while minimizing risk. Utilizing advanced machine learning algorithms and real-time market analysis, AriMax identifies high-probability trade opportunities with precision and speed. Key Features:     AI-Driven Market Analysis   – Analyzes market trends and patterns to make data-driven trading decisions.     Automated Execution   – Places trades seamlessly with optimiz
Trend Forecaster
Alexey Minkov
5 (6)
!SPECIAL SALE!  The Trend Forecaster indicator utilizes a unique proprietary algorithm to determine entry points for a breakout trading strategy. The indicator identifies price clusters, analyzes price movement near levels, and provides a signal when the price breaks through a level. The Trend Forecaster indicator is suitable for all financial assets, including currencies (Forex), metals, stocks, indices, and cryptocurrencies. You can also adjust the indicator to work on any time frames, althoug
Introduciendo       Quantum Breakout PRO   , el innovador indicador MQL5 que está transformando la forma en que comercia con Breakout Zones. Desarrollado por un equipo de comerciantes experimentados con experiencia comercial de más de 13 años,       Desglose cuántico PRO       está diseñado para impulsar su viaje comercial a nuevas alturas con su innovadora y dinámica estrategia de zona de ruptura. El indicador de ruptura cuántica le dará flechas de señal en las zonas de ruptura con 5 zonas ob
MetaForecast M5
Vahidreza Heidar Gholami
5 (2)
MetaForecast predice y visualiza el futuro de cualquier mercado basándose en las armonías de los datos de precios. Aunque el mercado no siempre es predecible, si existe un patrón en el precio, MetaForecast puede predecir el futuro con la mayor precisión posible. En comparación con otros productos similares, MetaForecast puede generar resultados más precisos al analizar las tendencias del mercado. Parámetros de entrada Past size (Tamaño del pasado) Especifica el número de barras que MetaForecast
TrendMaestro5
Stefano Frisetti
note: this indicator is for METATRADER4, if you want the version for METATRADER5 this is the link:  https://www.mql5.com/it/market/product/108106 TRENDMAESTRO ver 2.4 TRENDMAESTRO recognizes a new TREND in the bud, he never makes mistakes. The certainty of identifying a new TREND is priceless. DESCRIPTION TRENDMAESTRO identifies a new TREND in the bud, this indicator examines the volatility, volumes and momentum to identify the moment in which there is an explosion of one or more of these data a
Este es posiblemente el indicador de reconocimiento automático de formación de precios más completo que puede encontrar para la plataforma MetaTrader. Detecta 19 patrones diferentes, toma las proyecciones de Fibonacci tan en serio como usted, muestra la zona de reversión potencial (PRZ) y encuentra niveles adecuados de stop-loss y take-profit. [ Guía de instalación | Guía de actualización | Solución de problemas | FAQ | Todos los productos ] Detecta 19 formaciones de precios armónicos diferen
Volume by Price MT5
Brian Collard
3.25 (4)
The Volume by Price Indicator for MetaTrader 5 features Volume Profile and Market Profile TPO (Time Price Opportunity). Volume and TPO histogram bar and line charts. Volume Footprint charts. TPO letter and block marker collapsed and split structure charts. Static, dynamic and flexible range segmentation and compositing methods with relative and absolute visualizations. Session hours filtering and segment concatenation with Market Watch and custom user specifications. Graphical layering, positio
Royal Scalping Indicator M5
Vahidreza Heidar Gholami
5 (6)
Royal Scalping Indicator is an advanced price adaptive indicator designed to generate high-quality trading signals. Built-in multi-timeframe and multi-currency capabilities make it even more powerful to have configurations based on different symbols and timeframes. This indicator is perfect for scalp trades as well as swing trades. Royal Scalping is not just an indicator, but a trading strategy itself. Features Price Adaptive Trend Detector Algorithm Multi-Timeframe and Multi-Currency Trend Low
Royal Wave Pro M5
Vahidreza Heidar Gholami
3.5 (4)
Royal Wave is a Trend-Power oscillator which has been programmed to locate and signal low-risk entry and exit zones. Its core algorithm statistically analyzes the market and generates trading signals for overbought, oversold and low volatile areas. By using a well-designed alerting system, this indicator makes it easier to make proper decisions regarding where to enter and where to exit trades. Features Trend-Power Algorithm Low risk Entry Zones and Exit Zones Predictions for Overbought and Over
Seconds Charts
Aleksandr Goryachev
Micro  ******************* Секундные графики MT5 ********************** Более точного инструмента для входа в сделку вы не найдёте. Входные параметры: Timeframe, sek - период построения графика, секунды Displayed bars - отображаемые бары Step of price levels, pp, 0-off - шаг отрисовки ценовых уровней, пункты Scale points per bar, 0-off - масштаб в пунктах на бар Show lines - отображение текущих уровней Show comment - отображение комментария Standard color scheme - стандартная цветовая сх
PillowIndicator
Sergey Shevchenko
Si necesita un indicador que muestre los puntos de entrada al mercado, este es su indicador.  El indicador no se vuelve a dibujar. Muestra puntos de compra y venta para cualquier TF (período de tiempo) y cualquier par de divisas. Los ajustes son ajustables para todos los instrumentos. Puede configurar cada parámetro para cualquier corredor, para cualquier cuenta. Esta es una ALMOHADA que es cómoda :)) Solo compruébalo......
FxaccurateLS
Shiv Raj Kumawat
WHY IS OUR FXACCCURATE LS MT5 THE PROFITABLE ? PROTECT YOUR CAPITAL WITH RISK MANAGEMENT Gives entry, stop and target levels from time to time. It finds Trading opportunities by analyzing what the price is doing during established trends. POWERFUL INDICATOR FOR A RELIABLE STRATEGIES We have made these indicators with a lot of years of hard work. It is made at a very advanced level. Established trends provide dozens of trading opportunities, but most trend indicators completely ignore them! The
DESCRIPCIÓN ICSM (Impulse-Correction SCOB Mapper) es el indicador que analiza el movimiento del precio e identifica impulsos válidos, correcciones y SCOBs (Single Candle Order Block). Es una herramienta poderosa que se puede utilizar con cualquier tipo de análisis técnico porque es flexible, informativa, fácil de usar y mejora sustancialmente la conciencia del trader sobre las zonas de interés más líquidas. CONFIGURACIÓN General | Visuales Tema de color — define el tema de color del ICSM.
MTF Supply Demand Zones MT5
Georgios Kalomoiropoulos
5 (1)
Próxima generación de zonas de oferta y demanda automatizadas. Algoritmo nuevo e innovador que funciona en cualquier gráfico. Todas las zonas se crean dinámicamente de acuerdo con la acción del precio del mercado. DOS TIPOS DE ALERTAS --> 1)CUANDO EL PRECIO LLEGA A UNA ZONA 2)CUANDO SE FORMA UNA NUEVA ZONA No obtienes un indicador inútil más. Obtiene una estrategia comercial completa con resultados probados.     Nuevas características:     Alertas cuando el precio llega a la zona de ofert
PZ Swing Trading MT5
PZ TRADING SLU
5 (5)
Swing Trading es el primer indicador diseñado para detectar oscilaciones en la dirección de la tendencia y posibles oscilaciones de reversión. Utiliza el enfoque de intercambio de línea de base, ampliamente descrito en la literatura comercial. El indicador estudia varios vectores de precios y tiempos para rastrear la dirección de la tendencia agregada y detecta situaciones en las que el mercado está sobrevendido o sobrecomprado y listo para corregir. [ Guía de instalación | Guía de actualización
Quantum Trend Sniper
Bogdan Ion Puscasu
4.73 (51)
Introduciendo       Indicador Quantum Trend Sniper   , el innovador indicador MQL5 que está transformando la forma en que identificas y negocias los cambios de tendencia. Desarrollado por un equipo de comerciantes experimentados con experiencia comercial de más de 13 años,       Indicador de francotirador de tendencia cuántica       está diseñado para impulsar su viaje comercial a nuevas alturas con su forma innovadora de identificar cambios de tendencia con una precisión extremadamente alta. *
Berma Bands
Muhammad Elbermawi
5 (3)
El indicador de bandas de Berma (BB) es una herramienta valiosa para los operadores que buscan identificar y aprovechar las tendencias del mercado. Al analizar la relación entre el precio y las bandas de Berma, los operadores pueden discernir si un mercado se encuentra en una fase de tendencia o de rango. Las bandas de Berma se componen de tres líneas distintas: la banda de Berma superior, la banda de Berma media y la banda de Berma inferior. Estas líneas se trazan alrededor del precio, lo que
Fxaccurate Trend Trading is a method that focuses on identifying and capitalizing on market trends in the foreign exchange (Forex) market. This strategy is grounded in the principle that once a trend is established, it tends to persist, allowing traders to enter positions that align with the market's prevailing direction. Fxaccurate Trend Trading relies on various tools, indicators, and methodologies to spot, confirm, and trade in the direction of a trend, whether it’s upward (bullish) or downwa
Otros productos de este autor
MACD 2 Lines
Markus Paminger
MACD with fast and slow EMA. Moving average convergence divergence (MACD) is a trend-following momentum indicator that shows the relationship between two moving averages of a security's price . The MACD is calculated by subtracting the fast-period exponential moving average (EMA) from the slow-period EMA. Setup options: Fast EMA period Slow EMA period Signal EMA period Applied price Indicator window height Color MACD Color Signal Color Histogram
Displays trends in current chart. You can display trends of multiple timeframes in one chart by inserting this indicator as often as you want. Key features: displays trend line by finding highs and lows counts number of high/low of current trend in different color (long/short) allows you to display multiple timeframe trends in one chart Settings: Indicator Name: if you want to show M5 and H1 on one chart add TITrend twice to your current chart and rename M5 to "TITrendM5" and H1 to "TITrendH1" C
Filtro:
No hay comentarios
Respuesta al comentario
Versión 3.1 2022.08.08
Bugfix fixed scale
Versión 3.0 2022.08.08
- historical PoC
- individual settings for lookback periods
- button for show/hide VPR
- bug fixing (chart scale, performance...)