Higher High Lower Low MT4
- Indicadores
- KEENBASE SOFTWARE SOLUTIONS
- Versión: 1.0
- Activaciones: 5
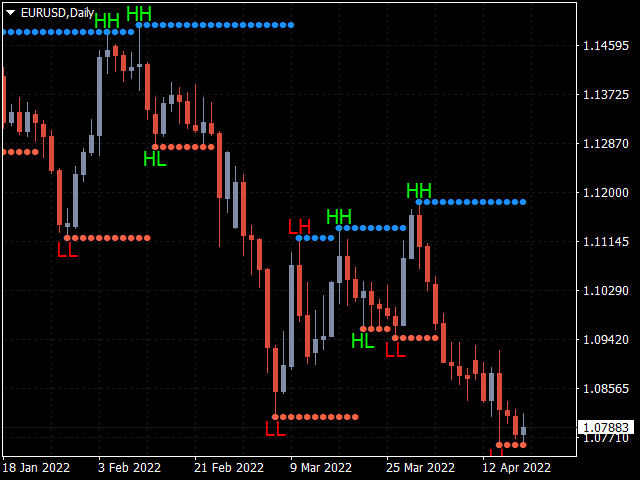
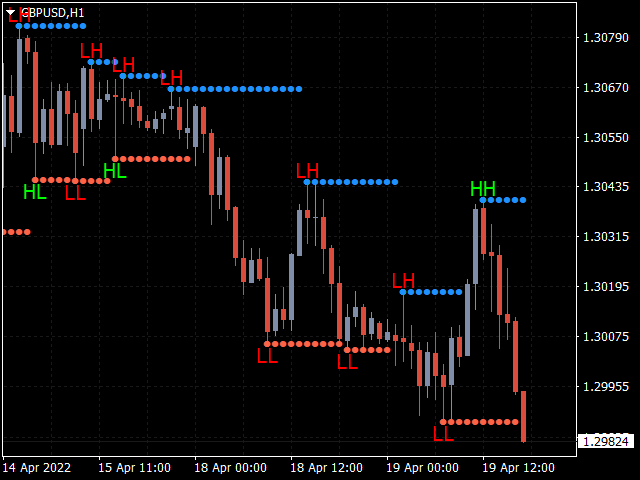
KT Higher High Lower Low marca los siguientes puntos de oscilación con sus respectivos niveles de soporte y resistencia:
- Higher High: Máximo que es más alto que el máximo anterior.
- Lower High: Máximo que es más bajo que el máximo anterior.
- Lower Low: Mínimo que es más bajo que el mínimo anterior.
- Higher Low: Mínimo que es más alto que el mínimo anterior.
Características
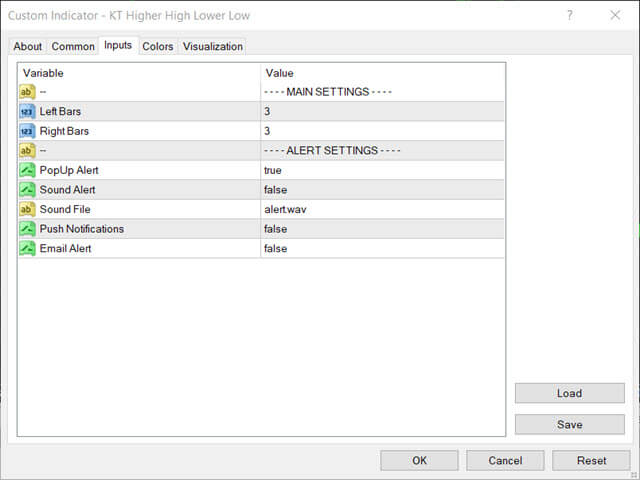
- La intensidad de los máximos y mínimos puede ajustarse modificando el número de barras a la izquierda y a la derecha.
- Proporciona alertas cuando aparecen nuevos HH, LH, LL y HL.
- Proporciona alertas cuando el precio toca un nivel de soporte o resistencia.
El usuario no ha dejado ningún comentario para su valoración