Pivot Points MT4
- Indicadores
- KEENBASE SOFTWARE SOLUTIONS
- Versión: 1.5
- Activaciones: 5
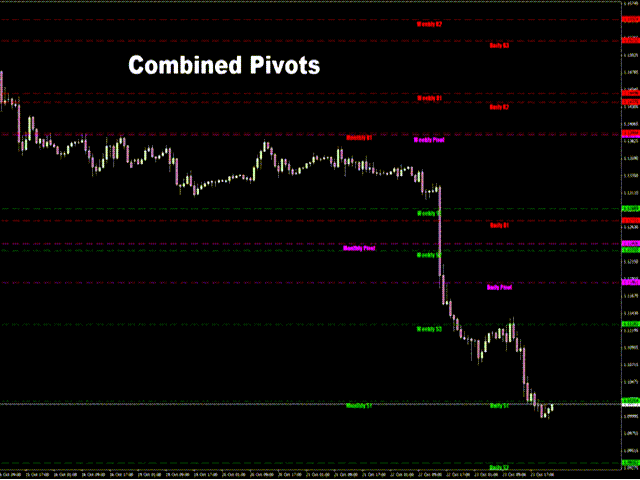
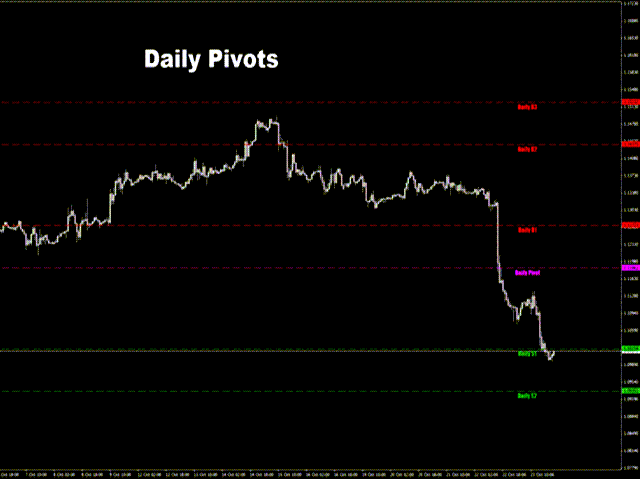
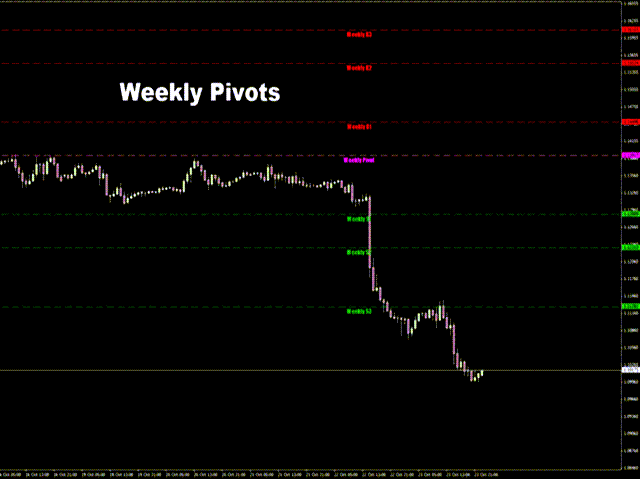
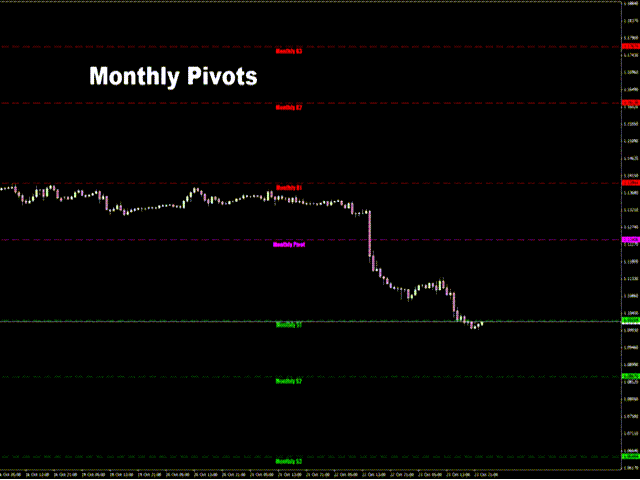
KT Pivot Points automatically plots the daily, weekly, and monthly pivot levels on a chart with the precise calculation based on the latest data. Pivot points is a widely used indicator in technical analysis, particularly in the Forex market.
Features
- Send alerts when the price touches the pivot level.
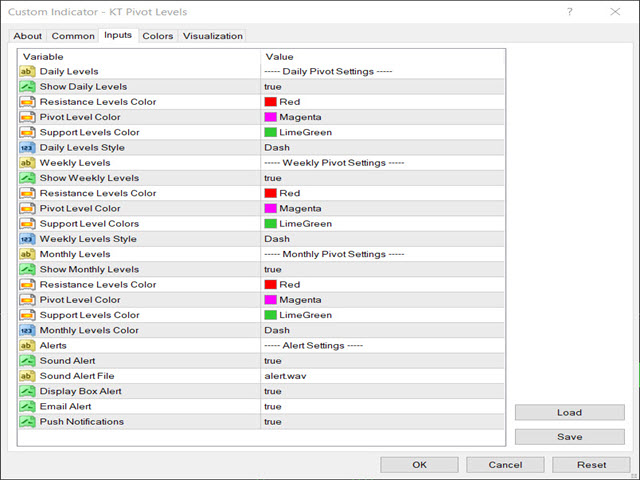
- It offers complete customization for each kind of pivot level.
- Shows daily, weekly, and monthly pivot levels without any fuss.
- It uses minimum CPU resources for faster calculation.
- Compatible with other indicators on the chart.
What are Pivot Points
A pivot point or level is found using the average of high, low, and closing price compared to the previous trading day or session.
Using the calculated pivot points and data, support and resistance levels can be projected in the future, which can be used to anticipate the price movement around these support and resistance levels.
Also, it is generally believed that if the price is trading above the pivot point, it indicates a bullish sentiment, while trading below the pivot point indicates a bearish sentiment.
Pivot Formula
To calculate the pivot levels, we use the data points such as the high, low, and close prices of the previous day, weeks, or even months.
- P = (H + L + C) / 3
- R1 = P + (P − L) = 2×P − L
- S1 = P − (H − P) = 2×P − H
- R2 = P + (H − L)
- S2 = P − (H − L)
- R3 = H + 2×(P − L) = R1 + (H − L)
- S3 = L − 2×(H − P) = S1 − (H − L)
Where,
P = Pivot, H = High, L = Low, C = Close
R = Resistance
S = Support
How to use Pivot Points
Pivot levels can be used as support/resistance levels to spot the reversal, continuation, stop-loss, and profit targets. Day-traders can use daily pivot levels, swing traders can use weekly pivot levels, and long-term investors can use monthly pivot levels.
Positional traders and investors can even utilize annual data to estimate significant levels for upcoming years.
Pivot Strategies
Typically, a trader can go long when the price touches the support level and go short when it touches the resistance level. However, this commonly used strategy is dangerous during strong trending markets.
The pivot levels can be used in a more meaningful way. If the price is below the central pivot level, the market is expected to go south and go north if the price is above the pivot level.
Any indicator or methodology cannot exist without its pitfalls. For example, pivot levels sometimes may fail you as a trader. Still, it's always best to use them as a guiding compass within your trading strategy.

