Tick Imbalance Bars
- Indicadores
- Henrique Helmuth Kreutz Pfeifer
- Versión: 1.1
- Actualizado: 29 marzo 2022
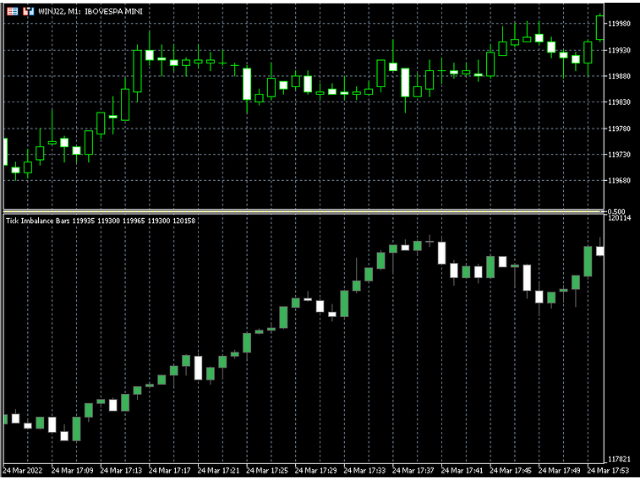
Tick imbalance bars (TIB), described in the book Advances in Financial Machine Learning (2018) by Marcos López de Prado.
Indicator that show candlestick bars with an different sampling method than time fixed.
Real time data is sourced to the indicator and it may be used as substitute of the default graph.
Each bar is formed when a predefined tick balance is exceeded, showing in the graph the OHLC of this cluster of ticks.
The input variable is the amount of ticks of each bar.
The indicator may not work on strategy tester. Metatrader clusters the past ticks by price.There is two adicional indexes buffers: stdev_log_returns (buffer 5) and new_bar (buffer 6), wich returns the standard deviation of log returns [%] of the last 20 TIB and flags the initial tick the bar. New_bar is 1 when the current tick opens a new bar.
Ps.: as discussed in this issue, there is a problem with the TIB's threshold. The choosen approach to address the issue was limiting the maximum expectation to the input threshold from the begining.


