BalanceCurve
- Utilidades
- Yu Zhang
- Versión: 1.0
- Activaciones: 20
1. What is this
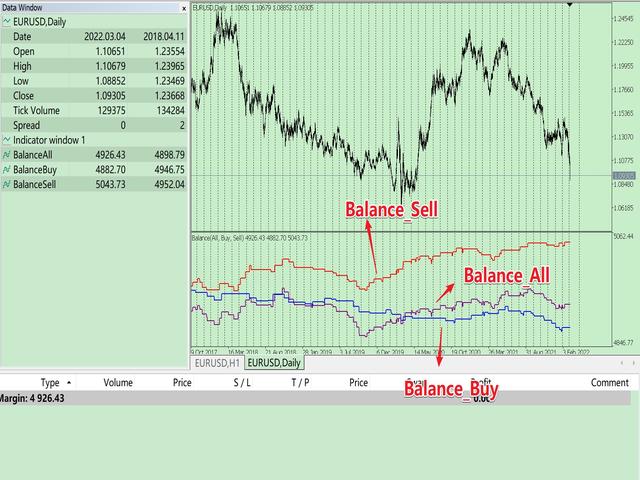
This is a tool used to display the balance curve in real time. The historical orders of the MT5 software are only tabular, and it looks troublesome when you have a lot of orders. This program can draw your historical trading orders in the form of a capital curve graph. This way you can see at a glance how well you are trading and where you are going wrong.
2. Features
- You can draw your historical trading orders in the form of a capital curve chart, which can draw different capital curves according to different time frames.
- It can be used for strategy backtesting to show how your EA strategy is doing in real time.
- It is divided into three funding curves. One is for only showing long position, one is for showing only short position, and one is for including all.
- Programming in the form of indicators does not affect the overlay of other EAs or indicators.
3. Parameter description
- InitDeposit = 5000; // Initial Deposit
- Inp_StartTime = 0; // History start time, 0 - all time
- Inp_ProfitNorm = false; // Is corrected position to 1.0 lots, default false.
- Inp_Symbol = NULL; // Select Symbol, default is all symbols.
4. How to use
Just load it directly on the chart.
Here's how to use it in strategy backtesting, both of the following methods will work:
- a. Load the following code into OnInit() of your EA, it will automatically load the indicator in the history test. First you have to copy the program to the Indicator directory.
//---First you have to copy the program to the Indicator directory.
iCustom(_Symbol, _Period, "BalanceCurve", 5000, 0, false);
- b. Save the indicator to the template, and then load the template in the strategy backtest.


