Triangle Finder MT5
- Indicadores
- Amir Atif
- Versión: 2.6
- Actualizado: 27 julio 2024
- Activaciones: 15
50% off. Original price: $60
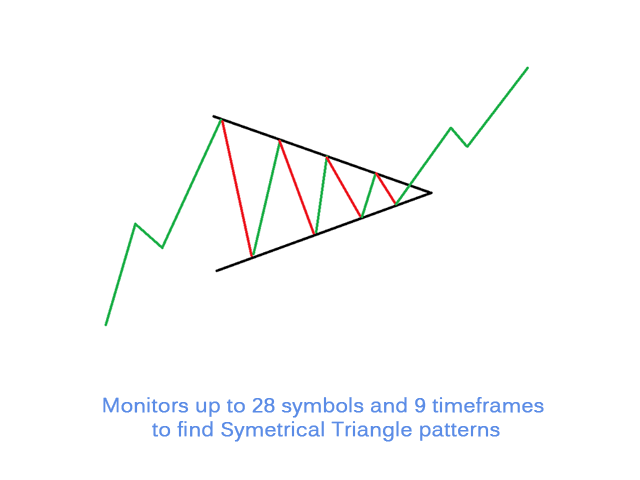
Triangle Finder is a multi symbol multi timeframe dashboard that finds symmetrical triangle pattern in 28 symbols and 9 timeframes with a deep scan feature to scan all market watch symbols (up to 1000 instruments!).
Triangle Finder features:
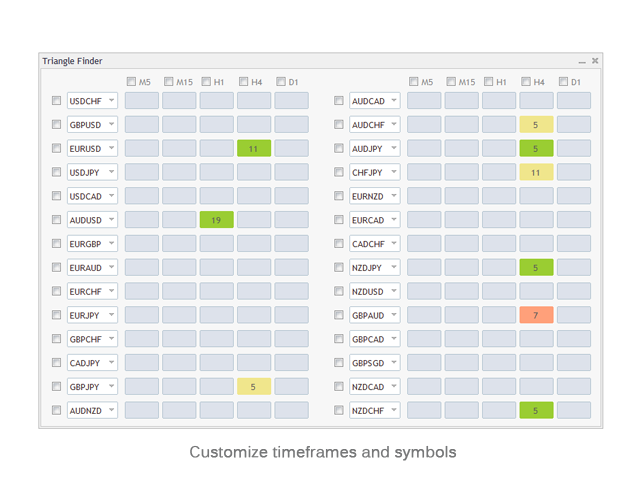
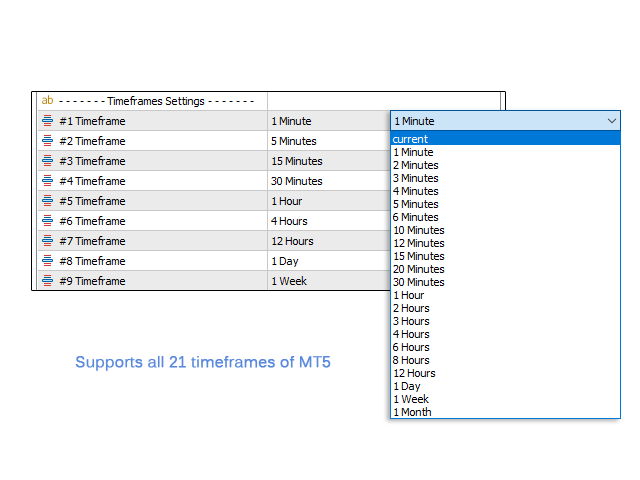
- Realtime monitoring of 28 customizable instruments and 9 timeframes at the same time.
- Deep scan mode to scan all market watch symbols for triangle patterns.
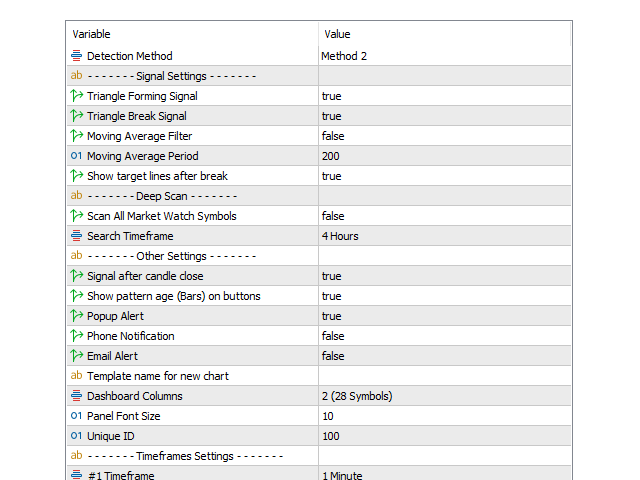
- 2 patterns detection methods.
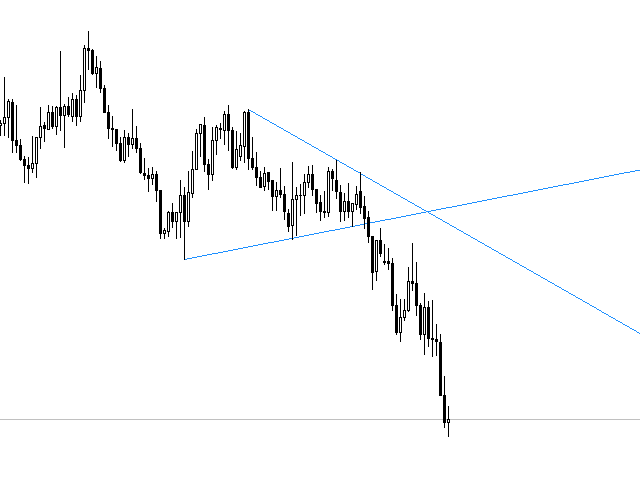
- Signals forming triangles and triangles breaks.
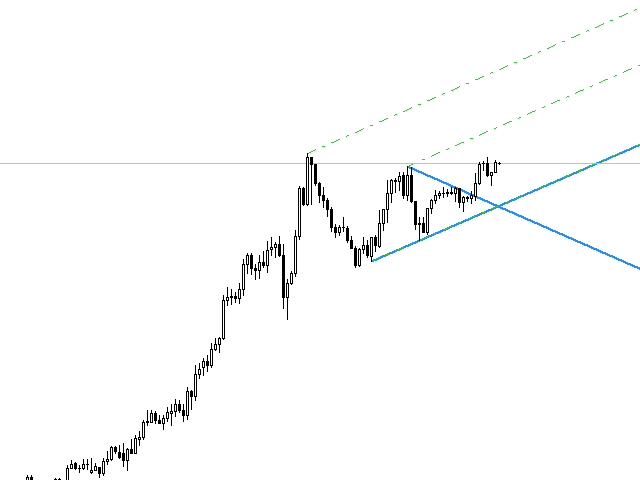
- Option to suggest targets after triangle break based on channels.
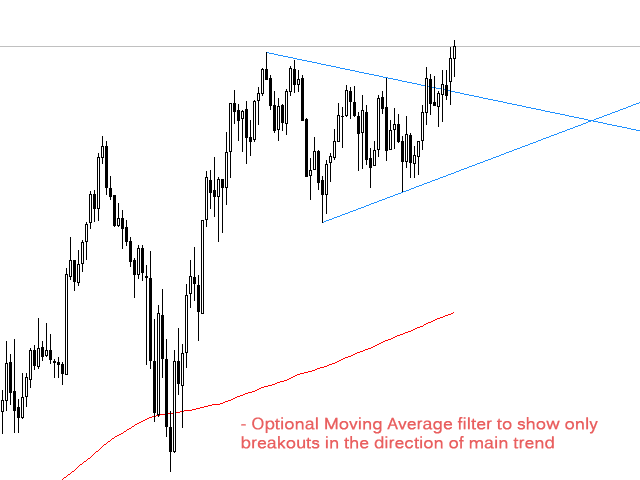
- Optional Moving Average filter to signal breakouts only in the direction of the main trend.
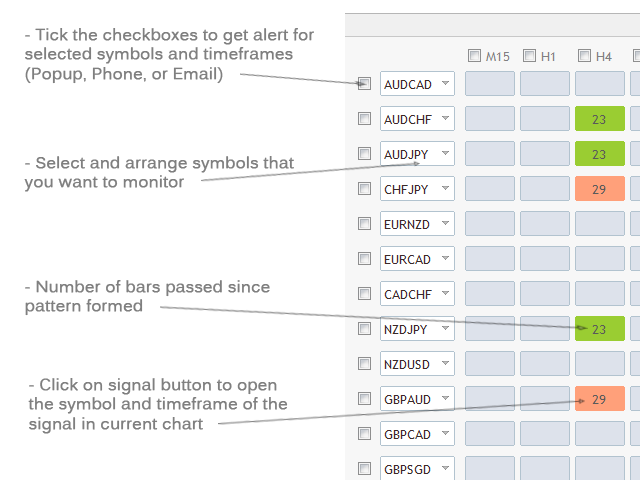
- Showing the number of bars passed since the triangle pattern formed, on dashboard buttons.
- Supports all 21 timeframes of Metatrader 5 platform.
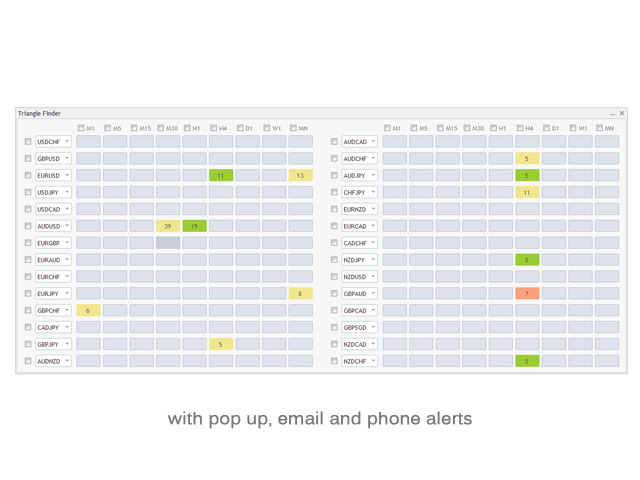
- Popup, email, and phone notification alerts for selected symbols and timeframes.
- Quick review of signals in the same chart by clicking on signal buttons.
- Easy arrangement of symbols in any order with any instrument that your broker provides.
Notes
- The dashboard displays 3 signals with 3 colors. Yellow color indicates triangle forming. Green and Red for upper and lower trend line break,
- The signals of this dashboard are not straight buy/sell signals and need to be evaluated by the trader in the market context.
- If you want to monitor more than 28 instruments you can load the indicator on another chart with different "Unique ID" in the settings and set different symbols for it.
- The symbols that you want to add to the dashboard must be visible in the MetaTrader market watch window. The first time you run the indicator or load a new symbol in the dashboard it might take a few seconds to update its data and show signals.
If you are experienced at trading triangle patterns or any type of consolidation breakouts, you may want to try the Reward Multiplier tool.


excellent