CloseLines
- Indicadores
- Attila Radulovic
- Versión: 1.0
- Activaciones: 10
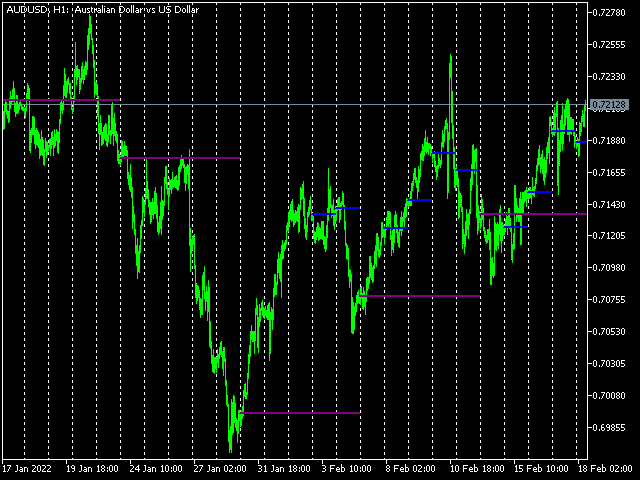
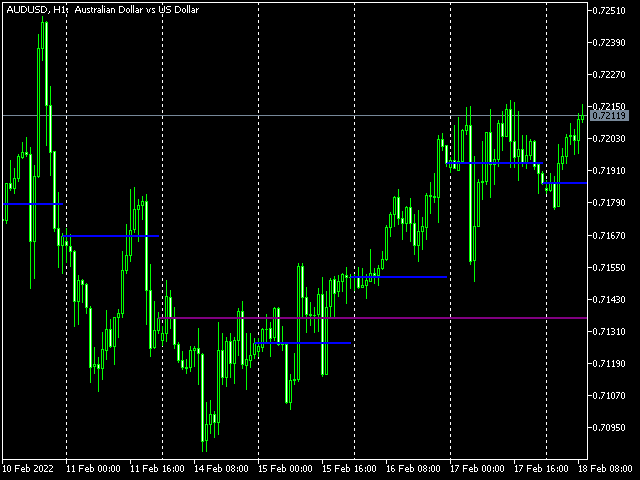
The indicator draws lines (with line objects) to the close prices of the last closed bars, on selected timeframes.
Parameters
- Close line 1 close price timeframe - timeframe of the 1st close price
- Close line 1 color - color of the 1st close price
- Close line 1 width - width of the 1st close price
- Close line 1 style - style of the 1st close price
- Close line 1 max count - the maximum number of lines plotted for the 1st close price, considering the selected timeframe in Close line 1 timeframe parameter. If the selected timeframe is D1, 12 means that the last 12 close price of the daily candles will be plotted.
- Close line 1 display timeframes - the timeframes for the 1st close price, on which the lines should be displayed. You could use the standard names of timeframes (H1, H4 etc.), or the minute representation of them (60, 240 etc.). The separator character is ; (semicolon).
Same with line 2 and line 3.
- Timeframe based line widths - see the extra paragraph.
Timeframe based line widths
The line thicknesses have an extra feature that can help you find your way around more easily. The default value for line thickness is the one you specify with your parameters, but:
- if the current period of the chart is less than the period of the line, the program will increase the thickness by one,
- if the current period of the chart is greater than the period of the given line, the program decreases the thickness by one,
- otherwise the line thickness is always the one you set.
Example (default setting, i.e. line thickness 2):
On W1 chart:
- the MN closing price lines have a thickness of 3,
- W1 closing price lines have a thickness of 2,
- the D1 closing price lines have a thickness of 1.

