• Información general
  • Comentarios
  • Discusión
  • Novedades

BB MA Cross for MT4

移動平均線クロス、ボリンジャーと移動平均線のクロス、移動平均線の角度でサイン表示

MT5インジケータ こちらにサイトとがあります。

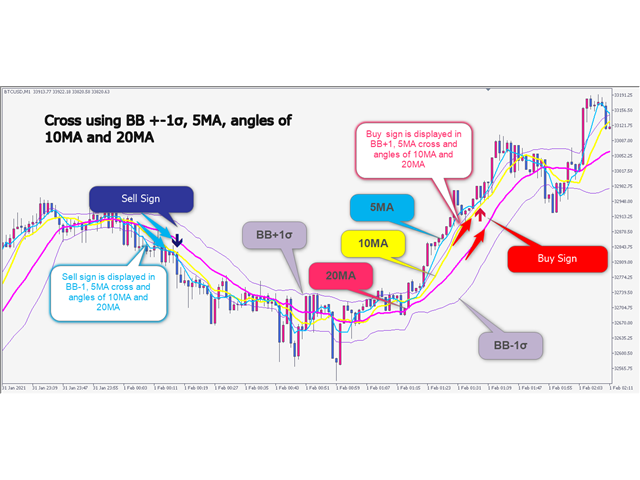
このインジケータは3つのパターンでサインを表示(切り替え可能)します。

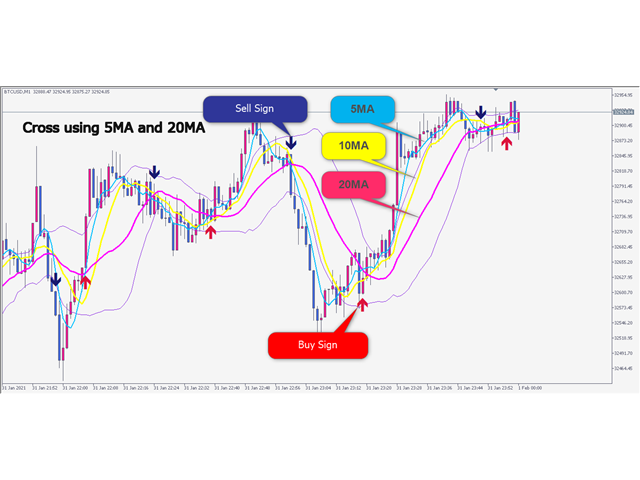
 移動平均線のクロス

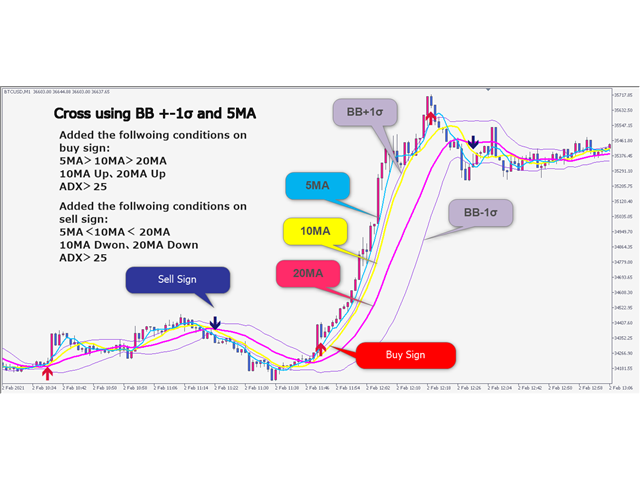
 ボリンジャーバンドと短期移動平均線とのクロス

 ボリンジャーバンドと短期移動平均線とのクロスと、中期移動平均線と長期移動平均線の角度

移動平均線のクロス

指定した短期移動平均線と長期移動平均線のゴールデンクロスでは買いサイン、デットクロスでは売りサインを表示します。

ディフォルトでは短期は5,長期は20となっています。もちろん変更可能になります。

移動平均線の種類をEMA(指数平滑移動平均線)やSMMA(平滑化移動平均)などに変更可能で適する価格も変更可能になります。

ボリンジャーバンドと短期移動平均線のクロス

ボリンジャーバンド(以降BB)と短期移動平均線のクロスでサインを表示します。

ディフォルトではBB+1σと5MAのゴールデンクロスで買いサイン、BB-1σと5MAのデットクロスで売りサインでサインを表示します。

BBの期間や、BBの標準偏差は変更可能になります。また短期、中期、長期の移動平均線の期間は変更可能になります。

追加の条件として買いであれば移動平均線のオーダー5MA>10MA>20MA、10MAと20MAが上昇中である、レンジ時の回避のためにADX>25が含まれています。

売りの場合は、移動平均線の条件5MA<10MA<20MA、10MAと20MAが下降中である、レンジ時の回避のためにADX>25が含まれています。

ボリンジャーバンドと短期移動平均線とのクロスと、中期移動平均線と長期移動平均線の角度

上記BBと短期移動平均線のクロスの条件に加えて、中期と長期移動平均線の角度でサインを表示します。

ディフォルトではBB±1σと5MAのクロスと設定した角度以上または以下でサインが表示されます。

インジケータを複数適用可能

Indicator Noを変えることによるこのインジケータを複数適用することができます。

これにより違う MAの期間による ゴールデンクロスと デットクロスのサインを表示できます。
例えばIndicator No1
は5MAと20MAのクロス、Indicator No2は20MAと50MAのクロス、Indicator No3はBBと5MAのクロスなど

表示するサインを変更可能

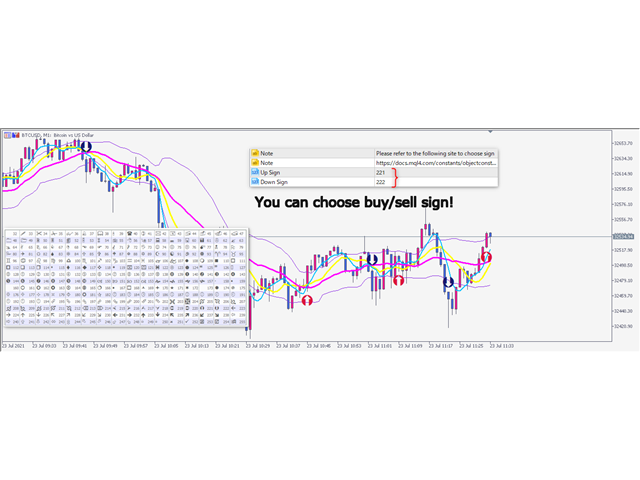
表示するサインを、以下を参考にして入力することにより表示するサインを変更可能になります。もちろんインジケータのプロパティーのカラータブでサインの色や大きさを変更することも可能になります。

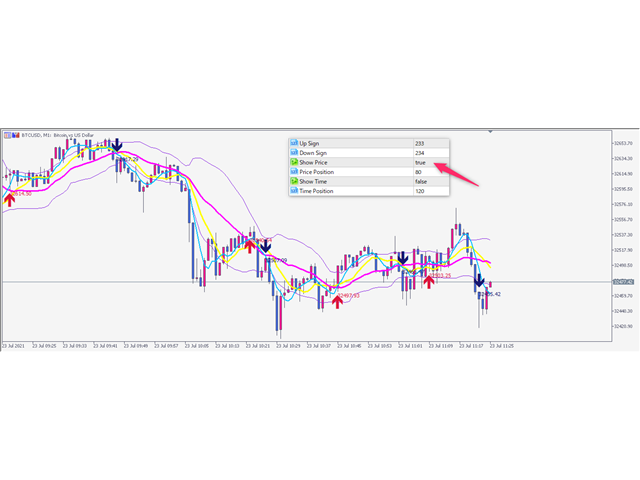
サインが表示された価格

設定することによりサインが表示された価格を表示することが可能になります。
ディフォルトでは表示されないようになっています。

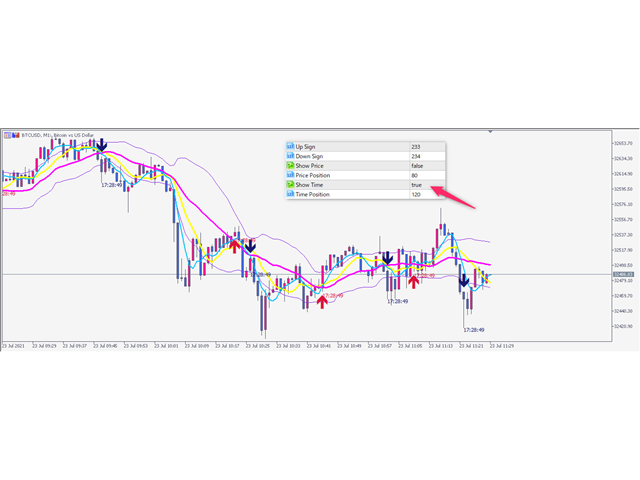
サインが表示された時間

設定することによりサインが表示されたときの時間を表示することが可能になります。

ディフォルトでは表示されないようになっています。

サインのアラート表示とメール通知およびSNSの通知

サイン発生時のアラート表示を設定により有効にしたり無効にしたりできます。

サイン発生時のアラート表示を設定により有効にしたり無効にしたりできます。

設定によりサイン発生時のメール通知やSNSへの通知を可能になります。

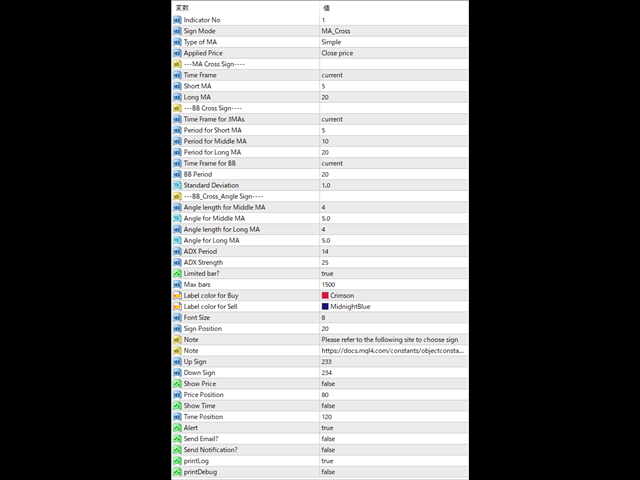
パラメータ説明:
■Indicator No:この数字を変更することによりこのインジケータを複数適用することができます。
■Sign Mode:
MA_Cross:MAのクロスで買いサインや売りサインを表示します。
BB_Cross:BBと短期(5MA)のクロスでサインを表示します。
BB_Cross_Angle:BBと短期(5MA)のクロスと中期と長期のMAの角度の条件でサインを表示します。
---MA Cross Sign----
■Time Frame:MA Cross で使用する時間足を設定します。
■Short MA:MA_Crossで使用する短期期間の設定します。
■Long MA:MA_Crossで使用する長期期間の設定します。
---BB Cross Sign----
■Time Frame for 3MAs:BB Crossで使用する時間足を設定します。
■Period for Short MA:短期MAの期間を設定、BBのクロスで使用します。ディフォルトは5
■Period for Middle MA:中期MAの期間を設定、MAの角度で使用します。ディフォルトは10
■Period for Long MA:長期MAの期間を設定、MAの角度で使用します。ディフォルトは20
■Time Frame for BB:BBで使用する時間足を設定します。
■BB Period:BBの期間を設定します。
■Standard Deviation 1:BBの標準偏差を設定します。
---BB_Cross_Angle Sign----
■Angle length for Middle and Long MA:MAの角度の計算するための期間を設定します。
■Angle for Middle and Long MA:MAの角度を設定します。

■ADX Period:ADXで使用する期間を設定します。
■ADX Strength:ADXの強さを設定します。これを設定することによりレンジ回避の1つのフィルターになります。
■Limited bar?:表示に使用するバーを制限するかどうかを設定します。
■Max bars:使用するバーの本数を設定します。
■Label color for buy:買いサインの色の設定します。
■Label color for sell:売りサインの色の設定します。
■Font Size:価格表示で使用されるフォントサイズを設定します。
■Sign Position:買いサインと売りサインの位置を設定します。
■Up Sign:買いで使用するサインを設定します。
■Down Sign:売りで使用するサインを設定します。
変更したい場合にはこちらを参考にして数字を入力してください。
https://docs.mql4.com/constants/objectconstants/wingdings

■Show price:価格を表示するか設定します。
■Price Position:価格を表示する位置を設定します。
■Show Time:時間を表示するか設定します。
■Time Position:時間を表示する位置を設定します。
■Alert:こちらを有効にすることにより買いサインまたは売りサインをアラートで表示します。
■Send E-Mail(Eメール):
こちらを有効にすることにより決済の結果をEメールにて送ることが可能になります。
■Send notifications(携帯への通知機能):
こちらを有効にすることにより携帯にインストールしたMT5に通知されるようになります。
■printLog:こちらを有効にすることのよりログがエキスパートログに
出力されるようになります。
■printDegug:こちらを有効にすることのよりさらなるログがエキスパートログに
出力されるようになります。

Productos recomendados
Indicator for binary options arrow is easy to use and does not require configuration works on all currency pairs, cryptocurrencies buy signal blue up arrow sell signal red down arrow tips do not trade during news and 15-30 minutes before their release, as the market is too volatile and there is a lot of noise it is worth entering trades one or two candles from the current period (recommended for 1 candle) timeframe up to m 15 recommended money management fixed lot or fixed percentage of the depo
Market Ticker
John Louis Fernando Diamante
The only Market Ticker on the market! Add a professional novelty to your workspace, with built in mini-charts A scrolling Market Ticker that displays price changes from all symbols in the Market Watch list. Provides an easy snapshot of symbol prices, and keeps scrolling automatically while you trade and analyse the chart. The ticker color (+/- price changes) are based on either the current or completed candle, and the previous candle. Options include: - MTF, eg choose to show price changes
The Momentum Standard/Hidden Divergence indicator will plot the momentum, and will also identify and plot standard (regular) divergences between the indicator and the price action, OR it can be set to identify and plot hidden (reverse) divergences between the indicator and the price action. The divergences themselves are implemented as lines (default green for bullish divergence and red for bearish divergence) drawn in the indicator pane. If activated via the Inputs dialog, alerts will be genera
Godfather
Ivan Simonika
The intelligent algorithm of the Godfather indicator accurately determines the trend, filters out market noise and generates entry and exit levels. The indicator will help in finding entry points when analyzing the price chart. The program first receives a "snapshot" of the graph, then analyzes it. The results are reported to the trader in the form of signals. The main purpose of this indicator is to determine the moments of entries and exits from transactions, so the indicator displays only th
Fibonacci Currency Strength Meter (FCSM) Early Access Sale!! This new product is still in the process of adding new features and settings. For early bird buyers. The Price will be 50% Sale. In a few weeks, the product will be done. Go Grab your copy while it's still cheap. More details will be added soon. Things to be added. Alert Levels Mobile and Email Alert From it's name, Fibonacci Currency Strength Meter is a combination of Fibonacci levels and Currency Strength Meter. The plot of Fib
This indicator is based on the standard MACD indicator, but showing the changes up and down colored. It is a nice assistance to visualize our Expert MAGIC MACD. MAGIC MACD MT4: https://www.mql5.com/en/accounting/buy/market/41144?period=0 MAGIC MACD MT5: https://www.mql5.com/en/accounting/buy/market/41151?period=0 Inputs in the Indicator: Fast EMA: standard is 12 Slow EMA: standard is 26 Signal: depending on what you want to see. For the MAGIC MACD the standard is 1 in common settings: Fixe
BinaryMartini
Abdulkarim Karazon
un indicador para el comercio binario basado en 3ma cruzado con macd, proporciona señales de compra y venta en la barra abierta y no se repinta ni retrocede El indicador no se centra en una alta tasa de ganancias, ya que está diseñado para el comercio de martingala, el indicador se centra en el menor número de señales perdedoras consecutivas. Estrategia : El depósito mínimo es de 1000 unidades, comenzamos a operar con 1 unidad (el tamaño de la operación es 1 unidad por cada 1000 de capital)
GeoWprPro
Georgij Komarov
WPR by Profile, or WPR for Professionals Geo_WprPro is one of the well-known currency profile indicators. It simultaneously displays two WPR indicators with different parameters in the matrix form on all timeframes of multiple currency pairs forming the currency profile . As follows from the description, " WPR is a leading indicator that often goes ahead of the price chart. The oscillator frequently reaches extreme values before the price reversal as if anticipating that event: it almost always
Trend MagicX
Hafis Mohamed Yacine
A trending market is one in which price is generally moving in one direction. ... When trading a trend-based strategy, traders usually pick the major currencies as well as any other currency utilizing the dollar because these pairs tend to trend and be more liquid than other pairs.  Best Trend Indicator That Tells You the Direction of the Trend   Trend MagicX_v1.1 displays the trend direction, duration, intensity and the resulting trend rating for all time frames in real time. You'll see at
This is  a dashboard indicator that displays the Average Level of each selected currency pairs that filters and gives us a signal for overbought (>=90%) or if price at extreme peak above 90, and/or oversold (<=10%) or if price at extreme peak below 10. The calculation is using Relative Strength Index default periods (2 & 9) applied to three different higher time frames H4,D1,&W1. This won't change or altered even if you change symbol or switch to lower time frames or even in monthly and y
Note : The slow loading of the indicator issue has been addressed . This new version loads fast and does not slow the platform. Version 1.3 : We have updated the indicator to include an historical bar scanning option . So instead of scanning all bars in the history (which can make the indicator slow sometimes ) , you can select the maximum number of bars it can scan which can increase the performance and make the indicator faster. This indicator scans the 1-3 Trendline pattern . The indic
Olofofo Fx Scanner
Opengates Success International
Olofofo Fx Scanner is a Custom Indicator created to scan through the currency pair it is being attached to in the market on ALL time frames simultaneously from a Minute to Monthly looking for just 3 things that make Forex trading exciting and worthwhile to invest in. Once these are found, it alerts the User immediately for a timely action on the part of the Trader. This is a self-fulfilling prophecy of the market, meaning that even if you are a newbie, by the time you see the graphical display o
A top-quality from the famous XSuper Trend indicator. It is completely loyal to the original algorithm, and implements many useful features Which includes Trend Indicators as Filters like MACD,CCI and Alligator. The Chefs Super Trend Plus Indicator is a great way to identify the current market trend. The indicator shows a clear distinction between uptrends and downtrends. The indicators has optional filters for sound signal. Suitable for the following trending pairs: EUR/USD, GBP/USD, USD/JPY,
SFO Trend Racer
Tevin Marshall
5 (1)
SFO Trend Racer system is a trend indicator created by the CEO and Founder of " Simple Forex Options ", Tevin Marshall . It serves 6 different functions all in one. It shows the trader the entry signals as well as exit signals, whether it is a take profit or a stop loss. It also uses trend filters and signal confirmations so that the trader is able to make the most logically fit decision. Trend Racer uses various filters and specific settings from a plethora of indicators. The beauty in this ind
Master Pullback Mr Beast
Luis Mariano Vazquez Marcos
Master Pullback es un poderoso Asesor Experto (EA) diseñado por MR BEAST que implementa una estrategia de trading basada en retrocesos o "pullbacks" en el mercado de divisas. Este EA identifica oportunidades de trading cuando el precio de un activo se retrae temporalmente en la dirección opuesta a la tendencia principal, lo que permite captar movimientos de corrección antes de que el mercado reanude su tendencia original. La estrategia del Master Pullback está optimizada para operar en pares de
Global Trend
Vitalii Zakharuk
Global Trend Indicator, shows the signals for entry. Displays both entry points and the trend itself. Shows statistically calculated moments for entering the market with arrows. When using the indicator, the risk factor can be optimally distributed. Settings: Uses all one parameter for settings. Choosing a parameter, it is necessary to visually resemble it so that the appropriate graph has a projection of extremes. Parameters: Length - the number of bars for calculating the indicator.
RBCI hist
Sergey Zhukov
The RBCI hist indicator is an adaptive trend histogram, that eliminates noise using a Low-pass filter, which passes the lower frequencies and cuts off hight frequencies of the price fluctuations. The signal (depending on the strategy chosen by trader) is the intersection of the zero line by the indicator, as well as the change in the histogram color. The change in the histogram color serves as an early signal for opening positions towards the trend. The position of the indicator relative to the
According to Bill Williams' trading system, the zone is formed by the combination of Accelerator Oscillator (AC) and Awesome Oscillator (AO). When they go up, we are in the green zone. When AO and AC bars are red, we are in the red zone. If one of the bars is red, while another is green, we are in the gray zone. When the current AC and AO histogram bars exceed the previous ones, the indicator is colored in green. If the current AC and AO histogram bars are below the previous ones, the indicator
Pyro Trend
Oleksii Ferbei
Pyro Trend is a new product that allows you to identify the current market phase (uptrend, downtrend or flat). The indicator is applicable for any data and periods. The middle of the trend wave, as well as the edges, are places of special heat and market behavior; when writing the indicator, an attempt was made to implement precisely finding the middle. Pyro Trend is a trend indicator that uses an original calculation algorithm. This indicator paints arrows in different colors depending on th
Trade Stats
Johannes Schoeman
Does your trading consist of Multiple EA's, Multiple time frames an no clear indication of how each individual strategy or time frame is performing, then this indicator will help. Assign the EA Magic number to this indicator and track it's performance on the chart by selecting on chart the period, today, week, month year or all history to view. Easy visual colour changing header to display the performance of the EA for the respective periods.    Minimize the panel to reduce chart clutter. Add yo
El indicador "Scalper Arrows" está diseñado para el método de especulación de operar dentro de las direcciones de tendencia. Principio de funcionamiento del indicador. Las flechas grandes indican la dirección de la tendencia. Flechas rojas: para dirección bajista, flechas verdes para dirección alcista. Dentro de una tendencia alcista o bajista, existe un algoritmo para generar señales de especulación en forma de pequeñas flechas. Además, las líneas de dirección de la tendencia se dibujan
Binary Options Support Resistance Indicator This indicator is designed for binary options trading and effectively shows retracements from support and resistance levels. Signals appear on the current candle. A red arrow pointing downwards indicates a potential selling opportunity, while a blue arrow pointing upwards suggests buying opportunities. All that needs adjustment is the color of the signal arrows. It is recommended to use it on the M1-M5 timeframes as signals are frequent on these timef
Buy and sell zones
Evgeniy Zhdan
5 (2)
Indicador para determinar plano y tendencia. Si el precio está por debajo de cualquiera de los dos histogramas y dos líneas (rojo y azul), esta es una zona de venta. Al comprar esta versión del indicador, la versión MT4 para una cuenta real y una demo, ¡como regalo (para recibir, escríbame un mensaje privado)! Si el precio está por encima de cualquiera de los dos histogramas y dos líneas (rojo y azul), esta es una zona de compra. Versión MT4:   https://www.mql5.com/en/market/product/3793
Con esta herramienta comercial, puede escanear 15 mercados simultáneamente. Presentamos el nuevo indicador comercial 2024: ️ Tablero Estocástico de marco de tiempo múltiple y moneda múltiple. Hay al menos dos razones por las que creé esta herramienta comercial: Primero, estoy aburrido de observar sólo un mercado. En segundo lugar, no quiero perder el momento de entrada en otro mercado. Por eso quiero conocer al mismo tiempo otras condiciones del mercado. Por este motivo, necesito u
Trading with the Transition to quality indicator is as simple as possible, if a blue arrow appears on the chart pointing up, a buy deal is opened. In the same case, if you see a red arrow pointing down, open a sell order. That is, everything is as simple as possible, positions are closed according to the reverse scheme, that is, as soon as a signal is received to open an order in the opposite direction from your position. For example, you opened a long position (sell), close it when a red arr
Fibo ichimoku
Mina Edward Habbib Ayoub
I have developed an indicator based on both the fibo musang strategy and the price breaking of the ichimoku cloud and it has amazing results the features are: 1- Once activated it give you the trend where you are from the chart 2- After a trend change it gives you an alert on PC or notification on your phone if you are away. 3- It sends you the exact prices to take an order and 3 take profit levels and your stoploss. 4- It works on every timeframes from 1m to MN. 5- It works on pairs
ArchIntel Dashboard
Raphael Adetunji Olaiyapo
ArchIntel Strength meter is different from the conventional strength meter. It displays correlation index for currency pair and individual currencies, see image 4 and image 6 for the currency pair correlation index and currency strength index. This strength meter displays correlated pair. EURJPY is used to explain the formula, EURUSD and USDJPY must be going up before I can buy (Long ) EURJPY , vice-versa is for sell. When any of the currency pair is correlated using this formular the the rectan
Indicador Taurus All4
Fabio Oliveira Magalhaes
Taurus All4 Taurus All4 is a high-performance indicator, it will tell you the strength of the trend, and you will be able to observe the strength of the candle. Our indicator has more than 4 trend confirmations. It is very simple and easy to use. Confirmation Modes Candle Trend Confirmations: When the candle switches to light green the trend is high. When the candle switches to light red the trend is reverting down. When the candle changes to dark red the trend is low. Trendline Trend Conf
ADX Pointer
Dominik Mandok
ADX Pointer is an indicator which is based on "Average Directional Index" and draws three numbers in chart window depending on the value of ADX. In ADX Pointer you can set "ADX_Period" which is of course period of Average Directional Index and you can also set 3 levels. When ADX value exceed first level ("ADX_Level1") in chart window appears number "1", when ADX exceed second level ("ADX_Level2") appears "2" and when ADX exceed third level ("ADX_Level3") appears "3". Simple. ADX Pointer works on
Diamond Trend
Segundo Calvo Munoz
Indicador que identifica la tendencia, así como puntos de entrada. Usar para entradas a favor de tendencia. Aunque este indicador es muy preciso identificando entradas, siempre se recomienda usar otro indicador de soporte para confirmar. Recuerda buscar los Activos y Timeframes que mejor se adapten a tu operativa... Válido tanto para Scalping como para entradas de Largo Plazo Por favor, utiliza un Gráfico de Barras para poder visualizar el indicador correctamente Inputs: EMA Value for Long Term
Los compradores de este producto también adquieren
Gann Made Easy
Oleg Rodin
4.83 (93)
Gann Made Easy es un sistema de comercio de Forex profesional y fácil de usar que se basa en los mejores principios de comercio utilizando la teoría del Sr. W. D. Gann. El indicador proporciona señales precisas de COMPRA y VENTA, incluidos los niveles de Stop Loss y Take Profit. Puede comerciar incluso sobre la marcha utilizando notificaciones PUSH. ¡Por favor, póngase en contacto conmigo después de la compra! ¡Compartiré mis consejos comerciales con usted y excelentes indicadores de bonificació
- Real price is 80$ - 40% Discount ( It is 49$ now ) Contact me for instruction, add group and any questions! Related Products:  Bitcoin Expert , Gold Expert Introduction The breakout and retest strategy is traded support and resistance levels. it involves price breaking through a previous level.  The break and retest strategy is designed to help traders do two main things, the first is to avoid false breakouts. Many false breakouts start with a candlestick that breaks out of a level but ends w
Bull versus Bear
Mohamed Hassan
4.83 (6)
Official Release price of $65 for the first 48 /50   copies ( 2 copies left). Next price is $120 !  Send us a message after your purchase to receive more information on how to get your  BONUS  for FREE  that works in great combination with Bull vs Bear ! Bull versus Bear is an easy-to-use Forex indicator that gives traders clear and accurate signals based on clear trend retests . Forget about lagging indicators or staring at charts for hours because  Bull vs Bear provides real-time entries
FX Volume
Daniel Stein
4.58 (33)
Obtenga su actualización diaria del mercado con detalles y capturas de pantalla a través de nuestro Morning Briefing aquí en mql5 y en Telegram ! FX Volume es el PRIMER y ÚNICO indicador de volumen que proporciona una visión REAL del sentimiento del mercado desde el punto de vista de un bróker. Proporciona una visión impresionante de cómo los participantes institucionales del mercado, como los brokers, están posicionados en el mercado Forex, mucho más rápido que los informes COT. Ver esta info
Gold Stuff
Vasiliy Strukov
4.89 (241)
Gold Stuff: un indicador de tendencia diseñado específicamente para el oro, también se puede usar en cualquier instrumento financiero. El indicador no se vuelve a dibujar ni se retrasa. El marco de tiempo recomendado es H1. Este indicador está escrito por EA Gold Stuff Advisor, puede encontrarlo en mi perfil.  Puede obtener una copia gratuita de nuestro indicador Strong Support y Trend Scanner, por favor envíe un mensaje privado. ¡a mí! IMPORTANTE! Póngase en contacto conmigo inmediatamente d
Atomic Analyst
Issam Kassas
5 (2)
En primer lugar, vale la pena enfatizar que este Indicador de Trading no repinta, no redibuja y no se retrasa, lo que lo hace ideal tanto para el trading manual como para el automatizado. Manual del usuario: configuraciones, entradas y estrategia. El Analista Atómico es un Indicador de Acción del Precio PA que utiliza la fuerza y el impulso del precio para encontrar una mejor ventaja en el mercado. Equipado con filtros avanzados que ayudan a eliminar ruidos y señales falsas, y aumentan el poten
FX Power MT4 NG
Daniel Stein
5 (13)
Obtenga su actualización diaria del mercado con detalles y capturas de pantalla a través de nuestro Morning Briefing aquí en mql5 y en Telegram ! FX Power MT4 NG es la nueva generación de nuestro popular medidor de fuerza de divisas, FX Power. ¿Y qué ofrece este medidor de fuerza de nueva generación? Todo lo que le encantaba del FX Power original PLUS Análisis de fuerza de ORO/XAU Resultados de cálculo aún más precisos Períodos de análisis configurables individualmente Límite de cálculo persona
Trend Screener
STE S.S.COMPANY
4.81 (88)
Indicador de tendencia, solución única e innovadora para el comercio y filtrado de tendencias con todas las funciones de tendencias importantes integradas en una sola herramienta. Es un indicador 100% sin repintar de marcos temporales y monedas múltiples que se puede usar en todos los símbolos/instrumentos: divisas, materias primas, criptomonedas, índices y acciones. OFERTA POR TIEMPO LIMITADO: El indicador de detección de soporte y resistencia está disponible por solo 50$ y de por vida. (Precio
Trend Punch
Mohamed Hassan
4.95 (20)
Halloween Promotion   until Monday 11-04-24  with a 40% discount on the original price!  This indicator is unstoppable when combined with our other indicator called  Support & Resistance . After purchase, send us a message and you will get it   for  FREE as a BONUS! Introducing Trend Punch , the revolutionary forex trend indicator that will transform the way you trade! Trend Punch is uniquely designed to provide precise buy and sell arrows during strong market trends, making your trading d
Scalper Inside PRO
Alexey Minkov
4.73 (56)
An exclusive indicator that utilizes an innovative algorithm to swiftly and accurately determine the market trend. The indicator automatically calculates opening, closing, and profit levels, providing detailed trading statistics. With these features, you can choose the most appropriate trading instrument for the current market conditions. Additionally, you can easily integrate your own arrow indicators into Scalper Inside Pro to quickly evaluate their statistics and profitability. Scalper Inside
Trend Pulse
Mohamed Hassan
5 (4)
Halloween Promotion   for   24 hours only   with a   40%   discount on the original price!  $̶6̶5̶  $39 ONLY!  Please contact me after purchase to immediately get your PDF strategy + documentation for Trend Pulse !  Introducing Trend Pulse , a unique and robust indicator capable of detecting bullish, bearish, and even ranging trends! Trend Pulse uses a special algorithm to filter out market noise with real precision. If the current symbol is moving sideways, Trend Pulse will send you a
FX Levels es un indicador de soporte y resistencia excepcionalmente preciso que fusiona el método Lighthouse tradicional con un enfoque dinámico innovador, funcionando a la perfección en todos los símbolos de negociación. Esto incluye pares de divisas, índices, acciones o materias primas. FX Levels identifica puntos de reversión y los muestra en el gráfico, que pueden utilizarse idealmente como objetivos de beneficios en sus actividades de negociación. En el desarrollo de FX Levels, hemos utili
The Stochastic Basket Currency Strenght  brings the Stochastic indicator to a new level.  Expanding the boundaries of TimeFrames and mono-currency analysis, the SBCS take the movements of each currency that composes the cross and confront them in the whole basket of 7 crosses.  The indicator works with any combination of AUD, CAD, CHF, EUR, GBP, JPY, NZD, USD pairs and with full automation takes in account every stochastic value (main line) for the selected Time Frame.  After that, the indicator
TPSproTREND PrO
Roman Podpora
4.79 (19)
TPSpro TREND PRO   es un indicador de tendencia que analiza automáticamente el mercado y proporciona información sobre la tendencia y cada uno de sus cambios, además de dar señales para ingresar operaciones sin volver a dibujar. El indicador utiliza cada vela, analizándolas por separado. refiriéndose a diferentes impulsos: impulso hacia arriba o hacia abajo. ¡Puntos de entrada exactos a transacciones de divisas, criptomonedas, metales, acciones e índices! Versión MT5                   DESCRIPCI
Reversal-Arrow: Identifica Puntos de Inversión con Precisión y Fiabilidad Reversal-Arrow es un indicador avanzado diseñado para ayudar a traders de todos los niveles a detectar posibles puntos de inversión de tendencia. Enfocado en proporcionar señales visuales claras, este indicador te ayuda a entender mejor el contexto del mercado, reduciendo la incertidumbre y facilitando el proceso de toma de decisiones. Reversal-Arrow está optimizado específicamente para los pares XAUUSD y XAUEUR en los mar
Stratos Pali
Michela Russo
5 (1)
Stratos Pali Indicator   is a revolutionary tool designed to enhance your trading strategy by accurately identifying market trends. This sophisticated indicator uses a unique algorithm to generate a complete histogram, which records when the trend is Long or Short. When a trend reversal occurs, an arrow appears, indicating the new direction of the trend. Important Information Revealed Leave a review and contact me via mql5 message to receive My Top 5 set files for Stratos Pali at no cost! D
TPSpro RFI Levels
Roman Podpora
4.82 (22)
INSTRUCCIONES      RUSO  -  ING     Se recomienda utilizar con un indicador.   -    TPSpro   TENDENCIA PRO -   Versión MT5 Un elemento clave en el trading son las zonas o niveles desde los que se toman las decisiones de compra o venta de un instrumento de trading. A pesar de los intentos de los principales actores de ocultar su presencia en el mercado, inevitablemente dejan rastros. Nuestra tarea era aprender a identificar estos rastros e interpretarlos correctamente. Funciones principales: ¡Mo
Dynamic Forex28 Navigator
Bernhard Schweigert
5 (2)
Dynamic Forex28 Navigator: la herramienta de trading de Forex de última generación. ACTUALMENTE CON UN 49 % DE DESCUENTO. Dynamic Forex28 Navigator es la evolución de nuestros indicadores populares de larga data, que combina el poder de tres en uno: Indicador avanzado Currency Strength28 (695 reseñas) + Indicador avanzado Currency IMPULSE con ALERT (520 reseñas) + Señales combinadas CS28 (bonificación). Detalles sobre el indicador https://www.mql5.com/en/blogs/post/758844 ¿Qué ofrece el i
Currency Strength Exotics
Bernhard Schweigert
4.87 (31)
¡ACTUALMENTE 20% DE DESCUENTO ! ¡La mejor solución para cualquier operador novato o experto! Este indicador está especializado en mostrar la fuerza de la divisa para cualquier símbolo como Pares Exóticos, Materias Primas, Índices o Futuros. Es el primero de su clase, cualquier símbolo se puede añadir a la 9 ª línea para mostrar la verdadera fuerza de la moneda de Oro, Plata, Petróleo, DAX, US30, MXN, TRY, CNH etc. Se trata de una herramienta de trading única, de alta calidad y asequible por
Este tablero muestra los últimos patrones armónicos disponibles para los símbolos seleccionados, por lo que ahorrará tiempo y será más eficiente / versión MT5 . Indicador gratuito: Basic Harmonic Pattern Columnas del indicador Symbol: aparecerán los símbolos seleccionados Trend : alcista o bajista Pattern : tipo de patrón (gartley, mariposa, murciélago, cangrejo, tiburón, cifrado o ABCD) Entry : precio de entrada SL: precio de stop loss TP1: 1er precio de toma de beneficios TP2: 2º precio de
Gold Channel is a volatility-based indicator, developed with a specific timing algorithm for the XAUUSD pair, which consists of finding possible corrections in the market. This indicator shows two outer lines, an inner line (retracement line) and an arrow sign, where the theory of the channel is to help identify overbought and oversold conditions in the market. The market price will generally fall between the boundaries of the channel. If prices touch or move outside the channel it is a tra
¡Actualmente 20% OFF ! ¡La mejor solución para cualquier novato o trader experto! Este software funciona con 28 pares de divisas. Se basa en 2 de nuestros principales indicadores (Advanced Currency Strength 28 y Advanced Currency Impulse). Proporciona una gran visión general de todo el mercado de divisas. Muestra los valores de Advanced Currency Strength, la velocidad de movimiento de las divisas y las señales para 28 pares de divisas en todos los (9) marcos temporales. Imagine cómo mejorar
Currency Strength Wizard es un indicador muy poderoso que le proporciona una solución todo en uno para operar con éxito. El indicador calcula el poder de este o aquel par de divisas utilizando los datos de todas las monedas en múltiples marcos de tiempo. Estos datos se representan en forma de índice de moneda fácil de usar y líneas eléctricas de moneda que puede usar para ver el poder de esta o aquella moneda. Todo lo que necesita es adjuntar el indicador al gráfico que desea operar y el indicad
ACTUALMENTE 26% DE DESCUENTO ¡La mejor solución para cualquier operador novato o experto! Este indicador es una herramienta única, de alta calidad y asequible porque hemos incorporado una serie de características propias y una nueva fórmula. ¡Con sólo UN gráfico puede leer la Fuerza de la Divisa para 28 pares de Divisas! Imagínese cómo mejorará su operativa porque podrá señalar el punto exacto de activación de una nueva tendencia o de una oportunidad de scalping. Manual del usuario: haga
Ante todo, vale la pena enfatizar que esta Herramienta de Trading es un Indicador No Repintado, No Redibujado y No Retrasado, lo que la hace ideal para el trading profesional. Curso en línea, manual del usuario y demostración. El Indicador de Conceptos de Acción del Precio Inteligente es una herramienta muy potente tanto para traders nuevos como experimentados. Combina más de 20 indicadores útiles en uno solo, combinando ideas avanzadas de trading como el Análisis del Trader del Círculo Interio
Ultimate Gold Advisor para MetaTrader 4 El Ultimate Gold Advisor es una herramienta tecnológica avanzada diseñada para optimizar la experiencia de trading en MetaTrader 4. Creada para satisfacer las necesidades de los traders más experimentados, este indicador combina precisión, análisis sofisticado y funcionalidad versátil, ofreciendo soporte para tomar decisiones de trading informadas. Ideal para el trading de oro, pero también aplicable a una amplia gama de activos, el Ultimate Gold Advisor p
Gann Swing Structure
Kirill Borovskii
5 (1)
This indicator is based on the mathematics of the great trader W.D. Ganna. With its help, you can easily find strong levels by analyzing swings to find the optimal entry point. The indicator works on all instruments and all timeframes. The indicator is fully manual and has control buttons. All you need to do is press the NEW button, a segment will appear, which you can place on any movement, swing or even 1 candle that you want to analyze. By placing the segment, press the OK button. A grid (th
IX Power MT4
Daniel Stein
4.67 (6)
IX Power lleva por fin la insuperable precisión de FX Power a los símbolos que no son de Forex. Determina con exactitud la intensidad de las tendencias a corto, medio y largo plazo de tus índices, acciones, materias primas, ETF e incluso criptodivisas favoritas. Puede analizar todo lo que su terminal le ofrece. Pruébalo y experimenta cómo tu timing mejora significativamente a la hora de operar. Características principales de IX Power Resultados de cálculo 100% precisos y sin repintado -
Deja un comentario después de la compra para recibir 4 indicadores de alta calidad como bono. El indicador Chart Patterns All-in-One ayuda a los traders a visualizar varios patrones de gráficos comúnmente utilizados en el análisis técnico. Este indicador apoya la identificación de posibles comportamientos del mercado, pero no garantiza rentabilidad. Se recomienda probar el indicador en modo demo antes de comprar. Oferta actual : Descuento del 50% en el indicador "Chart Patterns All in One". Patr
Advanced Supply Demand
Bernhard Schweigert
4.91 (295)
¡Actualmente con 33% de descuento! ¡La mejor solución para cualquier tráder principiante o experto! Este indicador es una herramienta comercial única, de alta calidad y asequible, porque incorpora una serie de características patentadas y una nueva fórmula. Con esta actualización, podrá mostrar zonas de doble marco temporal. No solo podrá mostrar un marco temporal más alto, sino también mostrar ambos, el marco temporal del gráfico MÁS el marco temporal más alto: MOSTRANDO ZONAS ANIDADAS. A todos
Otros productos de este autor
TrendBar
Koji Kobayashi
5 (3)
パラボリックのデータをもとにトレンドの方向性を1分足から月足まで表示します。 1分足から 月足 まで表示されているので今どの方向に価格が動いているのかがすぐに分かります。 更新はティク毎ではなくディフォルトでは1秒毎、もちろん変更も可能なのでチャートの表示が遅くなるようなことはありません。 機能: どの通貨でも表示可能になります。 アイコンの色を指定することが可能になります。 表示位置(X軸、Y軸)が変更可能 になります。 表示位置 (左上 、 右上 、 左下 、 右下) が 指定 が可能 になります。 フォント を指定することが可能になります。 フォントサイズ が 変更可能 になります。 アイコンのサイズ が 変更可能 になります。 週足、 月足  の非表示 が 可能 になります。
FREE
Traders Club Clock for MT5 Readme ローソク足のすぐ横にその時間足での 残り時間とスプレッドを表示します。 ※残り時間はサーバ時間から計算しています。 月足、週足、日足、4時間足、1時間足、30分足、15分足、5分足、1分足 で表示可能となっております。 ※スプレッド値ポイント単位での表示になります。 ※時間の更新はティック毎ではなく1秒 毎 に更新するようにしています。   一目で残り時間とスプレッドを確認できます。 機能: 使用しているフォント種類を変更できます。 使用しているフォントサイズを変更できます。 表示しているテキストの色を変更できます。 スプレッド表示を非表示にすることができます。 表示する位置を変更することが出来ます。
FREE
移動平均線クロス、ボリンジャーと移動平均線のクロス、移動平均線の角度でサイン表示 MT5インジケータ こちらに サイト があります。 このインジケータは3つのパターンでサインを表示(切り替え可能)します。 ① 移動平均線のクロス ② ボリンジャーバンドと短期移動平均線とのクロス ③ ボリンジャーバンドと短期移動平均線とのクロスと、中期移動平均線と長期移動平均線の角度 ⓸ ボリンジャーバンドと短期移動平均線とのクロス(サインを交互に表示) 移動平均線のクロス 指定した短期移動平均線と長期移動平均線のゴールデンクロスでは買いサイン、デットクロスでは売りサインを表示します。 ディフォルトでは短期は5,長期は20となっています。 もちろん変更可能になります。 移動平均線の種類をEMA(指数平滑移動平均線)やSMMA(平滑化移動平均)などに変更可能で適する価格も変更可能になります。 ボリンジャーバンドと短期移動平均線のクロス ボリンジャーバンド(以降BB)と短期移動平均線のクロスでサインを表示します。 ディフォルトではBB+1σと5MAのゴールデンクロスで買いサイン、BB-1σと5MAのデ
エントリー前に確認できるチェックリストを作成しました。 以下のコードを参照してMT5用に作成しました。 Strategy Checklist - indicator for MetaTrader 4 https://www.mql5.com/en/code/18877 機能: チェックリスト20個まで入力できます。 表示位置 (左上 、 右上 、 左下 、 右下) の 指定 が可能 になります。 フォントサイズ の 変更が可能 になります。 チェックリストの幅を変更できます。 ドラッグ&ドロップでチェックリストを移動できます。 インストール方法: ファイル->データフォルダーを開く->MQL5フォルダー->Indicatorsフォルダー 配下にex5ファイルを置いてMT5を再起動してください。 チェックリストはマニュアルで入力が必要になります。入力後 保存しておいてください。 テンプレートで保存しておくと容易にチャートに適用できます。
FREE
RoundNum Readme (Traders Club) 特徴: このツールはDOWやNIKKEIなど500や1000ポイントがラウンドナンバーの 指数を取引する際に表示するように開発しました。 もちろんメジャー通貨でも表示はされます。 更新頻度を制限しているのでチャート表示が遅くなるということは ありません。 XMでDOWを取引される場合、Main Levelsを10000 Sub Levelsを5000にしてください。 各パラメータの説明: Number to display lines:表示するライン数を設定します。 Main Levels:メインレベルをポイントで指定します。 Main Line Color:メインラインの色を設定します。 Main Line Style:メインラインで使用されるラインを設定します。 Show Sub Lines:サブラインを表示するか設定します。 Sub Levels:サブレベルをポイントで指定します。 Sub Line Color:サブラインの色を設定します。 Sub Line Style:サブライン
FREE
パラボリックのデータをもとにトレンドの方向性を1分足から月足まで表示します。 1分足から 月足 まで表示されているので今どの方向に価格が動いているのかがすぐに分かります。 更新はティク毎ではなくディフォルトでは1秒毎、もちろん変更も可能なのでチャートの表示が遅くなるようなことはありません。 機能: どの通貨でも表示可能になります。 パラボリックの数値を変更することは可能になります。 上昇時と下降時のアイコンの色を指定することが可能になります。 表示位置(Y軸)が変更可能 になります。   表示位置 (左上 、 右上 、 左下 、 右下) が 指定 が可能 になります。 フォント を指定することが可能になります。 フォントサイズ が 変更可能 になります。 アイコンのサイズ が 変更可能 になります。 週足、 月足  の非表示 が 可能 になります。
FREE
特徴: このツールはDOWやNIKKEIなど500や1000ポイントがラウンドナンバーの 指数を取引する際に表示するように開発しました。 もちろんメジャー通貨でも表示はされます。 更新頻度を制限しているのでチャート表示が遅くなるということは ありません。 XMでDOWを取引される場合、Main Levelsを10000 Sub Levelsを5000にしてください。 各パラメータの説明: Number to display lines:表示するライン数を設定します。 Main Levels:メインレベルをポイントで指定します。 Main Line Color:メインラインの色を設定します。 Main Line Style:メインラインで使用されるラインを設定します。 Show Sub Lines:サブラインを表示するか設定します。 Sub Levels:サブレベルをポイントで指定します。 Sub Line Color:サブラインの色を設定します。 Sub Line Style:サブラインで使用されるラインを設定します。 Update Frequency(
FREE
多数の通貨を取引している場合、画面をカチャカチャ切り替えの際にどの通貨を見ているか 迷ったことはありませんか。 表示している通貨が大きく表示されるMT4用のインジケーターは あるのですがMT5用がなかったので作成しました。 機能: どの通貨でも表示可能になります。 表示位置 (左上 、 右上 、 左下 、 右下) の 指定 が可能 になります。 表示位置(X軸、Y軸)が変更可能 になります。 フォントの色を 変更可能 になります。 使用するフォント を指定することが可能になります。 フォントサイズ の 変更が可能 になります。 インストール方法: ファイル->データフォルダーを開く->MQL5フォルダー->Indicatorsフォルダー 配下にex5ファイルを置いてMT5を再起動してください。
FREE
Time Line (Traders Club)  機能: 昨日高値、安値、本日始値、高値、安値の時間から線を引きます。 時間足により表示する時間が変わります。 1分、5分足では1時間ごとの表示 15分、30分足では4時間ごとの表示 1時間、4時間は12時間ごとの表示 日足以降は時間は表示されません。 高値安値は週足より下位足で表示されます。 各ラベルを変更可能になります。 更新頻度を変更できるのでチャート表示が 重くなることはありません。 各パラメータの説明: Difference hours form Server Time: サーバとの時間差を入力します。 Yesterday High Label:昨日高値のラベルを設定します。 Yesterday Low Label:昨日安値のラベルを設定します。 Show open line:true 始値の線を表示するかどうか Today Open Label:本日始値のラベルを設定します。 Today High Label:本日高値のラベルを設定します。 Today Low Label:本日安値のラベルを設定します。 L
特徴: MTF Moving Averageを8本一気に表示してくれるインジケータになります。 8本も必要ない場合にももちろん非表示にできます。 どの通貨でも使用可能になります。 それぞれのMTF Moving Averageの色や太さを変更できます。 各パラメータの説明: Method:MAの種類設定をします。 Applied price:MAで使用する価格を設定をします。 TimeFrame M5:使用するMAの時間足を設定します。 Period M5:使用するMAの期間を設定します。 ※ラベルに関係なく8本のMTF MAはどの時間足でも期間設定可能になります。 Update Frequency(seconds):MTF Moving Averageの再作成更新頻度を入力します。
MA cross AKT (Traders Club)  機能: MAゴールデンクロスで買いサイン、デットクロスで売りサインを表示します。 MAの期間は入力できます。 MAの種類を選択できます。(SMA、EMA、SMMA、LWMA) 適用する価格を選べます。(CLOSE,OPEN,LOW,HIGH,MEDIAN,TYPICAL,WEIGHTED) サインをアラートで通知します。 サイン発生をE-mailやSNSで通知します。 MAクロスの勝率を表示します。 ローソク足の本数を変更することにより過去何か月かの MAクロスの勝率をすぐに確認することができます。 これは各時間足、各通貨で確認することが出来ます。 判定するローソク足を3か所選ぶことが出来ます。 ディフォルトでは5本目、9本目、14本目となっています。 サインの表示をボタンで表示したり消したりできます。 表示するサインを変更することが出来ます。
このEAを使用することにより様々な条件で自動で決済することが可能になります。 詳細な情報はこちらにサイトがあります。 https://toushika.top/ea-takeaprofit/ 条件: 条件1:利確か損切で決済 条件2:利確か損切または反転MAで決済 (ディフォルトでは20MA反転で利確) 条件3:利確か損切またはゴールデンクロス、デットクロスで決済 条件4:利確か損切またはボリンジャーバンドにタッチで決済 条件5:利確か損切またはパラボリックで決済 条件6:利確か損切または設定した水平線で決済 <- 他の通貨で設定した水平線でも決済可能 重要:水平線で決済の際、買いポジションと売りポジションは同時に持てません。 買いポジションがある時に売りポジションを持つとすぐに決済されてしまいます。 反対に売りポジションがる時に買いポジションを持つとすぐに決済されてしまいます のでご注意ください。
PO-Plus Readme 機能: 3つのロジックでの買いサイン、売りサインを表示します。 各ロジックでの勝率を表示します。 サイン表示後、勝率を確認して高い勝率でBOやFXでエントリーすることが出来ます。 勝率の判定本数を変更できます。 Indicator Noを変えることによるこのインジケータを複数適用することができます。 これによりRCIの数値を変更して勝率を複数表示が可能になります。 その際は、ラベルの表示位置も変更してください。 ボタンを押すことによりラベルや買いサイン、売りサインを表示、非表示すことが出来ます。   注意:こちらのロジックはZigZag+ロジックでの勝率になりますので 勝率は実際のものより高めに表示されます。 エントリーする際は勝率60%以上のものを推奨します。 ZigZagベースなので価格が動く日本、欧州、NY時間の前半でのエントリしない ことを推奨します。 各パラメータの説明: ----------Basic Setting---------- Indicator No:インジケータNoを設定します。もし同じチャート
このEAを使用することによりワンクリックによる決済、 決済したい通貨のチャートに適用しておけば様々な条件で自動で 決済することが可能になります。 パフォーマンスを考慮しているので動作が非常に軽いです。 新機能:Ver2.3 設定した利益以上になるとSLが建値(BE)に設定 新機能:Ver2.0 資金管理による買いや売りエントリ トレード毎に自動スクリーンショット取得 詳細な情報はこちらにサイトがあります。 https://toushika.top/tc-panel-for-mt5/ 機能: ワンクリックによる全通貨決済 ワンクリックによる表示上の通貨決済 分かりやすいPips表示 移動可能 全通貨での合計Pips表示 自動利確、損切り設定 設定以上のスプレッドになった場合には画面の色が変化 Break Evenラインの表示 チャート画像の保存 決済の通知機能(Email,SNS) パネル位置指定 Pips表示消去 他の通貨で設定した水平線で決済 下記に示した条件での利確 条件による決済:
Time Line for MT5 機能: 昨日高値、安値、本日始値、高値、安値の時間から線を引きます。 時間足により表示する時間が変わります。 1分、5分足では1時間ごとの表示 15分、30分足では4時間ごとの表示 1時間、4時間は12時間ごとの表示 日足以降は時間は表示されません。 高値安値は週足より下位足で表示されます。 各ラベルを変更可能になります。 更新頻度を変更できるのでチャート表示が 重くなることはありません。 各パラメータの説明: Server_Time:6 サーバとの時間差を入力 Yesterday_High_Label:昨日高値 Yesterday_Low_Label:昨日安値 Show_Open:true 始値の線を表示するかどうか Today_Open_Label:本日始値 Today_High_Label:本日高値 Today_Low_Label:本日安値 max_bar:true 使用するバーを制限するかどうか Maxbars:1500 制限を使用した場合に1分では5日分 UpdateFrequency:60 更新頻度、ディフォルトは
MTF MA2 for MT5
Koji Kobayashi
3 (1)
MTF-MA2 for MT5 特徴: MTF Moving Averageを8本一気に表示してくれるインジケータになります。 8本も必要ない場合にももちろん非表示にできます。 パフォーマンスを考慮しているのでチャートが重くなるようなことは 無いはずになります。どの通貨でも使用可能になります。 それぞれのMTF Moving Averageの色や太さを変更できます。 各パラメータの説明: Method:MAの種類設定をします。 Applied price:MAで使用する価格を設定をします。 TimeFrame M5:使用するMAの時間足を設定します。 Period M5:使用するMAの期間を設定します。 ※ラベルに関係なく8本のMTF MAはどの時間足でも期間設定可能になります。 Limited bar?:表示に使用するバーを制限するかどうかを設定します。 ※ここをFalseにするとすべてのバーを読み込むことになるのでチャートが重く なるかもしれません。ご注意ください。 Max bars:使用するバーの本数を設定します。過去検証をする場合にはここの値を増や
MTF-Candlestick (Traders Club) 特徴: このインジケータは上位足のローソク足を表示します。 この上位足のローソク足を表示のインジケータは特に1分足や 5分足トレーダ用に開発されたものになります。 現在のローソク足で上位足のローソク足を作成する部分 と過去の上位足のローソク足を作成する部分を 分けています。また、更新はティックごとではなく 指定した時間ごとになるので急な価格変動があった場合でも チャートがフリーズした状態には非常になりにくいということになります。 陽線や陰線の色を変更出来たり髭の太さを変更できるので非常に 見やすと思います。 各パラメータの説明: Indicator No:インジケータNoを設定します。もし同じチャートに複数適用したい場合には個々の数字を変更してください。 TimeFrame:表示する時間足を設定します。 Bullish candlestick color:陽線のローソク足の色の指定します。 Bearish candlestick color:陰線のローソク足の色の指定します。 Doji c
AKT for MT5 (Traders Club)  機能: MAゴールデンクロスで買いサイン、デットクロスで売りサインを表示します。 MAの期間は短期足と長期足を入力できます。 MAの種類を選択できます。(SMA、EMA、SMMA、LWMA) 適用する価格を選べます。(CLOSE,OPEN,LOW,HIGH,MEDIAN,TYPICAL,WEIGHTED) サインをアラートで通知します。 サイン発生をE-mailやSNSで通知します。 表示するサインを変更することが出来ます。 サインの色を変更することが出来ます。 サインの表示された時間と価格が表示されます。 ※価格は終値になります。 Indicator Noを変えることによるこのインジケータを複数適用することができます。 これにより違う MAの期間による ゴールデンクロスと  デットクロスのサインを 表示できます。
ResiSupo (Traders Club)  このインジケータは直近の高値と安値を抜いたときに何ら方法で 知る方法はないかと思い開発されました。 機能: 指定したローソク足の本数で終値をベースに最高値と最安値の ラインを自動で引きます。 最高値と最安値のラインにタッチするとアラートで通知します。 通知はE-mailやSNSにも送信することができます。 最高値と最安値のラインを終値か高値または安値ベースにするかを選択できます。 Indicator Noを変えることによるこのインジケータを複数適用することができます。 これにより過去80本と20本などでの最高値と最安値のラインを引くことが可能になります。 現在のATRの値を画面に表示します。 これにより現在のボラリティーの状況が一目で分かります。 表示されているSLはディフォルトではATR値の1.5倍になっています。 この数値は現時点でのボラリティーの状況からの損切り幅の目安となります。 ATRのレベルにより表示の色が変わります。 ボタンを押すことによりアラートの通知を無効にできます。 ※ネットワークの不安
新機能:Ver3.5 28通貨ペアの強弱も表示するようにしました。 監視ペアで最強、最弱の通貨ペアとなった場合、四つ葉のマークが出るように変更しました。 15分足、1時間足、4時間足単位での通貨ペアの強弱を表示するようにしました。 詳細な情報はこちらにサイトがあります。 https://toushika.top/tc-cs-plus-cfd/ 注:こちらはTitanのデモ口座で動作します。 XMで使用したい場合は こちらのでセットファイル を使用してください。 機能: 一目で現在の通貨の方向性と強弱が確認できます。 15M,1H,4Hでの方向性を表示します。 15M,1H,4Hでの方向が揃った場合にドットが表示されます。 通貨の相関が揃った場合にドットが表示されます。 ※相関はピアソン相関係数を使用しています。 より詳しい情報につきましてはこちらを参照してください。 https://www.mql5.com/ja/articles/5481 通貨の強弱を表示します。 現時点でのボラリティーの状況を表示します。 過去20日/過去5日/今日のボラリティーを
機能&特徴: ZigZagをもとに主要なレジスタンスとサポートラインを引きます。 各時間足で押し安値、戻り高値を簡単に把握できます。 現在何波目なのか簡単に把握できます。 ※ トレンド転換時はカウンターは1、継続時は2,3,4..となります。 ※ちなみにこちらはZigZagの谷山を数えています。エリオット波動数ではありません。 現在買い目線でいるべきなのか売り目線なのか簡把握できます。 過去2つのZigZagラインで静的にフィボナッチを引きます。 今の値動きで動的にフィボナッチを引きます。 逆フィボナッチ(静的なフィボナッチのみ)に変更することも可能になります。 ボタンにより以下の操作が可能になります。 1.ZigZagラインの表示、非表示 2.ノーマルフィボナッチ、逆フィボナッチの切り替え ※環境により表示に時間が掛かる場合があります。 3.1分足、5分足、15分足で1つ上のZigZagラインが引けるようになりました。 4.レジスタンスとサポートラインを再描写します。  トレンド継続や変換をアラートで通知します。 エリオ
MT5インジケータ TC-Alerts 開発経緯: 実はFXで簡単に勝てる手法があるんです。 それは。。。 主要な(4時間足以上、4時間足、日足、週足)のレジスタンスとサポートラインの反発を狙う FXは一方向には進まず90%以上で 必ず、必ずと言っていいほど、 どこかで反発します 。そこは大抵主要なレジスタンスとサポートラインまたは主要なフィボナッチラインなのです。 なのでそこに水平線を引いて ただ待つ のです。そこに到達したら、1分足や5分足に落として 長いヒゲ、ダブルボトム、ダブルヘッド、トリプルボトム、トリプルヘッド、三尊、逆三尊などの反転の形成を確認してエントリーする。 または、こちらを使用して https://www.mql5.com/ja/market/product/53987 強弱が弱くなってきたのを確認してエントリーすればいいのです。 これだけです。シンプルです!! うまく行くと、長期足レベルでレジスタンスとサポートライン間、つまり頭から尻尾まで取れる可能性もありますし、リスクリワードが異常にいいです。 そのためには、チャートに主要なレジスタンスと
ボリンジャーバンドは、価格変動を分析するためのテクニカル分析の1つのツールになります。 ボリンジャーバンドには、中心線と2つのバンドがあります。 中心線は、一般的には移動平均線(通常は20日間の単純移動平均)として計算されます。この中心線は、一定期間の価格の平均値を表しています。 ボリンジャーバンドのバンドは、中心線の上と下に等間隔で配置されます。通常は中心線から2つの標準偏差分だけ離れた位置に設定されます。 拡大(Expansion)とは、ボリンジャーバンドが広がる状態を指します。 つまり、上下のバンドが中心線から離れ、価格の変動範囲が広がっていることを示します。拡大は、相場が活発になり、価格の大幅な変動が起こりやすいことを示すことがあります。 収縮(Contraction)とは、ボリンジャーバンドが狭くなる状態を指します。 つまり、上下のバンドが中心線に近づき、価格の変動範囲が狭まっていることを示し、相場が方向感を失い、一時的に価格変動が鈍化していることを示すことがあります。 ボリンジャーバンドの収縮と拡大は、価格変動のパターンや相場の特徴を捉えるために重要な指
TC-Supportは手動取引とEA運用のために開発されたパネルになります。 このパネルでは、リスクリワード、リスク計算、リスク管理など資金管理、 トレーリングストップ機能、ブレークイーブンなどポジション管理が可能になります。 その他、便利な機能があります。 詳細な情報はこちらにサイトがあります。 デモ口座で動作するEAはこちらに置いてあります。   https://toushika.top/ mt5-tc-support / Disable Auto Trading  の 機能はMQL5では外部のDLLの利用は許可されませんので使用できません。 おもな機能一覧 資金管理 リスクリワード計算 ロット計算 損失金額計算 最大ロット数の設定 設定したリスクパーセンテージでヘッジポジション EA運用 最大損失金額またはパーセンテージによる強制クローズ EA運用 資金破綻回避  ポジション管理 成行、指値、Stop Limit注文に対応 ポジションを部分的にクローズ トレーリングストップ機能 一定の距離を超え
Filtro:
No hay comentarios
Respuesta al comentario
Versión 3.0 2024.02.08
2つのBBのクロスでサインが表示されます。

Sign ModeでBB_Cross_Custom2を選択

1つ目のBB
Time Frame for BB
BB Period
Standard Deviation

2つ目のBB
Time Frame for BB2
BB Period for BB2
Standard Deviation for BB2

Display sign alternavlyをTureで買いサインと売りサインを交互に表示します。
Versión 2.0 2022.09.07
BBと短期移動平均線のクロスでサインを買いサインと売りサインを交互に表示と
BBと短期移動平均線のクロスでサインを表示する条件を追加しました。

Sign ModeでBB_Cross_Custom1を選択してください。

Display sign alternavly:True 条件で買いサインと売りサインを交互に表示
Display sign alternavly:False BBと短期移動平均線のクロスでサインを表示