Wdi 91
- Indicadores
- Jose Wdison De Souza
- Versión: 1.5
- Activaciones: 10
Baseado no Setup 9.1 de Larry Williams, Wdi 91 se Adequa a Qualquer Média com o Mesmo Gatilho de Entrada. Experimente.
Como funciona?
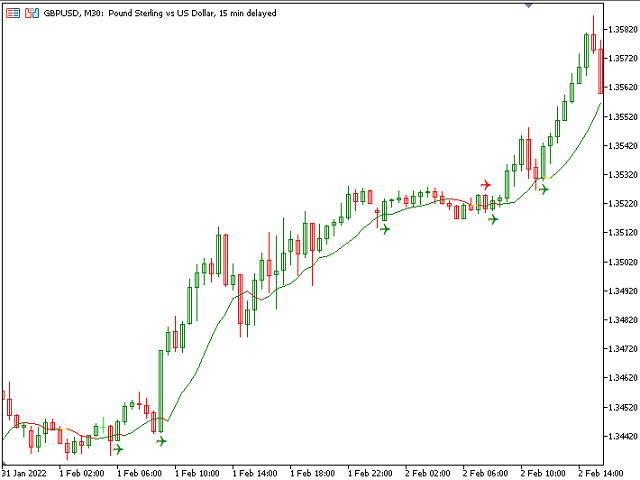
Nesse indicador o sinal de compra ou venda acontece quando o fechamento da vela vira a média móvel(Por padrão é MME de 9 períodos) e fica do outro lado da média.
Como usar?
A proposta por Larry Williams é entrar no trade com uma ordem stop um tick acima da máxima do candle com sinal de compra, colocando a ordem de stop loss um tick abaixo da mínima do candle. E para sinal de venda, colocar uma ordem stop de entrada um tick abaixo da mínima do candle com sinal de venda, com a ordem stop loss um tick acima da máxima da vela.
Se a ordem stop de entrada não for acionada no vela seguinte, você pode cancelar a ordem e esperar por um novo sinal.
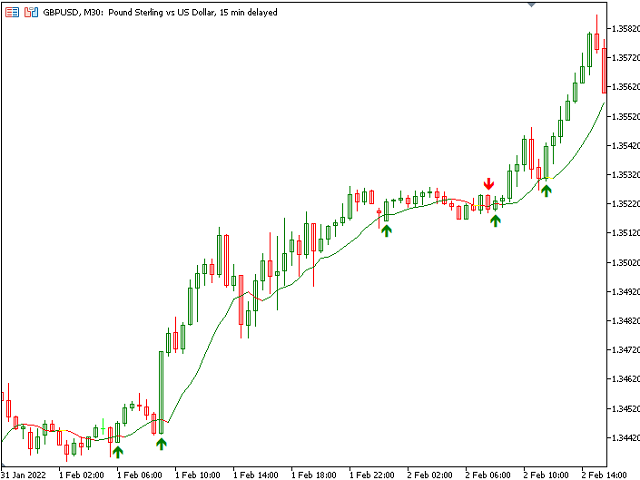
Se a ordem for acionada, a seta de sinal troca de cor e é possível então conduzir o stop loss baseado na MME de 9 períodos para sair da operação quando houver um sinal oposto, aproveitando ao máximo a nova tendência.
Dica:
O indicador é ótimo para entradas no início de grandes reversões, apenas tenha cautela em regiões estreitas de movimento lateral.
Vantagens:
- Possibilita diferentes cores para sinais ativados ou não, te permitindo analisar visualmente o histórico do ativo e tempo gráfico nesse Setup.
- Te permite usar diferentes formatos de ícones de entrada para não confundir com outros indicadores de seta que você já use.
Propriedades editáveis conforme sua preferência:
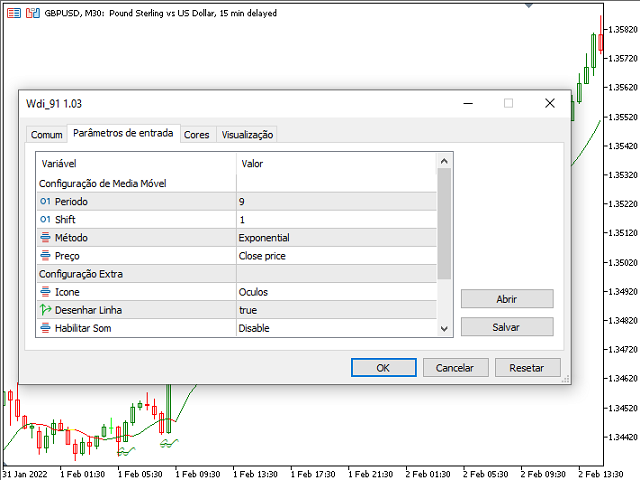
Toda a configuração da média móvel para a de sua preferencia
- O Periodo da média móvel
- O Shift da média móvel
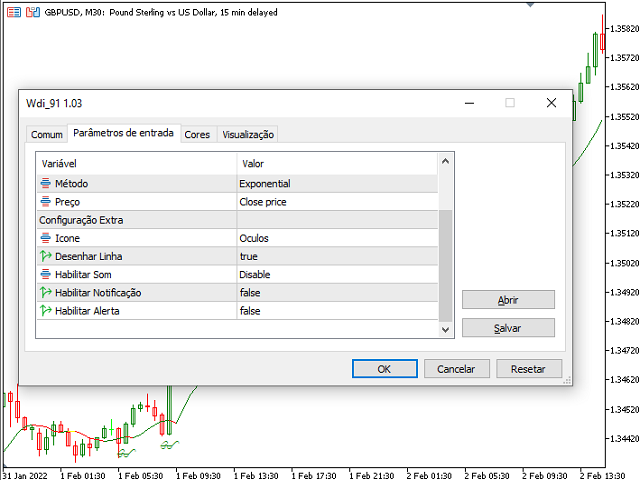
- O Método da média móvel
- Aplicado a da média móvel
- O Ícone do sinal
As configurações extras informativas e visuais:
- Desenhar Linha
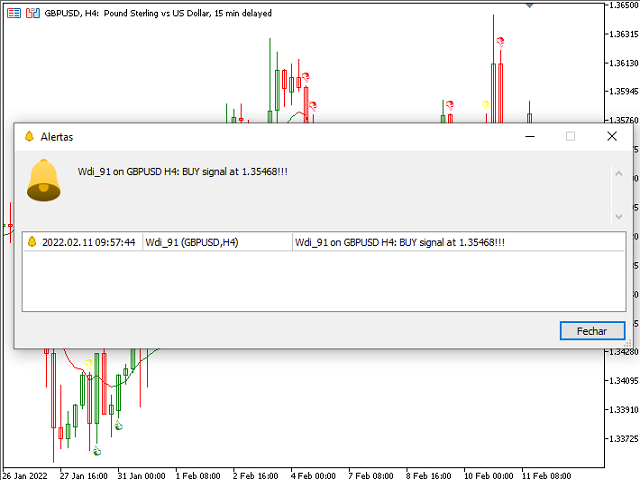
- Habilitar Som
- Habilitar Notificação
- Habilitar Alerta
Quem é o criador da estratégia?
Larry Williams é um renomado trader americano com mais de 60 anos de experiência, autor de 11 livros e criador de alguns indicadores como "Williams%R" e "Ultimate Oscillator".
Além disso, ele ganhou o Campeonato Mundial de Trading de Futuros em 1987, transformando $10.000 em $1.100.000 na competição, em apenas 12 meses, com dinheiro real.
Dez anos depois, sua filha Michelle Williams também venceu o campeonato, com um lucro de 1.000%.