• Información general
  • Comentarios (66)
  • Discusión (250)
  • Novedades

The 1 2 3 Pattern Scanner

4.75

** All Symbols x All Timeframes scan just by pressing scanner button **

After 17 years of experience in the markets and programming, Winner indicator is ready. I would like to share with you!

*** Contact me to send you instruction and add you in "123 scanner group" for sharing or seeing experiences with other users.

Introduction

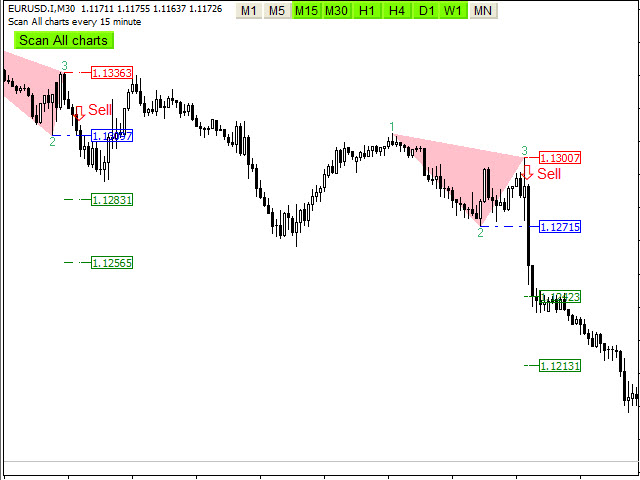
The 123 Pattern Scanner indicator with a special enhanced algorithm is a very repetitive common pattern finder with a high success rate. Interestingly, this Winner indicator indicates that the trend has changed its direction or the end of a trend retracement or even the 1 2 3 Pattern appears at the range market.

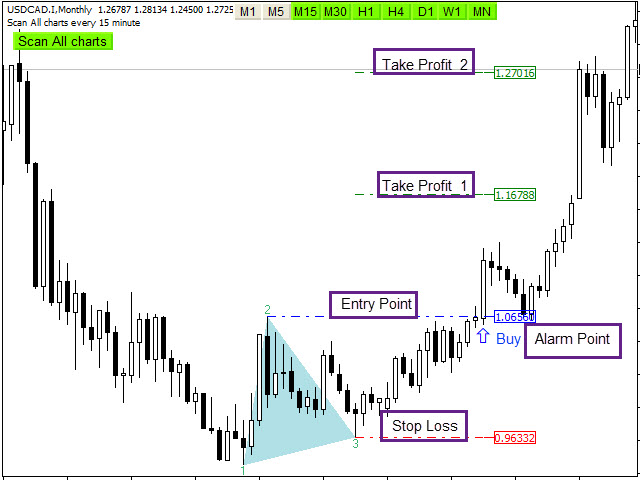
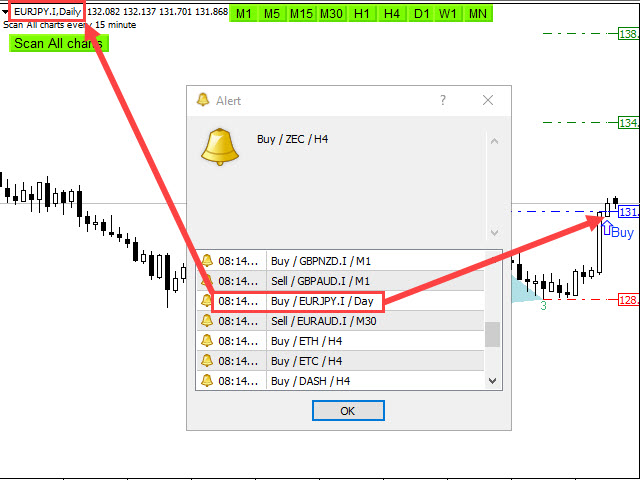
The 1,2,3 Pattern Scanner finds immediately with alarm and notification and also has stop loss, take profits and entry point with candlestick checking for easy trading.

Main Features

  • Use special enhanced algorithm
  • Detect the best and  most successful pattern with very repetitive in trend, swing and breakout.
  • Easy-to-use and user-friendly indicator
  • NO repaint
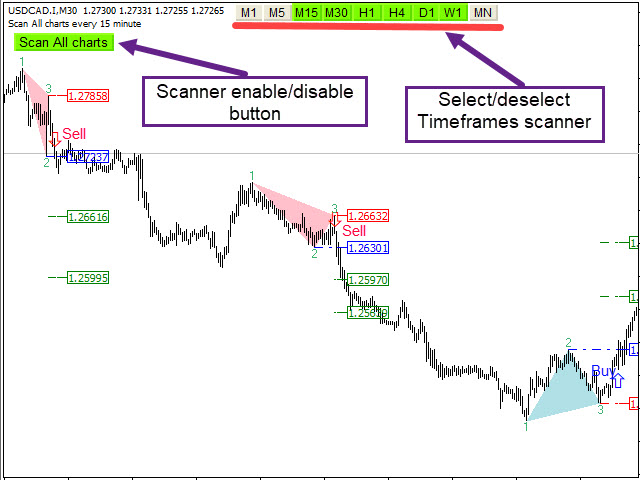
  • Scan all charts button ( Forex, Crypto, Indices and commodities)
  • Select and deselect time frames button for scan (M5,M15,M30,H1,H4,D1,W1,MN)
  • It displays and pushes notification stop-loss, entry-point and take-profit levels
  • Real Statistics Dashboard
  • Candlestick check for the best entry point
  • Method to choose how appearing pattern : breakout(after breakout the point 2) or pattern(in point 3)
  • Sending the alert and push notification, email and files
  • Alert enable/disable base on your setting time
  • Adjust the pattern setting
  • Risk to Reward : 1:2
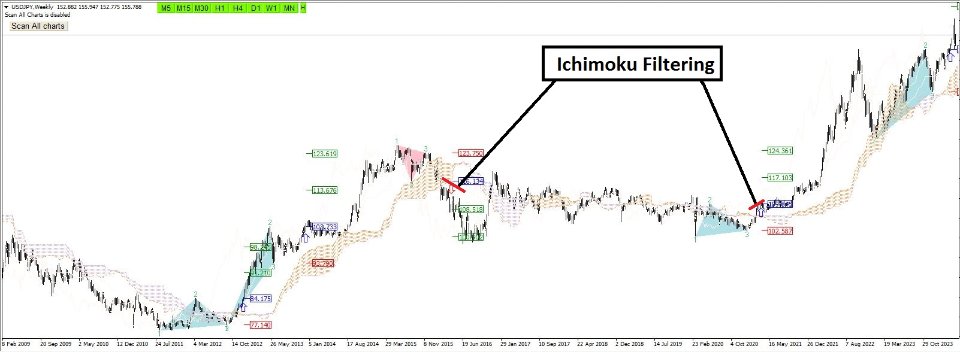
  • Ichimuku filtering

    Input Parameters

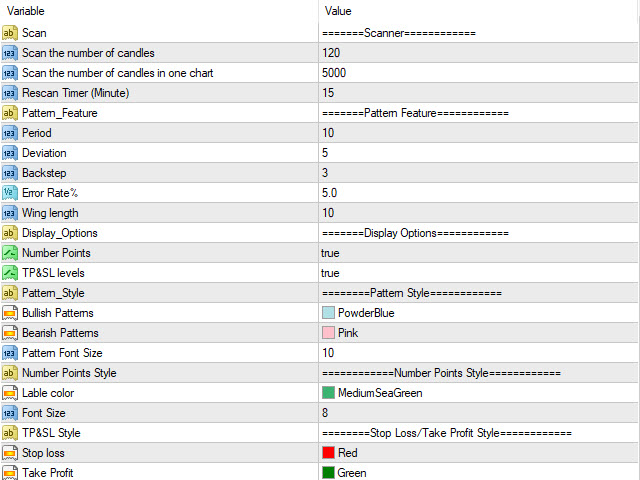
    =========Scanner============

    • Scan all charts - Enabled
    • Scan the number of candles – Amount of history bars to evaluate
    • Re-scan Timer – Re-scan all charts and all time frames after passing time
    • Method - choose how appearing a pattern : breakout(after breakout in point 2) or pattern(in point 3)

    =======Pattern Feature============

    • Pattern_Feature(Period, Deviation, Back step) - Algorithm Parameters for pattern recognition
    • Error_Rate – Maximum allowable error relative to pattern percentage
    • Wing length - Minimum distance between two legs in a pattern

    =======Display/style Options============

    • Display_Options – Display or do not display TP & SL levels
    • Stop Loss/Take Profit levels and Breakout Style - Set the Fonts and colors of patterns
    • Chart view - Color Scheme of chart (White / Black / Don't change)
    • Statistics Dashboard - Display or do not display Dashboard

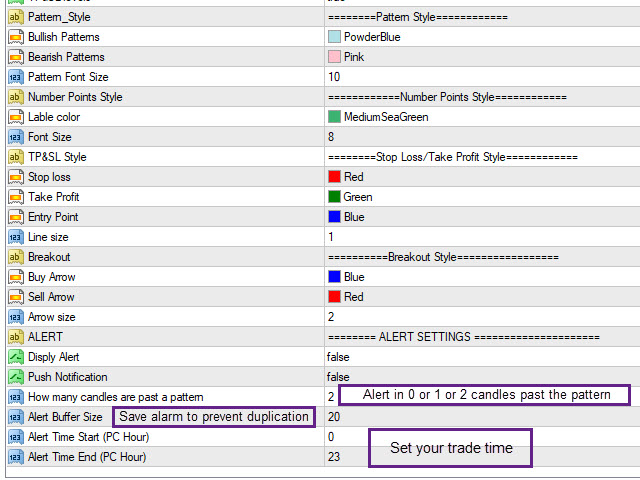
    ========ALERT SETTINGS ==========

    • Display Alert or Push Notification – Enable or disable Alert or Push Notification
    • How many candles are past a pattern – Maximum Number of candles Passed from a pattern to allow alert
    • Alert Buffer Size – Maximum save alert to prevent duplicate alerts
    • Alert start/end time  – Determine trading hours based on the computer clock to activate and deactivate the alarm
      Comentarios 20
      NaraChid
      71
      NaraChid 2024.09.25 17:07 
       

      Excellent tool and prompt support

      Khalid Karim
      395
      Khalid Karim 2024.09.12 07:36 
       

      great product. less but accurate signals. simple and smooth.

      aph.andy
      308
      aph.andy 2024.07.17 07:43 
       

      Very good indicator. If you follow the manual Reza give you, the indicator will be work like charm. Thank you for the support Reza. Really recommended.

      Productos recomendados
      Multi Timeframe ZigZag Indicator
      Salman A A A T Bakhash
      5 (2)
      Description: This indicator draw ZigZag Line in multiple time frame also search for Harmonic patterns before completion of the pattern. Features: Five instances of ZigZag indicators can be configured to any desired timeframe and inputs. Draw Harmonic pattern before pattern completion. Display Fibonacci retracement ratios. Configurable Fibonacci retracement ratios. Draw AB=CD based on Fibonacci retracement you define. You can define margin of error allowed in Harmonic or Fibonacci calculatio
      FREE
      Este indicador le dibujará los siguientes niveles: Línea abierta diaria: abajo está el mercado bajista, arriba está el mercado alcista. Rango diario promedio alto y bajo Altos y bajos del mercado asiático Los altos y bajos de ayer Estos niveles son fuertes niveles de soporte y resistencia a los que todos deben prestar atención. ¡Si no aprovechaste el tiempo para empezar! ¡Debes prestar atención cuando el precio se acerque a estos niveles! ¡Disfrute del comercio de forma más fácil!
      FREE
      FxSProMT
      Sergiy Podolyak
      5 (1)
      The FxSProMT indicator shows the current market trend and trend change. Indicator Parameters Ind_Period - the number of previous bars used to calculate actual values. Number_Bars - the number of bars to display the indicator.. Too many bars may significantly slow down the operation of the trading terminal. Signal_Sound - sound alert to notify of trend change. The sound can be played multiple times until the signal is confirmed (the bar closes). Default is disabled. Signal_Alert - an alert to n
      FREE
      Free automatic Fibonacci is an indicator that automatically plots a Fibonacci retracement based on the number of bars you select on the BarsToScan setting in the indicator. The Fibonacci is automatically updated in real time as new highest and lowest values appears amongst the selected bars. You can select which level values to be displayed in the indicator settings. You can also select the color of the levels thus enabling the trader to be able to attach the indicator several times with differe
      FREE
      CYCLE WAVE OSCILLATOR indicator is an indicator based on cyclical price fluctuations. This indicator can help you determine overbought and oversold levels, and help you predict price trends within the cycle. MT5 Version here!  You can combine it with our indicators below to make your trading decisions more accurate: Supply Demand Ribbon MT4 Basic Feature: - Three Trend Types: + Zero + Basic + Advanced
      FREE
      This indicator filters the Zigzag indicator to calculate the main support and resistance levels. Variables minimum gap between peaks : is the distance (GAP) between the peaks of the Zigzag peaks sensitivity : Minimum number of nearby peaks look back: it means that it has to test the last 50 peaks in the Zigzag object name perfix: a prefix for level’s line name on chart
      FREE
      Valable ZigZag
      Sergey Ermolov
      4.5 (6)
      Versión MT5  | Indicador Trend Monitor VZ  |  Indicador Owl Smart Levels  |  Estrategia Owl Smart Levels  |   FAQ La teoría de ondas de Elliott   es una interpretación de los procesos en los mercados financieros que se basa en un modelo Visual de ondas en gráficos de precios. El   indicador Valable ZigZag   muestra la estructura de onda del mercado en la que se puede confiar para tomar decisiones comerciales. El indicador Valable ZigZag es más estable y no cambia a menudo su dirección como el i
      FREE
      [La desviación de cada indicador MT4] es una colección de 18 indicadores, y uno de ellos puede seleccionarse arbitrariamente para participar en el cálculo. Puede calcular la forma de desviación de cada indicador y puede provocar una alarma. Descripción del ajuste de parámetros: [indicadores] es elegir uno de los 18 indicadores para participar en el cálculo (este parámetro es muy importante) . [período] es un ciclo común para cada indicador. [Método] es el modo MA de algunos indicadores
      FREE
      OrderBlock TS Roman
      Vladislav Vlastovskii
      3.8 (5)
      Индикатор строит блоки заказов (БЗ) по торговой системе (ТС) Романа. Поиск блоков осуществляется одновременно на двух таймфремах: текущем и старшем (определяемым в настройках). Для оптимизации и игнорирования устаревших блоков в настройках задается ограничение количества дней в пределах которых осуществляется поиск блоков. Блоки строятся по правилам ТС состоящем из трех шагов: какую свечу вынесли (что?); какой свечой вынесли (чем?); правило отрисовки (как?).
      FREE
      TrendPlus
      Sivakumar Subbaiya
      4.15 (13)
      Trend Plus   Trendplus  Indicator   Time Frame: Suitable for any time frame.  Purpose: Trend Prediction. Blue and red candle indicate the buy and sell call respectively. Buy: When the blue candle is formed buy call is initiated. close the buy trades when the next red candle will formed.   Sell: When the Red candle is formed Sell call is initiated. close the Sell trades when the next blue candle will formed.   Happy trade!!
      FREE
      MT Supply Demand
      Issara Seeboonrueang
      4 (4)
      We provide indicators tailored to better meet your trading requirements.   >>  MT Magical  <<   >>    MT Merit TLC   <<  MT Supply Demand : It is an indicator created to find supply and demand, which will be important support and resistance levels for the price.  Supply Zone   is a zone where the price has reached, it is often resisted. In other words, when the price reaches this zone, there will be more selling power to push the price back down. Demand Zone   is a zone where t
      FREE
      Introduction This indicator detects volume spread patterns for buy and sell opportunity. The patterns include demand and supply patterns. You might use each pattern for trading. However, these patterns are best used to detect the demand zone (=accumulation area) and supply zone (=distribution area). Demand pattern indicates generally potential buying opportunity. Supply pattern indicates generally potential selling opportunity. These are the underlying patterns rather than direct price action. T
      FREE
      RSX Signal 2 AM
      Andriy Matviyevs'kyy
      The indicator displays the signals of the RSX oscillator on the price chart. (To display these signals in a separate window, along with the oscillator, another indicator is used -  RSX Osc 4 AM ). It is optimal to use the indicator signals as signals to open a trade when the price overcomes the maximum or minimum of the bar at which the signal was given. An opposite signal cancels the previous signal. Settings: Data period for indicator calculation - data period for indicator calculation; Data
      FREE
      Necessary for traders: tools and indicators Waves automatically calculate indicators, channel trend trading Perfect trend-wave automatic calculation channel calculation , MT4 Perfect trend-wave automatic calculation channel calculation , MT5 Local Trading copying Easy And Fast Copy , MT4 Easy And Fast Copy , MT5 Local Trading copying For DEMO Easy And Fast Copy , MT4 DEMO Easy And Fast Copy , MT5 DEMO The homeopathic indicator is also called the CCI indicator. The CCI indicator was propos
      FREE
      Exclusive Channel on Zig Zag is a channel indicator for the MetaTrader 4 terminal. This indicator plots a channel based on the peaks of the standard ZigZag indicator. If you trade using the ZigZag indicator or channels, then Exclusive Channel on Zig Zag will suit you perfectly. Advantages of Exclusive Channel on Zig Zag The indicator is perfect for scalping and intraday trading. Suitable for beginners and experienced traders. Works on any financial instruments and markets. Works on all timefra
      Necessary for traders: tools and indicators Waves automatically calculate indicators, channel trend trading Perfect trend-wave automatic calculation channel calculation , MT4 Perfect trend-wave automatic calculation channel calculation , MT5 Local Trading copying Easy And Fast Copy , MT4 Easy And Fast Copy , MT5 Local Trading copying For DEMO Easy And Fast Copy , MT4 DEMO Easy And Fast Copy , MT5 DEMO Bandas de Bollinger avanzadas: 1. El riel de Bollinger cambiará de color con la dirección "
      FREE
      Discover the power of precision and efficiency in your trading with the " Super Auto Fibonacci " MT4 indicator. This cutting-edge tool is meticulously designed to enhance your technical analysis, providing you with invaluable insights to make informed trading decisions. Key Features: Automated Fibonacci Analysis: Say goodbye to the hassle of manual Fibonacci retracement and extension drawing. "Super Auto Fibonacci" instantly identifies and plots Fibonacci levels on your MT4 chart, saving you tim
      FREE
      Ratio market
      Aleksandr Krokhalev
      4.33 (15)
      Volatility under control. The indicator shows the optimal depth for setting goals within the day and on the average trend. It also builds pivot zones for the estimated correction depth. As an accompaniment, the key levels of the structure are displayed for several timeframes. Classical volatility indicators ATR & ADX on fixed timeframes are used for calculation. The calculation takes into account the spread, and if the market is slightly volatile, you will see a warning about the risk. You can c
      FREE
      RSI with Bands
      Amirhossein Ghasemi Moroodi
      Después de 7 años, he decidido liberar algunos de mis indicadores y Asesores Expertos (EA) de forma gratuita. Si los encuentras útiles, por favor  ¡Muestra tu apoyo con una valoración de 5 estrellas! Tu feedback me motiva a seguir proporcionando herramientas gratuitas. Explora mis otras herramientas gratuitas aquí . _________________________________ Indicador "RSI con Bandas" – Mejores Decisiones de Trading El Indicador "RSI con Bandas" combina el RSI clásico con bandas simples p
      FREE
      The Penta-O is a 6-point retracement harmonacci pattern which usually precedes big market movements. Penta-O patterns can expand and repaint quite a bit. To make things easier this indicator implements a twist: it waits for a donchian breakout in the right direction before signaling the trade. The end result is an otherwise repainting indicator with a very reliable trading signal. The donchian breakout period is entered as an input. [ Installation Guide | Update Guide | Troubleshooting | FAQ | A
      SMAconfirm
      Muhammad Robith
      This indicator helps you to comfirm SMAs' crossovers by draw a signal line that determines SMA movement direction. when Short SMA cross above Long SMA and Close price is above the signal several bars later, then uptrend is expected. when Short SMA cross below Long SMA and Close price is below the signal several bars later, then downtrend is expected. Input Description :  MA_Period_short: Short-term SMA's period. Used for short-term PriceX. Must be higher than 1.  MA_Period_long: Long-term SMA'
      FREE
      Fibonacci Ratio is useful to measure the target of a wave's move within an Elliott Wave structure. Different waves in an Elliott Wave structure relates to one another with Fibonacci Ratio. For example, in impulse wave: • Wave 2 is typically 50%, 61.8%, 76.4%, or 85.4% of wave 1. Fibonacci Waves could be used by traders to determine areas where they will wish to take profits in the next leg of an Up or Down trend.
      TIbors Timer
      Tibor Hartmut Sturm
      Indikator zur klaren Anzeige im Metatrader Dieser Indikator wurde von mir Entwickelt damit die Anzeige der relevanten Parameter klar und deutlich im Chart auf einen Blick zu sehen ist.  Er dient zur Information und ist ohne Gewähr.  Folgende Parameter werden angezeigt: -   Der  Aktuelle Kurs - Das Aktuelle Handelspaar - Die Restzeit zur nächsten Kerzenbildung / Zum Abschluss der Aktuellen Kerze - Die Kontonummer des Handelskontos - Die Frei Verfügbare Margin - Die Margin auf 1 Lot - Der Akt
      FREE
      UPD1 X00 Levels
      Vitaliy Kuznetsov
      5 (8)
      El indicador muestra niveles   redondos   en el gráfico. También se denominan niveles   psicológicos , bancarios o de jugadores importantes. En estos niveles, hay una verdadera pelea entre alcistas y bajistas, la acumulación de muchos pedidos, lo que conduce a una mayor volatilidad. El indicador se ajusta   automáticamente   a cualquier instrumento y período de tiempo. Cuando el   nivel 80   se rompe y luego se prueba,   compramos . Cuando el   nivel 20   se rompe y luego se prueba,   vendemos
      FREE
      Follow The Line
      Oliver Gideon Amofa Appiah
      4.07 (14)
      FOLLOW THE LINE GET THE FULL VERSION HERE: https://www.mql5.com/en/market/product/36024 This indicator obeys the popular maxim that: "THE TREND IS YOUR FRIEND" It paints a GREEN line for BUY and also paints a RED line for SELL.  It gives alarms and alerts of all kinds. IT DOES NOT REPAINT and can be used for all currency pairs and timeframes. Yes, as easy and simple as that. Even a newbie can use it to make great and reliable trades. NB: For best results, get my other premium indicators for more
      FREE
      Fx BFP Pivot Points
      Maged Ait Abbi
      5 (5)
      A forex   pivot point   strategy could very well be a trader’s best friend as far as identifying levels to develop a bias, place stops and identify potential profit targets for a trade. Pivot points have been a go-to for traders for decades. The basis of pivot points is such that price will often move relative to a previous limit, and unless an outside force causes the price to do so, price should stop near a prior extreme. Pivot point trading strategies vary which makes it a versatile tool for
      FREE
      El Capturador de Tendencias: La Estrategia del Capturador de Tendencias con Indicador de Alerta es una herramienta versátil de análisis técnico que ayuda a los traders a identificar las tendencias del mercado y los posibles puntos de entrada y salida. Presenta una Estrategia dinámica del Capturador de Tendencias, adaptándose a las condiciones del mercado para una clara representación visual de la dirección de la tendencia. Los traders pueden personalizar los parámetros para que se ajusten a s
      FREE
      Triple RSI
      Pablo Leonardo Spata
      1 (1)
      MIRA LA SIGUIENTE ESTRATEGIA CON ESTE INDICADOR. Triple RSI es una herramienta que utiliza el clásico RSI, pero en varios períodos de tiempo para encontrar reversiones del mercado.    1.  ️ Idea detrás del indicador y su estrategia: En el trading, ya sea Forex o cualquier otro activo, lo ideal es mantenerlo simple, cuanto más simple, mejor . La estrategia triple RSI es una de las estrategias simples que buscan retornos de mercado. En nuestra experiencia, donde siempre hay más dinero p
      FREE
      Vispucci
      Abraham Correa
      Behaving in a similar fashion as the price action of a chart, the indicator uses " Trix " to opportune itself to the exposure of divergency, flat/low market volume, and price action expansion . The TRIX indicator nicknamed after the  Triple-Exponential-average,  is a momentum-based oscillator that filters minor price changes and fluctuations that are considered insignificant for forex trading whilst providing money making opportunities!  Overall, TRIX is a leading indicator that shows diverge
      FREE
      ScalperX
      Mustafa Sabir
      First of all, it is worth highlighting here that this Trading Indicator is Non Repainting, Non Redrawing and Non Lagging, which makes it ideal for manual trading. Never repaint and recalculate Once an arrow appears it never disappears, the signal comes at the opening of the new candle You will now be more profitable with this indicator You can do swing trading or scalping trading The indicator helps you identify the trend Can be optimized across all pairs and time frames Blue arrow is for buyin
      FREE
      Los compradores de este producto también adquieren
      Gann Made Easy
      Oleg Rodin
      4.83 (93)
      Gann Made Easy es un sistema de comercio de Forex profesional y fácil de usar que se basa en los mejores principios de comercio utilizando la teoría del Sr. W. D. Gann. El indicador proporciona señales precisas de COMPRA y VENTA, incluidos los niveles de Stop Loss y Take Profit. Puede comerciar incluso sobre la marcha utilizando notificaciones PUSH. ¡Por favor, póngase en contacto conmigo después de la compra! ¡Compartiré mis consejos comerciales con usted y excelentes indicadores de bonificació
      Bull versus Bear
      Mohamed Hassan
      4.75 (8)
      Official Release price of $65 for the first 56 /60   copies ( 4  copies left). Next price is $120 !  Send us a message after your purchase to receive more information on how to get your  BONUS  for FREE  that works in great combination with Bull vs Bear ! Bull versus Bear is an easy-to-use Forex indicator that gives traders clear and accurate signals based on clear trend retests . Forget about lagging indicators or staring at charts for hours because  Bull vs Bear provides real-time entries
      - Real price is 80$ - 40% Discount ( It is 49$ now ) Contact me for instruction, add group and any questions! Related Products:  Bitcoin Expert , Gold Expert Introduction The breakout and retest strategy is traded support and resistance levels. it involves price breaking through a previous level.  The break and retest strategy is designed to help traders do two main things, the first is to avoid false breakouts. Many false breakouts start with a candlestick that breaks out of a level but ends w
      TPSpro RFI Levels
      Roman Podpora
      4.82 (22)
      INSTRUCCIONES      RUSO  -  ING     Se recomienda utilizar con un indicador.   -    TPSpro   TENDENCIA PRO -   Versión MT5 Un elemento clave en el trading son las zonas o niveles desde los que se toman las decisiones de compra o venta de un instrumento de trading. A pesar de los intentos de los principales actores de ocultar su presencia en el mercado, inevitablemente dejan rastros. Nuestra tarea era aprender a identificar estos rastros e interpretarlos correctamente. Funciones principales: ¡Mo
      ¡LEA LA INFORMACIÓN A CONTINUACIÓN ANTES DE COMPRAR EL PRODUCTO! ¡Apollo Pips PLUS SP es un producto único! ¡ES PARA AQUELLOS QUE QUIEREN OBTENER MI NUEVO INDICADOR "APOLLO PIPS" MÁS BONO "SUPER PACK" CON ACCESO A TODOS MIS INDICADORES COMERCIALES! Al comprar el producto Apollo Pips PLUS SP, en realidad está comprando una versión absolutamente nueva de mi indicador Apollo Pips. Esta versión del indicador tiene un algoritmo mejorado y un parámetro fácil de usar que le brinda la oportunidad de uti
      Trend Screener
      STE S.S.COMPANY
      4.81 (88)
      Indicador de tendencia, solución única e innovadora para el comercio y filtrado de tendencias con todas las funciones de tendencias importantes integradas en una sola herramienta. Es un indicador 100% sin repintar de marcos temporales y monedas múltiples que se puede usar en todos los símbolos/instrumentos: divisas, materias primas, criptomonedas, índices y acciones. OFERTA POR TIEMPO LIMITADO: El indicador de detección de soporte y resistencia está disponible por solo 50$ y de por vida. (Precio
      TPSproTREND PrO
      Roman Podpora
      4.79 (19)
      TPSpro TREND PRO   es un indicador de tendencia que analiza automáticamente el mercado y proporciona información sobre la tendencia y cada uno de sus cambios, además de dar señales para ingresar operaciones sin volver a dibujar. El indicador utiliza cada vela, analizándolas por separado. refiriéndose a diferentes impulsos: impulso hacia arriba o hacia abajo. ¡Puntos de entrada exactos a transacciones de divisas, criptomonedas, metales, acciones e índices! Versión MT5                   DESCRIPCI
      Scalper Inside PRO
      Alexey Minkov
      4.73 (56)
      An exclusive indicator that utilizes an innovative algorithm to swiftly and accurately determine the market trend. The indicator automatically calculates opening, closing, and profit levels, providing detailed trading statistics. With these features, you can choose the most appropriate trading instrument for the current market conditions. Additionally, you can easily integrate your own arrow indicators into Scalper Inside Pro to quickly evaluate their statistics and profitability. Scalper Inside
      FX Volume
      Daniel Stein
      4.58 (33)
      Obtenga su actualización diaria del mercado con detalles y capturas de pantalla a través de nuestro Morning Briefing aquí en mql5 y en Telegram ! FX Volume es el PRIMER y ÚNICO indicador de volumen que proporciona una visión REAL del sentimiento del mercado desde el punto de vista de un bróker. Proporciona una visión impresionante de cómo los participantes institucionales del mercado, como los brokers, están posicionados en el mercado Forex, mucho más rápido que los informes COT. Ver esta info
      FX Power MT4 NG
      Daniel Stein
      5 (13)
      Obtenga su actualización diaria del mercado con detalles y capturas de pantalla a través de nuestro Morning Briefing aquí en mql5 y en Telegram ! FX Power MT4 NG es la nueva generación de nuestro popular medidor de fuerza de divisas, FX Power. ¿Y qué ofrece este medidor de fuerza de nueva generación? Todo lo que le encantaba del FX Power original PLUS Análisis de fuerza de ORO/XAU Resultados de cálculo aún más precisos Períodos de análisis configurables individualmente Límite de cálculo persona
      Trend Punch
      Mohamed Hassan
      4.95 (21)
      This indicator is unstoppable when combined with our other indicator called  Support & Resistance . After purchase, send us a message and you will get it   for  FREE as a BONUS! Introducing Trend Punch , the revolutionary forex trend indicator that will transform the way you trade! Trend Punch is uniquely designed to provide precise buy and sell arrows during strong market trends, making your trading decisions clearer and more confident. Whether you're trading major currency pairs or exotic sym
      Atomic Analyst
      Issam Kassas
      5 (2)
      En primer lugar, vale la pena enfatizar que este Indicador de Trading no repinta, no redibuja y no se retrasa, lo que lo hace ideal tanto para el trading manual como para el automatizado. Manual del usuario: configuraciones, entradas y estrategia. El Analista Atómico es un Indicador de Acción del Precio PA que utiliza la fuerza y el impulso del precio para encontrar una mejor ventaja en el mercado. Equipado con filtros avanzados que ayudan a eliminar ruidos y señales falsas, y aumentan el poten
      Este tablero muestra los últimos patrones armónicos disponibles para los símbolos seleccionados, por lo que ahorrará tiempo y será más eficiente / versión MT5 . Indicador gratuito: Basic Harmonic Pattern Columnas del indicador Symbol: aparecerán los símbolos seleccionados Trend : alcista o bajista Pattern : tipo de patrón (gartley, mariposa, murciélago, cangrejo, tiburón, cifrado o ABCD) Entry : precio de entrada SL: precio de stop loss TP1: 1er precio de toma de beneficios TP2: 2º precio de
      Dynamic Forex28 Navigator
      Bernhard Schweigert
      5 (2)
      Dynamic Forex28 Navigator: la herramienta de trading de Forex de última generación. ACTUALMENTE CON UN 49 % DE DESCUENTO. Dynamic Forex28 Navigator es la evolución de nuestros indicadores populares de larga data, que combina el poder de tres en uno: Indicador avanzado Currency Strength28 (695 reseñas) + Indicador avanzado Currency IMPULSE con ALERT (520 reseñas) + Señales combinadas CS28 (bonificación). Detalles sobre el indicador https://www.mql5.com/en/blogs/post/758844 ¿Qué ofrece el i
      Enigmera
      Ivan Stefanov
      5 (3)
      ENIGMERA: El núcleo del mercado https://www.enigmera.com Introducción Este indicador y sistema de negociación es un enfoque extraordinario de los mercados financieros. ENIGMERA utiliza los ciclos fractales para calcular con precisión los niveles de soporte y resistencia. Muestra la auténtica fase de acumulación y proporciona dirección y objetivos.  Un sistema que funciona tanto si estamos en una tendencia como en una corrección.  ¿Cómo funciona? ENIGMERA consta de tres líneas: la línea de s
      Deja un comentario después de la compra para recibir 4 indicadores de alta calidad como bono. El indicador Chart Patterns All-in-One ayuda a los traders a visualizar varios patrones de gráficos comúnmente utilizados en el análisis técnico. Este indicador apoya la identificación de posibles comportamientos del mercado, pero no garantiza rentabilidad. Se recomienda probar el indicador en modo demo antes de comprar. Oferta actual : Descuento del 50% en el indicador "Chart Patterns All in One". Patr
      Currency Strength Exotics
      Bernhard Schweigert
      4.87 (31)
      ¡ACTUALMENTE 20% DE DESCUENTO ! ¡La mejor solución para cualquier operador novato o experto! Este indicador está especializado en mostrar la fuerza de la divisa para cualquier símbolo como Pares Exóticos, Materias Primas, Índices o Futuros. Es el primero de su clase, cualquier símbolo se puede añadir a la 9 ª línea para mostrar la verdadera fuerza de la moneda de Oro, Plata, Petróleo, DAX, US30, MXN, TRY, CNH etc. Se trata de una herramienta de trading única, de alta calidad y asequible por
      Stratos Pali
      Michela Russo
      5 (1)
      Stratos Pali Indicator   is a revolutionary tool designed to enhance your trading strategy by accurately identifying market trends. This sophisticated indicator uses a unique algorithm to generate a complete histogram, which records when the trend is Long or Short. When a trend reversal occurs, an arrow appears, indicating the new direction of the trend. Important Information Revealed Leave a review and contact me via mql5 message to receive My Top 5 set files for Stratos Pali at no cost! D
      How to use Pair Trading Station Pair Trading Station is recommended for H1 time frame and you can use it for any currency pairs. To generate buy and sell signal, follow few steps below to apply Pair Trading Station to your MetaTrader terminal. When you load Pair Trading Station on your chart, Pair Trading station will assess available historical data in your MetaTrader platforms for each currency pair. On your chart, the amount of historical data available will be displayed for each currency pai
      TakePropips Donchian Trend Pro
      Eric John Pajarillaga Aldana
      4.44 (16)
      ¡TakePropips Donchian Trend Pro   (MT4) es una herramienta poderosa y efectiva que detecta automáticamente la dirección de la tendencia utilizando el Canal Donchian y le proporciona señales comerciales de entrada y salida! Este indicador multifunción incluye un escáner de tendencias, señales comerciales, panel estadístico, filtro, sesiones comerciales y panel de historial de alertas. ¡Está diseñado para proporcionarle señales comerciales y ahorrarle horas analizando los gráficos! Puede descargar
      ¡Este indicador es un indicador para el análisis automático de ondas que es perfecto para practicar el trading real! Caso... Nota:   No estoy acostumbrado a usar nombres occidentales para clasificar las ondas. Debido a la influencia de la convención de nomenclatura de Tang Lun (Tang Zhong Shuo Zen), nombré la onda básica como   pluma   y la banda de onda secundaria como   segmento   . Al mismo tiempo, el segmento tiene la dirección de la tendencia. Se nombra   el segmento de tendencia princip
      Introduciendo       Indicador Quantum Trend Sniper   , el innovador indicador MQL5 que está transformando la forma en que identificas y negocias los cambios de tendencia. Desarrollado por un equipo de comerciantes experimentados con experiencia comercial de más de 13 años,       Indicador de francotirador de tendencia cuántica       está diseñado para impulsar su viaje comercial a nuevas alturas con su forma innovadora de identificar cambios de tendencia con una precisión extremadamente alta.
      Currency Strength Matrix
      Raymond Gilmour
      4.5 (26)
      THE ONLY CURRENCY STRENGTH INDICATOR THAT IS BASED ON PRICE ACTION. DESIGNED FOR TREND, MOMENTUM & REVERSAL TRADERS This indicator  reads price action to confirm trend and strength . Advanced multi-currency and multi-time frame indicator that shows you simply by looking at one chart, every currency pair that is trending and the strongest and weakest currencies driving those trends. For full details on how to use this indicator, and also how to get a FREE chart tool, please see user manual HER
      Advanced Supply Demand
      Bernhard Schweigert
      4.91 (295)
      ¡Actualmente con 33% de descuento! ¡La mejor solución para cualquier tráder principiante o experto! Este indicador es una herramienta comercial única, de alta calidad y asequible, porque incorpora una serie de características patentadas y una nueva fórmula. Con esta actualización, podrá mostrar zonas de doble marco temporal. No solo podrá mostrar un marco temporal más alto, sino también mostrar ambos, el marco temporal del gráfico MÁS el marco temporal más alto: MOSTRANDO ZONAS ANIDADAS. A todos
      FX Levels es un indicador de soporte y resistencia excepcionalmente preciso que fusiona el método Lighthouse tradicional con un enfoque dinámico innovador, funcionando a la perfección en todos los símbolos de negociación. Esto incluye pares de divisas, índices, acciones o materias primas. FX Levels identifica puntos de reversión y los muestra en el gráfico, que pueden utilizarse idealmente como objetivos de beneficios en sus actividades de negociación. En el desarrollo de FX Levels, hemos utili
      TrendMaestro
      Stefano Frisetti
      5 (3)
      note: this indicator is for METATRADER4, if you want the version for METATRADER5 this is the link:  https://www.mql5.com/it/market/product/108106 TRENDMAESTRO ver 2.4 TRENDMAESTRO recognizes a new TREND in the bud, he never makes mistakes. The certainty of identifying a new TREND is priceless. DESCRIPTION TRENDMAESTRO identifies a new TREND in the bud, this indicator examines the volatility, volumes and momentum to identify the moment in which there is an explosion of one or more of these data a
      ACTUALMENTE 26% DE DESCUENTO ¡La mejor solución para cualquier operador novato o experto! Este indicador es una herramienta única, de alta calidad y asequible porque hemos incorporado una serie de características propias y una nueva fórmula. ¡Con sólo UN gráfico puede leer la Fuerza de la Divisa para 28 pares de Divisas! Imagínese cómo mejorará su operativa porque podrá señalar el punto exacto de activación de una nueva tendencia o de una oportunidad de scalping. Manual del usuario: haga
      (Actualmente 30% DE DESCUENTO) Antes de leer la descripción de este indicador, solo quiero presentarles el siguiente concepto LÍNEA PROMEDIO EN MOVIMIENTO: promedio móvil típico que se basa en un solo gráfico. LÍNEA DE FUERZA DE LA DIVISA: el promedio móvil de un determinado par en el que la fuerza se basa en 28 pares. Se puede decir que es la LÍNEA PROMEDIO EN MOVIMIENTO REAL. De hecho, la media móvil es uno de los indicadores más populares que utilizan casi todos los operadore
      Este indicador está diseñado para gráficos en vivo, no para el probador. El indicador PRO Trend Divergence es una herramienta avanzada de análisis técnico diseñada para detectar divergencias de continuación de tendencia , una señal de que la tendencia actual probablemente continuará. A diferencia de los indicadores tradicionales que se centran en los cambios de tendencia, esta herramienta permite identificar cuando la tendencia sigue siendo fuerte, incluso durante retrocesos o correcciones menor
      ¡Actualmente 20% OFF ! ¡La mejor solución para cualquier novato o trader experto! Este software funciona con 28 pares de divisas. Se basa en 2 de nuestros principales indicadores (Advanced Currency Strength 28 y Advanced Currency Impulse). Proporciona una gran visión general de todo el mercado de divisas. Muestra los valores de Advanced Currency Strength, la velocidad de movimiento de las divisas y las señales para 28 pares de divisas en todos los (9) marcos temporales. Imagine cómo mejorar
      Otros productos de este autor
      ** All Symbols x All Timeframes scan just by pressing scanner button ** *** Contact me  to send you instruction and add you in "123 scanner group" for sharing or seeing experiences with other users. After 17 years of experience in the markets and programming, Winner indicator is ready. I would like to share with you! Introduction The 123 Pattern Scanner indicator with a special enhanced algorithm is a very repetitive common pattern finder with a high success rate . Interestingly, this Winner in
      AI Swing MT4
      Reza Aghajanpour
      5 (1)
      Introduction : AI Swing EA is a fully automated trader with Fixed SL and high win rate. The price is $1000, But now it is just $249, Limited time offer is active. Real Live Signal 1:  https://www.mql5.com/en/signals/2264899 Real Live Signal 2: https://www.mql5.com/en/signals/2256860 No Martingale, No Grid Contact me  to send you instruction and add you in group. Passed Prop Firm challenges The next generation G P T AI model quickly gained significant attention with its broad range of capabili
      **   All Symbols   x   All Timeframes   scan just by pressing scanner button ** *** Contact me  to send you instruction and add you in "Trend Reversal group" for sharing or seeing experiences with other users. Introduction: Trendlines are the most famous technical analysis in trading . Trendlines continually form on the charts of markets across all the different timeframes providing huge opportunities for traders to jump in and profit on the action. In the other hand,  The trendline reversal str
      Swing Scanner
      Reza Aghajanpour
      4.6 (20)
      ** All Symbols x All Time frames scan just by pressing scanner button ** *** Contact me  to send you instruction and add you in "Swing scanner group" for sharing or seeing experiences with other users. Swing EA:  https://www.mql5.com/en/market/product/124747 Introduction: Swing Scanner is the indicator designed to detect swings in the direction of the trend and possible reversal swings. The indicator studies several price and time vectors to track the aggregate trend direction and detects situa
      Trend Reversal MT4
      Reza Aghajanpour
      5 (6)
      **   All Symbols   x   All Timeframes   scan just by pressing scanner button ** *** Contact me  to send you instruction and add you in "Trend Reversal group" for sharing or seeing experiences with other users. Introduction: Trendlines are the most famous technical analysis in trading . Trend lines continually form on the charts of markets across all the different timeframes providing huge opportunities for traders to jump in and profit on the action. In the other hand,  The trend line reversal s
      Market Structure
      Reza Aghajanpour
      4.85 (26)
      ** All Symbols x All Timeframes scan just by pressing scanner button ** *** Contact me  to send you instruction and add you in "Market Structure group" for sharing or seeing experiences with other users. Introduction: Market structure is important for both new and professional traders since it can influence the liquidity and price action of a market (Breakout and Retest). It’s also one of the most commonly used techniques to understand trends, identify potential reversal points, and get a feel f
      QM Pattern Scanner MT5
      Reza Aghajanpour
      5 (3)
      Contact me  to send you instruction and add you in group. QM (Quasimodo) Pattern is based on Read The Market(RTM) concepts. The purpose of this model is to face the big players of the market (financial institutions and banks), As you know in financial markets, big traders try to fool small traders, but RTM prevent traders from getting trapped. This style is formed in terms of price candles and presented according to market supply and demand areas and no price oscillator is used in it. RTM con
      All Divergence Scanner MT4
      Reza Aghajanpour
      4.93 (15)
      ** All Symbols x All Timeframes scan just by pressing scanner button ** *** Contact me  to send you instruction and add you in "All Divergences scanner group" for sharing or seeing experiences with other users. Introduction Divergence is a main technique used to determine trend reversing when it’s time to sell or buy because prices are likely to drop or pick in the charts. All Divergence indicator can help you locate the top and bottom of the market. This indicator finds Regular divergences for
      Market Structure MT5
      Reza Aghajanpour
      5 (3)
      **   All Symbols   x   All Timeframes   scan just by pressing scanner button ** *** Contact me  to send you instruction and add you in "Market Structure group" for sharing or seeing experiences with other users. Introduction: Market structure is important for both new and professional traders since it can influence the liquidity and price action of a market. It’s also one of the most commonly used techniques to understand trends, identify potential reversal points, and get a feel for current mar
      Head and Shoulder MT4
      Reza Aghajanpour
      5 (4)
      **   All Symbols   x   All Timeframes   scan just by pressing scanner button ** *** Contact me  to send you instruction and add you in "Head & Shoulders Scanner group" for sharing or seeing experiences with other users. Introduction: Head and Shoulders   Pattern  is a very repetitive common type of price reversal patterns. The pattern appears on all time frames and can be used by all types of traders and investors.   The  Head and Shoulders  Scanner indicator  Scans All charts just by pressing o
      QM Pattern Scanner MT4
      Reza Aghajanpour
      4.8 (5)
      Contact me  to send you instruction and add you in group. QM (Quasimodo) Pattern is based on Read The Market(RTM) concepts. The purpose of this model is to face the big players of the market (financial institutions and banks), As you know in financial markets, big traders try to fool small traders, but RTM prevent traders from getting trapped. This style is formed in terms of price candles and presented according to market supply and demand areas and no price oscillator is used in it. RTM con
      AI Next Level
      Reza Aghajanpour
      5 (1)
      The next generation G P T AI model quickly gained significant attention with its broad range of capabilities and versatility, We used its expertise in assisting prediction prices in formulating and applying improved trading strategies. Our AI core is capable of extracting data insights from financial news, Sentiment Analysis , specific formula, Oscillators and indicators status and other unstructured data sources. This information can then be used in conjunction with other datasets to make our
      Wolfe Wave Scanner MT5
      Reza Aghajanpour
      5 (6)
      **  All Symbols  x  All Timeframes  scan just by pressing scanner button ** *** Contact me  to send you instruction and add you in "Wolfe Wave Scanner group" for sharing or seeing experiences with other users. Introduction: A Wolfe Wave is created with five-wave patterns in price. It shows supply and demand and a fight towards a balance price. T hese waves of price actions can help traders identify the boundaries of   the trend . Also  It helps forecast how the price will move in the near futu
      ABCD Pattern Scanner
      Reza Aghajanpour
      5 (19)
      ** All Symbols x All Timeframes scan just by pressing scanner button ** *** Contact me  to send you instruction and add you in "ABCD scanner group" for sharing or seeing experiences with other users. Introduction This indicator scans AB=CD retracement patterns in all charts. The ABCD is the basic foundation for all harmonic patterns and highly repetitive with a high success rate . The ABCD Scanner indicator is a scanner reversal ABCD pattern that helps you identify when the price is about to ch
      Market Heartbeat is in your hand! Introduction The Market Heartbeat indicator with a   special enhanced algorithm   (volume, money flow, cycle of market and a secret value) is a very repetitive trend finder with a high success rate .   Interestingly, this   Winner indicator   indicates that the trend has changed its direction or the end of a trend retracement or even appears at the range market. The Market Heartbeat can use in scalping trading or trend trading. It finds immediately with alarm, n
      ** All Symbols x All Timeframes scan just by pressing scanner button ** *** Contact me  to send you instruction and add you in "ABCD scanner group" for sharing or seeing experiences with other users. Introduction This indicator scans AB=CD retracement patterns in all charts. The ABCD is the basic foundation for all harmonic patterns and highly repetitive with a high success rate . The ABCD Scanner indicator is a scanner reversal ABCD pattern that helps you identify when the price is about to cha
      M W Scanner MT5
      Reza Aghajanpour
      5 (6)
      **   All Symbols   x   All Timeframes   scan just by pressing scanner button ** *** Contact me  to send you instruction and add you in "M W Scanner group" for sharing or seeing experiences with other users. Introduction: Double Top(M) and Double Bottom(W) is a very repetitive common type of price reversal patterns. Double Top resembles M pattern and indicates bearish reversal whereas Double Bottom resembles W pattern and indicates a bullish reversal that they have  high win  rate. The M W Scanne
      M W Scanner
      Reza Aghajanpour
      5 (8)
      **   All Symbols   x   All Timeframes   scan just by pressing scanner button ** *** Contact me  to send you instruction and add you in "M W Scanner group" for sharing or seeing experiences with other users. Introduction: Double Top(M) and Double Bottom(W) is a very repetitive common type of price reversal patterns. Double Top resembles M pattern and indicates bearish reversal whereas Double Bottom resembles W pattern and indicates a bullish reversal that they have  high win  rate. The M W Scanne
      Wolfe Wave Scanner MT4
      Reza Aghajanpour
      4.56 (9)
      **  All Symbols  x  All Timeframes  scan just by pressing scanner button ** *** Contact me  to send you instruction and add you in "Wolfe Wave Scanner group" for sharing or seeing experiences with other users. Introduction: A Wolfe Wave is created with five-wave patterns in price. It shows supply and demand and a fight towards a balance price. T hese waves of price actions can help traders identify the boundaries of   the trend . Also  It helps forecast how the price will move in the near future
      Harmonic Pattern Scanner
      Reza Aghajanpour
      4.67 (15)
      ** All Symbols x All Time frames scan just by pressing scanner button ** *** Contact me  to send you instruction and add you in "Harmonic Scanner group" for sharing or seeing experiences with other users. Introduction Harmonic Patterns are best used to predict turning point. Harmonic Patterns give you high win rate and high opportunities for trade in during one day. This indicator detects the best and successful patterns base on Harmonic Trading books . The Harmonic Patterns Scanner Scans All ch
      Swing Scanner MT5
      Reza Aghajanpour
      5 (6)
      **   All Symbols   x   All Time frames   scan just by pressing scanner button ** *** Contact me  to send you instruction and add you in "Swing scanner group" for sharing or seeing experiences with other users. Swing EA:  https://www.mql5.com/en/market/product/124747 Introduction: Swing Scanner   is the indicator designed to detect swings in the direction of the trend and possible reversal swings. The indicator studies several price and time vectors to track the aggregate trend direction and dete
      RSI Divergence Scanner
      Reza Aghajanpour
      4.46 (13)
      ** All Symbols x All Timeframes scan just by pressing scanner button ** *** Contact me  to send you instruction and add you in "RSI scanner group" for sharing or seeing experiences with other users. Introduction RSI divergence is a main technique used to determine trend reversing when it’s time to sell or buy because prices are likely to drop or pick in the charts. The RSI Divergence indicator can help you locate the top and bottom of the market. This indicator finds Regular divergence for pu
      ** All Symbols x All Time frames scan just by pressing scanner button ** *** Contact me  to send you instruction and add you in "Divergence group" for sharing or seeing experiences with other users. Introduction MACD divergence is a main technique used to determine trend reversing when it’s time to sell or buy because prices are likely to drop or pick in the charts. The MACD Divergence indicator can help you locate the top and bottom of the market. This indicator finds Regular divergence for pul
      RSI Divergences Scanner MT5
      Reza Aghajanpour
      4.73 (11)
      ** All Symbols x All Timeframes scan just by pressing scanner button ** ***Contact me to send you instruction and add you in "RSI scanner group" for sharing or seeing experiences with other users. Introduction RSI divergence is a main technique used to determine trend reversing when it’s time to sell or buy because prices are likely to drop or pick in the charts. The RSI Divergence indicator can help you locate the top and bottom of the market. This indicator finds Regular divergence for pullba
      Introduction RSI divergence is a main technique used to determine trend reversing when it’s time to sell or buy because prices are likely to drop or pick in the charts. The RSI Divergence indicator can help you locate the top and bottom of the market. This indicator finds Regular divergence for pullback the market and also finds hidden RSI Divergence to show continuing trend. This indicator shows divergence on the RSI that is a strong hint for an excellent entry point and finds immediately with
      FREE
      ** All Symbols x All Time frames scan just by pressing scanner button ** *** Contact me  to send you instruction and add you in "Harmonic Scanner group" for sharing or seeing experiences with other users. Introduction Harmonic Patterns are best used to predict turning point. Harmonic Patterns give you high win rate and high opportunities for trade in during one day. This indicator detects the best and successful patterns based on Harmonic Trading concepts . The   Harmonic Patterns   Scanner   Sc
      MACD Divergence Scanner
      Reza Aghajanpour
      5 (2)
      ** All Symbols x All Time frames scan just by pressing scanner button ** *** Contact me  to send you instruction and add you in "Divergence group" for sharing or seeing experiences with other users. Introduction MACD divergence is a main technique used to determine trend reversing when it’s time to sell or buy because prices are likely to drop or pick in the charts. The MACD Divergence indicator can help you locate the top and bottom of the market. This indicator finds Regular divergence for pul
      Channel Scanner MT5
      Reza Aghajanpour
      5 (1)
      **   All Symbols   x   All Timeframes   scan just by pressing scanner button ** *** Contact me  to send you instruction and add you in "Channel Scanner group" for sharing or seeing experiences with other users. Introduction: The Channel pattern is described as the area located between two trend lines. This area is used for a measure of a trading range. In this case, the upper trend line connects price highs while the lower trend line connects price lows. Also when it comes to breakout points, it
      **   All Symbols   x   All Timeframes   scan just by pressing scanner button ** *** Contact me  to send you instruction and add you in "Head & Shoulders Scanner group" for sharing or seeing experiences with other users. Introduction: Head and Shoulders   Pattern  is a very repetitive common type of price reversal patterns.   The pattern appears on all time frames and can be used by all types of traders and investors.   The  Head and Shoulders  Scanner indicator  Scans All charts just by pressing
      Order Block Scanner
      Reza Aghajanpour
      5 (2)
      ** All Symbols x All Time frames scan just by pressing scanner button ** *** Contact me  to send you instruction and add you in "Order Block group" for sharing or seeing experiences with other users. Introduction: The central banks and financial institutions mainly drive the market, Order block is considered a market behavior that indicates accumulation of orders from banks and institutions, then the market tends to make a sharp move(Imbalance) on either side once the order block is completed. O
      Filtro:
      NaraChid
      71
      NaraChid 2024.09.25 17:07 
       

      Excellent tool and prompt support

      Khalid Karim
      395
      Khalid Karim 2024.09.12 07:36 
       

      great product. less but accurate signals. simple and smooth.

      aph.andy
      308
      aph.andy 2024.07.17 07:43 
       

      Very good indicator. If you follow the manual Reza give you, the indicator will be work like charm. Thank you for the support Reza. Really recommended.

      Sjackson
      97
      Sjackson 2024.06.13 00:52 
       

      If you have a strategy that works well with indicator, then this is the only indicator you will need. Exceptional customer service! If the indicator is not operating as expected, he will fix bug and push update without question.

      zjd_77
      32
      zjd_77 2024.05.13 18:02 
       

      El usuario no ha dejado ningún comentario para su valoración

      sami57
      119
      sami57 2024.05.13 14:11 
       

      all indicators work very well

      Giulio Franceschini
      547
      Giulio Franceschini 2024.03.09 09:53 
       

      Hi Reza I'm using 123 Pattern scanners for 1 day in real, out of 14 trades done only 2 at stop loss and two still in progress, it's a fantastic indicator you did an extraordinary job, thank you. It would be even nicer if you could set the scanner for WIN RATIO, thus having the possibility that the scanner sends signals only for example for crosses with a win ratio greater than 70 or 75 - 80 or a selectable percentage of your choice. I don't know if this is feasible but it would become a SUPER indicator!!

      asahi0808
      175
      asahi0808 2024.01.07 22:11 
       

      El usuario no ha dejado ningún comentario para su valoración

      guiguibrl
      42
      guiguibrl 2023.12.16 07:26 
       

      91% win rate in M30 eur/usd and 88% jp225 M5 very accurate win rate (25win for 4 loss)

      Reza Aghajanpour
      86897
      Respuesta del desarrollador Reza Aghajanpour 2023.12.16 08:07
      Thank you for your awesome feedback.🌹⛱️🏖️🥇
      Enjoy your trading.⭐⭐⭐⭐⭐
      Oleg Pozdnyakov
      736
      Oleg Pozdnyakov 2023.10.28 11:16 
       

      Отличная работа и поддержка автора!!!

      Reza Aghajanpour
      86897
      Respuesta del desarrollador Reza Aghajanpour 2023.10.28 14:57
      Thank you for your awesome feedback.🌹⛱️🏖️🥇
      Enjoy your trading.⭐⭐⭐⭐⭐
      Tony Gregg
      761
      Tony Gregg 2023.10.14 17:13 
       

      Probably the best 123 Indicator on MT4 right now.

      Reza Aghajanpour
      86897
      Respuesta del desarrollador Reza Aghajanpour 2023.10.14 17:25
      Thank you for your awesome feedback. It is my pride.😍🌹🌹🙏
      Enjoy your trading. ⭐⭐⭐⭐⭐
      MissyD1202
      283
      MissyD1202 2023.09.22 11:54 
       

      Very good indicator and scanner, makes seeing the price structure much easier. Highly recommended.

      Reza Aghajanpour
      86897
      Respuesta del desarrollador Reza Aghajanpour 2023.09.22 16:19
      Thank you for your warm feedback. It is my pride.😍🌹🌹🙏
      Enjoy your trading. ⭐⭐⭐⭐⭐
      Ck.
      1041
      Ck. 2023.09.01 16:14 
       

      Great work and support by author.

      Reza Aghajanpour
      86897
      Respuesta del desarrollador Reza Aghajanpour 2023.09.01 16:16
      Thank you for your awesome feedback. It is my pride.😍🌹🌹🙏
      Enjoy your trading. ⭐⭐⭐⭐⭐
      quitdayjob247
      144
      quitdayjob247 2023.07.01 20:55 
       

      not worth $39 more like $1, i tested default settings on two charts to verify it's consistency. Some how i set it up wrong message from author. One chart shows all patterns with 15 minutes intervals working fine , 2nd chart on same demo server different account / MT4 with same settings doesn't show all patterns. If i'm wrong by dragging and dropping in chart and using default settings i accept my $39 loss.

      *1.33* Version going to test it this coming Week 08/06 on my live account.

      *1.38* IS a Winner, combined with MA + Fib levels for confirmation.

      Ich Khiem Nguyen
      232
      Ich Khiem Nguyen 2023.05.28 18:43 
       

      Works very well. Method Pattern mode should be used for trend trading with a high R:R ratio. However, to increase the win rate, I think the Breakout method is reasonable. The indicator saves a lot of time

      Reza Aghajanpour
      86897
      Respuesta del desarrollador Reza Aghajanpour 2023.05.28 20:57
      Thank you for your awesome feedback. It is my pride.😍🌹🌹🙏
      Enjoy your trading. ⭐⭐⭐⭐⭐
      Alireza Saeedi
      234
      Alireza Saeedi 2023.05.18 18:34 
       

      El usuario no ha dejado ningún comentario para su valoración

      Reza Aghajanpour
      86897
      Respuesta del desarrollador Reza Aghajanpour 2023.05.18 21:40
      Thank you for your awesome feedback. It is my pride.😍🌹🌹🙏
      Enjoy your trading. ⭐⭐⭐⭐⭐
      Devonish
      3048
      Devonish 2023.04.08 16:36 
       

      I like it. I also agree with JACK_LE_CHAT's comments.

      Reza Aghajanpour
      86897
      Respuesta del desarrollador Reza Aghajanpour 2023.04.08 17:29
      Thank you for your positive feedback. It is my pride.😍🌹🌹🙏
      Enjoy your trading. ⭐⭐⭐⭐⭐
      Chiedozie
      140
      Chiedozie 2023.04.02 18:29 
       

      El usuario no ha dejado ningún comentario para su valoración

      Reza Aghajanpour
      86897
      Respuesta del desarrollador Reza Aghajanpour 2023.04.02 19:07
      Thank you for your awesome feedback. It is my pride.😍🌹🌹🙏
      Enjoy your trading. ⭐⭐⭐⭐⭐
      Dmitrii Castravet
      469
      Dmitrii Castravet 2023.03.20 17:39 
       

      It says no repaint. But clear it does repaint.

      JACK_LE_CHAT
      360
      JACK_LE_CHAT 2023.03.17 01:20 
       

      I added this indicator to my trading tool kit a couple of weeks ago. Further to extensive testing with various instruments under various market conditions, I can assess that it provides very accurate signals based on the exact calculation of 123-patterns on any time frame. I shall however add a warning to the present review. Even though this indicator may make trading look pretty much easy at first glance, beginners must be very careful since its apparent simplicity is not a free ticket to ride: one should always have the signals confirmed by means of sound peripheral analysis of the market context, and only jump into trades when the 123-patterns displayed are thoroughly examined within the framework of a sturdy strategy taking confluences into account. If such a methodology is carefully implemented, this indicator is a highway to profits! On top of this, its author, M. Reza, is very supportive and always ready to help and advise. Bravo, and keep up with the great work ! MF

      Reza Aghajanpour
      86897
      Respuesta del desarrollador Reza Aghajanpour 2023.03.17 06:22
      Thank you for your awesome feedback. It is my pride.😍🌹🌹🙏
      Enjoy your trading. ⭐⭐⭐⭐⭐
      Respuesta al comentario
      Versión 1.39 2024.08.20
      - Fixed Object name issue
      Versión 1.38 2024.06.05
      - Fixed sending email notification
      Versión 1.37 2024.06.03
      - Alert Display in input setting
      Versión 1.36 2024.04.22
      - Added symbol for scan in input setting

      - Solved issue in Strategy Tester & buffer

      - Improved print messages
      Versión 1.35 2024.03.06
      - Added Font size for dashboard
      Versión 1.34 2023.08.18
      - Added "Ichimoku Filtering" in input setting. (it is disabled by default )
      Versión 1.33 2023.08.05
      - Improved Strategy Tester
      Versión 1.32 2023.02.05
      - Added new option : Select Time Frames for scan in input setting
      Versión 1.31 2023.02.01
      - Added email notification
      Versión 1.30 2023.01.06
      - Fixed M1 timeframe button bug
      Versión 1.29 2022.09.15
      - Edit Push signals to file
      Versión 1.28 2022.09.15
      - Edit push signals to file
      Versión 1.27 2022.09.15
      - Push signals to file
      Versión 1.26 2022.09.13
      - Improved Printing
      Versión 1.25 2022.09.02
      - Improved Printing - Part2
      Versión 1.24 2022.09.02
      - Improved Printing
      Versión 1.23 2022.09.01
      - Fixed dashboard bug
      Versión 1.22 2022.09.01
      - Added Statistics Dashboard
      Versión 1.21 2022.07.18
      - Solved a bug
      Versión 1.20 2022.06.26
      - Remove just 123 indicator objects in changing TF and Keep other objects from other indicators.
      Versión 1.19 2022.05.31
      - Fixed a bug
      Versión 1.18 2022.05.29
      - Fixed a bug
      Versión 1.17 2022.05.14
      - Fixed a buffer bug
      Versión 1.16 2022.04.24
      - Add "H" button for hiding all buttons
      Versión 1.15 2022.04.20
      - Add SL & TP & Entry point levels in alert message
      Versión 1.14 2022.04.14
      - Improved buffers and Added signal buffer(Buy=1 / Sell=0) for creating EA
      - Fixed a bug
      Versión 1.13 2022.04.04
      - Fixed a bug,
      Please download new version
      Versión 1.12 2022.04.04
      - Imroved scan
      Versión 1.11 2022.03.29
      - Fixed a small bug
      Versión 1.10 2022.03.28
      - Updated chart view option(white,Black,Don't change)
      Versión 1.9 2022.03.28
      - changed "chart view" option in input part
      Versión 1.8 2022.03.24
      - Add "H" button : Hidden all buttons on chart
      Versión 1.7 2022.03.21
      - Add "Chart View black" in input section: change color chart to black(Default MT4)
      - changed "scan the number of candles in open chart" to 500
      Versión 1.6 2022.03.09
      - Add pattern name in alarm and notification based on users ask
      Versión 1.5 2022.03.08
      - Add method to choose when appearing and alarm : breakout(after breakout in point 2) or pattern(in point 3)
      Versión 1.4 2022.02.28
      - Scan just open chart when disable "scan all charts" button
      - Add buffer for someone who wants to use this indicator as an iCustom()
      Versión 1.3 2022.02.22
      - Scan only your Market watch,
      Please download new version.
      Versión 1.2 2022.02.08
      Improved Print
      Versión 1.1 2022.02.08
      - Add "Market watch" or "just currency pairs" button for scan