• Información general
  • Comentarios
  • Discusión (7)
  • Novedades

Outside The Box

The Outside The Box (OTB) is a complete trading system that provides the user with immense trading ability by highlighting on the chart areas where the trader should prepare to

  • Re-enter the trend after pullbacks (Pullback trading strategy)
  • Take partial/complete profit(Profit taking strategy), and
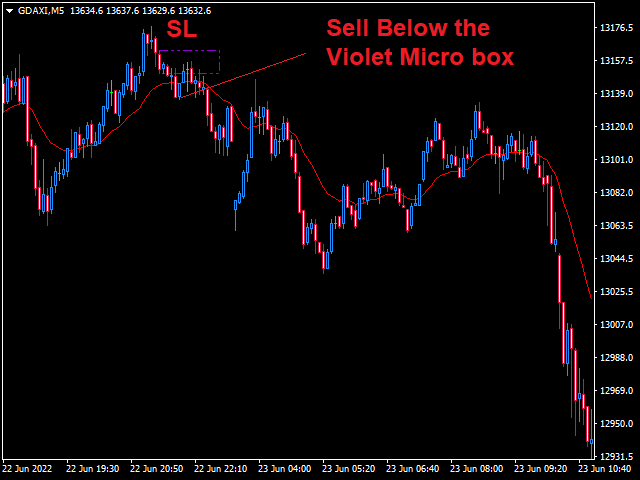
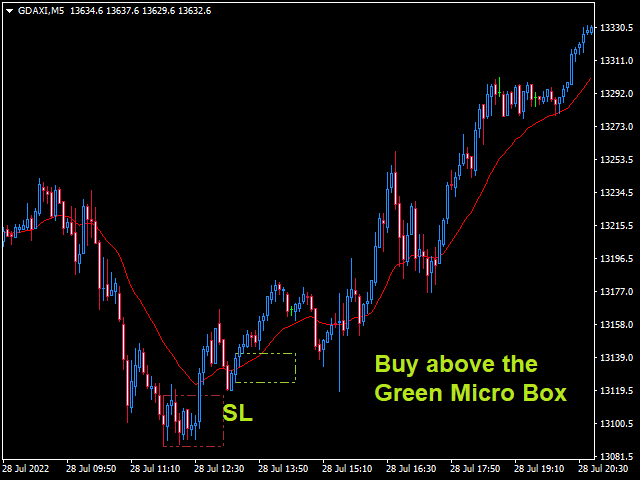
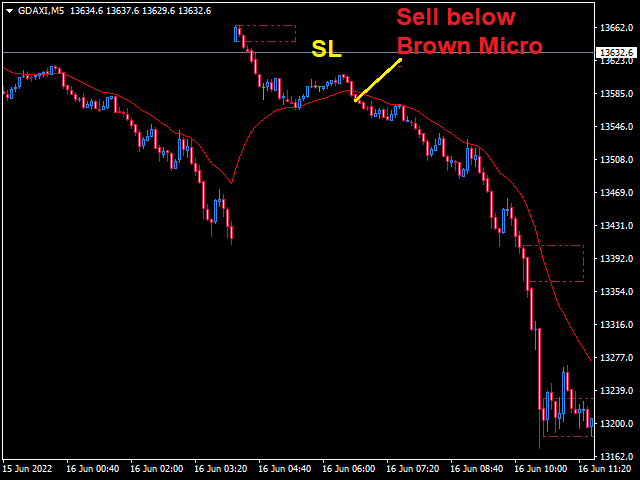
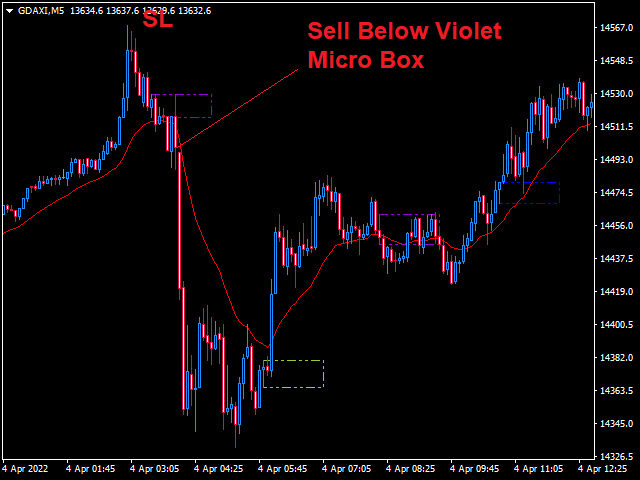
  • Trade breakouts (Stock breakout strategy)- We have updated the indicator to show/hide Micro breakout areas around the major breakouts (Micro Breakouts). 
The above is supported by an alert system to notify you when a signal is generated.

Download MT4 Version


Irrespective of whether you are trading,Synthetic Indices,Forex,Cryptocurrencies, or Stocks the Outside The Box System works wonders.

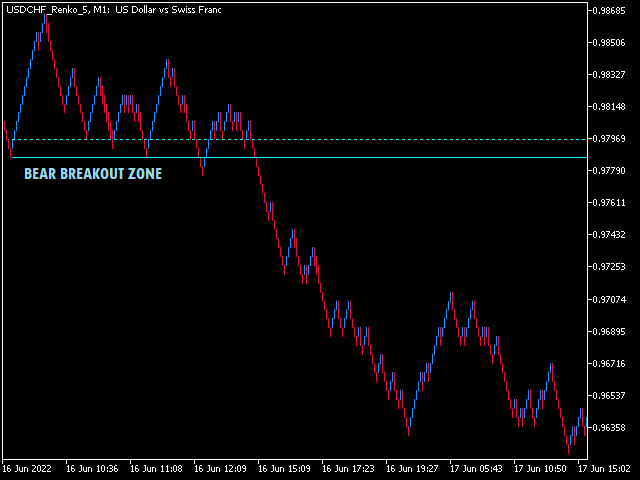
How do I know there is a trend breakout- Breakout Zone and Micro Breakouts

This is the zone between the continuous and dotted lines. The market is expected to breakout on the side of the solid continuous line. After the Breakout Zone draws, you should plan to open trades in the direction after the Re-Entry Zone is displayed. You are recommended to avoid opening buys when the price trends below the bearish breakout. Similarly, don’t go short when the bullish breakout is activated. Another vital point, expect the zones to act as support/resistance.

When you enable Micro Breakouts, you will be able to see areas where the price actually breaks or fails to completely breakout. With this feature enabled you can use it to buy or sell based on micro breakouts. Pls check FAQ number 10 on several ways to profit from this feature. 

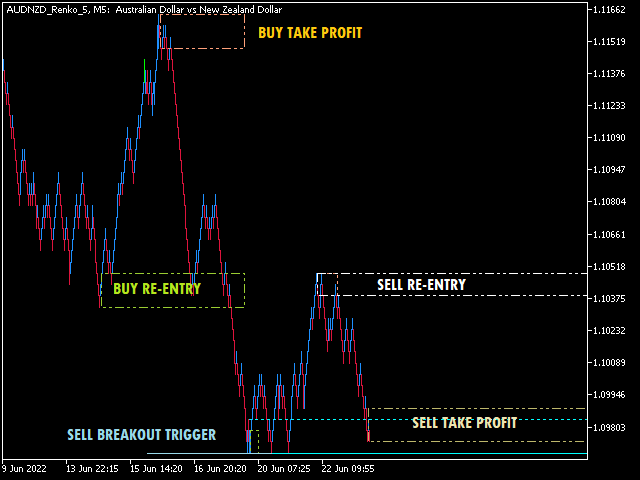
When do I re-enter the trend. Re-entry Zone

The Re-entry Zone is always below the Breakout Zone during a bear market. However, it can appear above the Breakout Zone if the market is consolidating. On the same note, the bull market Re-entry Zone is always above the Breakout Zone, though this may be overlooked in the early stages of the trend formation. Buy if a candle opens above the buy re-entry zone if bulls are in control and wait for a candle to open below the sell re-entry zone for you to sell during a bear market.

How do I take profit-Take Profit Zones

This module, Take Profit Zones, is useful in that irrespective of the indicator you are using it shows areas where you must lock or take some profit. These zones are displayed when there is either bull or bear market. This is helpful in that you are able to lock most of the gains before a retracement or reversal. On a downtrend, you can re-enter the market, with smaller lots, after a candle opens and closes below the Take Profit Zones. Equally, go long after a candle opens and closes above the zone if you are on an uptrend.

This system has been tested on ordinary and Renko charts. However, use the system together with Renko charts to experience the best outcome and display of these critical zones.

Always know the market level by using Outside The Box trading system.

Please check the updated Q/A from other clients: https://www.mql5.com/en/blogs/post/749809

More indicators from us here: https://www.mql5.com/en/users/pipmontra/seller

Productos recomendados
XCalper HiLo Activator
Aecio de Feo Flora Neto
HiLo Activator v1.02 by xCalper The HiLo Activator is similar to moving average of previous highs and lows. It is a trend-following indicator used to display market’s direction of movement. The indicator is responsible for entry signals and also helps determine stop-loss levels. The HiLo Activator was first introduced by Robert Krausz in the Feb. 1998 issue of Stocks & Commodities Magazine.
Multiple Timeframe MACD indicator. This indicator was built for making multiple timeframe analysis possible in MT5 using MACD Indicator. MACD Indicator traditionally shows two lines and one histogram. MACD Line(Yellow) is calculated by subtracting 12period EMA(fast) from 26period EMA (slow). Signal Line(Blue) is created by a 9period EMA from MACD Line. Histogram is just the difference between MACD and Signal lines. Histogram is colored based on the difference between its value and the previous h
Based on the Dow Theory, the system automatically draws a turning point, which is the starting point for buying or selling. It also automatically tells you whether the market is in a buying or selling condition and recognizes the environment. It is also a good tool to prevent false trades and to make profitable trades. We are live-streaming the actual operation of the system. Please check for yourself if it is usable. Please check it out for yourself. https://www.youtube.com/@ganesha_forex
VI Vortex
Fernando Lahude Ritter
4.5 (2)
Description : Enhance Your Trading Strategy with the Advanced Vortex Indicator for MT5! Discover the power of the Vortex Indicator (VI), a robust technical analysis tool now available for MetaTrader 5. This custom-built indicator is designed to help traders identify trends and reversals, offering a critical edge in the dynamic Forex market. Key Features: Dynamic Trend Identification : With the VI's unique calculations of VI+ (positive) and VI- (negative) lines, you can easily spot trend strength
FREE
Watermark Centralized
Ronnie Ferreira Silva
1 (1)
Marca de agua centralizada Agrega una marca de agua centrada con el nombre del activo y el período elegido. Es posible anular el tipo de fuente, el tamaño de fuente, el color de fuente y el carácter separador. La marca de agua se coloca detrás de las velas, sin perturbar la visualización. Tiene centrado automático si se cambia el tamaño de la ventana. Espero que este indicador te ayude, buen trading ;)
FREE
This indicator builds upon the previously posted Nadaraya-Watson smoothers. Here we have created an envelope indicator based on Kernel Smoothing with integrated alerts from crosses between the price and envelope extremities. Unlike the Nadaraya-Watson estimator, this indicator follows a contrarian methodology. Please note that by default this indicator can be subject to repainting. Users can use a non-repainting smoothing method available from the settings. The triangle labels are designed
El indicador rastrea la tendencia en 5 tiempos de gráfico diferentes para el mismo activo, en base a 6 señales para cada tiempo de gráfico. El objetivo principal del indicador es mostrarnos la tendencia mayoritaria del activo financiero en el que se colocó. El sistema transmite la información de las tendencias en varios tiempos gráficos, de esta forma el usuario puede tener una visión amplia del movimiento del activo, este tipo de herramienta hace que el usuario tenga una mayor tasa de acier
Este es el famoso indicador de Bandas Bollinger de Gekko. Este indicador utiliza el ya conocido indicador de Bandas de Bollinger y agrega funcionalidades que permiten encontrar señales de entrada y de salida con la acción del precio sobre las bandas. Ejemplo: pullback, pullback contra la tendencia, cruce de precios con la banda del medio, etc. Entradas Number of Bars to Plot Indicator  - el número de barras históricas que el indicador usará para producir señales; ProduceSignalOnlyWhenBarCloses  
Marca Dagua
Erison Francisco De Sales
3 (1)
Adiciona marca d'água com nome do ativo em negociação. Pode ser ajustado definindo tamanho da fonte e coloração do texto. Testado com vários ativos do mercado B3 e Forex  Adione ao gráfico e configure de acordo com a necessidade. Caso tenha problemas sinta-se a-vontade para nos avisar e providenciaremos a correção logo que possível. ______________________________
FREE
Simple Candle Countdown
Emanuel Cavalcante Amorim Filho
Simple candle countdown - never again miss how much time is left to open a new bar! This indicator doesn't plot any line on the chart - it uses only objects and calculates the time left to open a new bar. You can set custom colors for the panel background and border and for the text color. Simple as that, the indicator is ready to use. If you find any bugs, feel free to contact me. 
FREE
Timeframe Separator
Alexandre Borela
5 (1)
If you like this project, leave a 5 star review. Often times we are using brokers that are outside of the GMT-0 timezone, this not only complicates things, but, it can make seeing when a trading session starts a bit more difficult than it should. This indicator allows you to set a timezone offset it will draw a vertical line for the: Day. Week. Month. Quarter. year.
FREE
Setup Double 7s
Luigi Nunes Labigalini
Entry and exit signals from the Double 7's Strategy by Larry Connors in his book "Short Term Trading Strategies That Work". Larry claims this strategy predicted the market's direction over 80% of the time since 1995. Picking up the gains and being exposed in the market less than 25% of the time. Good for swing trading on Daily charts of SPY, Nasdaq, China's FXI, Brazil's EWZ and the majority of the equity ETFs and World Indices. How does it work? The indicator activates the buy signal when
HiLo Activator Plus
Rodrigo Galeote
5 (1)
HiLo Activator es uno de los indicadores más utilizados para determinar tendencia. Encuéntrelo aquí esta versión personalizada de Gekko con la capacidad de personalizar el período y los colores. Este indicador también traza flechas hacia arriba y hacia abajo cuando hay un cambio en la tendencia, lo que indica puntos de entrada y salida muy fuertes HiLo se adapta bien a diferentes tipos de períodos para la negociación intradiaro. Puedes entender fácilmente cuándo es el momento de comprar o vender
El indicador Martinware Manual Trading Helper tiene como objetivo ayudar a las personas a comenzar sus vidas en el comercio manual. Se puede usar para mostrar algunas imágenes genéricas en el lado derecho del gráfico, donde se pueden mostrar observaciones operativas personalizadas o simplemente un rectángulo en blanco que oculta el gráfico mientras se realiza la prueba inversa. Además, puede reproducir periódicamente una lista de sonidos. Para mostrar un rectángulo en blanco, simplemente dej
FREE
Volume Profile Indicator used by professional Traders at Traders Inside Ltd. If you want to succeed in trading you need to know if current price is cheap, expensive or fair valued. Key features: Fair price (Point of control, POC), high and low price zones (POH, POL) POC in different timeframes for better orientation Symbol and timeframe Chart resize on open positions/orders, VPRmax/min Historic POC - see, how POC has changed the last periods Button to show/hide VPR Calculated Bars (best results
Noize Absorption Index - is the manual trading system that measures the difference of pressure between bears forces and bulls forces. Green line - is a noize free index that showing curent situation. Zero value of index shows totally choppy/flat market.Values above zero level shows how powerfull bullish wave is and values below zero measures bearish forces.Up arrow appears on bearish market when it's ready to reverse, dn arrow appears on weak bullish market, as a result of reverse expectation.
HV Models
Andrey Azatskiy
HV Models is an Indicator that containes 4 methods for calculating historical volatility of the selected asset. Volatility is one of the fundamental values ​​describing changes in the underlying asset. In statistics, it usualy describes as a standard deviation. The price chart has 4 values ​​(Open High Low Close) when we calculate volatility using a standard indicator, only one of these values ​​is used as a result we get one-sided volatility picture. The presented indicator uses 4 volatility ca
A lot of professional traders use high quality divergence signals as a part of their strategy to enter a position. Spotting correct divergences quickly can often be hard, especially if your eye isn’t trained for it yet. For this reason we’ve created a series of easy to use professional oscillator divergence indicators that are very customisable so you get only the signals you want to trade. We have this divergence indicator for RSI, MACD, Stochastics, CCI and OBV. RSI:   https://www.mql5.com/en/
DG TrendSigns
David Gadelha
3 (1)
Purpose DG Trend+Signs is an indicator that paints candles with trend colors and clearly shows consolidations, using both DoGMA Trend and DoGMA Channel indicators. It was created to help users in their trades, showing trends, consolidations and marking entry and exit points. The indicator also takes consolidations in consideration to identify breakouts. Key features Designed to be simple to use, with a few parameters Does NOT repaint Does NOT recalculate Signals on entries Works in ALL pairs W
Cybertrade Auto Fibonacci retraction and projection  - MT5 Auto Fibonacci is an indicator that automatically plots the Fibonacci retracement and projection based on the number of bars you select in the indicator setting. You can customize nine different levels of retraction and three levels of projection. It works on periods longer than the period visible on the chart. All values ​​are available in the form of buffers to simplify possible automations. This indicator is the same one we use in o
FREE
Please,put CycleDivergence in the same folder of TimingCycleWithLLV otherwise it does not run. As for the cycle discussion, I invite you to read the TimingCycleWithLLV indicator presentation ...please ask me if something is not clear. I think tha time is much more important than price;this is the reason for wich I trade only when one cycle finishes and the new one start. In order to use the CycleDivergence indicator follow these steps: 1) for example (see imagine number four) 1 minute chart,in t
Trend Direction ADX indicator Trend Direction ADX is part of a serie of indicators used to characterize market conditions. Almost any strategy only work under certain market conditions. Therefore it is important to be able to characterize market conditions at any time: trend direction, trend strength, volatility, etc.. Trend Direction ADX is an indicator to be used to characterize trend direction: trending up trending down ranging Trend Direction ADX is based on ADX standard indicator.
Exclusive FOREX account HEDGE FuzzyLogicTrendEA is based on fuzzy logic strategy based on  analysis 5 indicators and filters. When the EA analysis all this indicators, it decides, based on its fuzzy strategy, which trade will be better: sell or buy. As additional functions, it´s possible defines spread maximum, stop loss and others. Recomm. Symbol: EURUSD, AUDUSD, GBPUSD, NZDUSD, USDCAD, AUDCAD, EURCAD e USDJPY Recomm. timeframe: H1. Backtest were done on EURUSD, H1, 01/07/2023 - 26/0
XCalper CandleTimer
Aecio de Feo Flora Neto
4.62 (13)
This auxiliary indicator displays time left before closing on the current timeframe with continuous update . It also shows the last trade price and variation from a previous day close in percentage and points. This indicator is pretty handy for daytraders and scalpers who want to precisely monitor closing and opening of candles. Indicator parameters Show in shifted end - Default: False. Display time and values on screen. If True, Displays only time to close aside last candle. Distance from the
FREE
FuTuRe 01 Phi Cubic Fractals Pack1
Claudio De Carvalho Aguiar
5 (1)
This product contains following indicators: (Lines + LineSAR + Channels + BTL + Ladder) Phi Lines  - special EMAs, similar to MIMAs from Phicube; Phi LineSAR  - erase and highlight Phi Lines in support or resistance. Similart to MIMASAR from Phicube; Phi Channels  - show support and resistance, similar to Phibo from Phicube (Green and Read Lines); Phi BTL  - candles color following Phi Lines alignment; Phi LADDER  - Indicator that allow you to visualize possible targets.  FUTURO Tool Future to
Atomic Analyst MT5
Issam Kassas
4.5 (16)
En primer lugar, vale la pena enfatizar que este Indicador de Trading no repinta, no redibuja y no se retrasa, lo que lo hace ideal tanto para el trading manual como para el automatizado. Manual del usuario: configuraciones, entradas y estrategia. El Analista Atómico es un Indicador de Acción del Precio PA que utiliza la fuerza y el impulso del precio para encontrar una mejor ventaja en el mercado. Equipado con filtros avanzados que ayudan a eliminar ruidos y señales falsas, y aumentan el poten
Fibonacci Master Pro
Claudio Aguiar De Aragao
Fibonacci Master Pro es un indicador de proyección de Fibonacci avanzado diseñado para optimizar sus estrategias comerciales. Este indicador incorpora los principios del análisis técnico de Fibonacci, proporcionando proyecciones precisas y oportunidades de entrada y salida del mercado. Fibonacci Master Pro   muestra proyecciones ascendentes y descendentes de Fibonacci basadas en el máximo y el mínimo de una vela que especifique   . Principales características: 1. **Proyecciones precisas:
MarketMagnet
Kelly Adediran Raymond
Are you ready to take your trading journey to new heights? Look no further than MarketMagnet, this groundbreaking indicator designed to propel your trading success with excitement and accuracy. Powered by the convergence of Momentum and CCI (Commodity Channel Index), MarketMagnet equips traders with the ultimate tool to determine direction and entry prices for a wide range of recommended currency pairs and instruments. It is designed for traders seeking to scalp for a few pips on lower timeframe
This indicator uses a mathematical calculation algorithm . This algorithm calculates the remainder between the updated model and the actual values and produces the possible progress of the graph on the graph. It is not a super prophet in trading, but it is very good for the trader when entering the market and to analyze it before entering. Applicable for all currencies. Данный индикатор использует алгоритм математических вычислений . Данный алгоритм вычисляет остаток между обновленной моделью и
VIP Buy Sell Signals
Hapu Arachchilage Tharindu Lakmal
Here is a Live DEMO testing account for the indicator. ( Profit proofs ) Login (MT5) - 100246 Server - FusionMarkets-Demo Investor PW - VIPindicator@2024 Contact me through this email aaddress to download the FREE strategy PDF for this indicator tharindu999lakmal@gmail.com Introduction   The   "Buy Sell Signals"   is designed to provide BUY and SELL trade signals based on the current market conditions.   A   Profitable   Trading Strategy   (Chee sheet)   is provided for this trading indicato
Los compradores de este producto también adquieren
Primero que todo, vale la pena enfatizar que este Sistema de Trading es un Indicador No Repintado, No Redibujado y No Retrasado, lo que lo hace ideal tanto para el trading manual como para el automatizado. Curso en línea, manual y descarga de ajustes preestablecidos. El "Sistema de Trading Inteligente MT5" es una solución completa de trading diseñada para traders nuevos y experimentados. Combina más de 10 indicadores premium y presenta más de 7 estrategias de trading robustas, lo que lo convie
TPSpro RFI Levels MT5
Roman Podpora
4.63 (8)
反转第一脉冲水平 (RFI)     指示     俄羅斯     -        ESP   Recomendamos utilizar con   el indicador -   TPSpro 趋势专业版 -   MT5版本 Un elemento clave importante en el comercio son las zonas o niveles a partir de los cuales se toman decisiones para comprar o vender un instrumento comercial. A pesar de los intentos de los grandes actores de ocultar su presencia en el mercado, inevitablemente dejan rastros. Nuestra tarea era aprender a encontrar estos rastros e interpretarlos correctamente. Funciones principales:
TPSproTREND PrO MT5
Roman Podpora
4.89 (9)
TPSpro TREND PRO  - is a trend indicator that automatically analyzes the market and provides information about the trend and each of its changes, as well as giving signals for entering trades without redrawing! The indicator uses each candle, analyzing them separately. referring to different impulses - up or down impulse. Exact entry points into transactions for currencies, crypto, metals, stocks, indices!  Version MT4               DETAILED DESCRIPTION               R ecommended to use with an
Quantum Trend Sniper
Bogdan Ion Puscasu
4.91 (44)
Introduciendo       Indicador Quantum Trend Sniper   , el innovador indicador MQL5 que está transformando la forma en que identificas y negocias los cambios de tendencia. Desarrollado por un equipo de comerciantes experimentados con experiencia comercial de más de 13 años,       Indicador de francotirador de tendencia cuántica       está diseñado para impulsar su viaje comercial a nuevas alturas con su forma innovadora de identificar cambios de tendencia con una precisión extremadamente alta.
Este es un genial indicador para MT5 que ofrece señales precisas para entrar en una transacción sin redibujar. Se puede aplicar a cualquier activo financiero: fórex, criptomonedas, metales, acciones, índices. Nos dará valoraciones bastante precisas y nos dirá cuándo es mejor abrir y cerra una transacción. Eche un vistazo  al vídeo  (6:22), ¡contiene un ejemplo de procesamiento de una sola señal que ha amortizado el indicador! La mayoría de los tráders mejoran sus resultados comerciales durante l
FX Power MT5 NG
Daniel Stein
5 (4)
Obtenga su actualización diaria del mercado con detalles y capturas de pantalla a través de nuestro Morning Briefing aquí en mql5 y en Telegram ! FX Power MT5 NG es la nueva generación de nuestro popular medidor de fuerza de divisas, FX Power. ¿Y qué ofrece este medidor de fuerza de nueva generación? Todo lo que le encantaba del FX Power original PLUS Análisis de fuerza de ORO/XAU Resultados de cálculo aún más precisos Períodos de análisis configurables individualmente Límite de cálculo persona
Golden Spikes Premium
Kwaku Bondzie Ghartey
Golden Spikes Detector Acknowledgement and Dedications:  The name of this indicator was Inspired by an Original; Mr Grant Koopman; a Knowledgeable and experienced Synthetics trader. I dedicate this indicator to Mr Grant.  Overview: The Golden Spikes Premium is a groundbreaking trading indicator meticulously crafted for the Boom and Crash indices on the Deriv market. Tailored to meet the needs of discerning traders, this powerful tool operates exclusively on the one-minute timeframe, providin
FX Volume MT5
Daniel Stein
5 (12)
Obtenga su actualización diaria del mercado con detalles y capturas de pantalla a través de nuestro Morning Briefing aquí en mql5 y en Telegram ! FX Volume es el PRIMER y ÚNICO indicador de volumen que proporciona una visión REAL del sentimiento del mercado desde el punto de vista de un bróker. Proporciona una visión impresionante de cómo los participantes institucionales del mercado, como los brokers, están posicionados en el mercado Forex, mucho más rápido que los informes COT. Ver esta info
Ahora $ 147 (aumentando a $ 499 después de algunas actualizaciones) - Cuentas ilimitadas (PC o Mac) Manual de usuario de RelicusRoad + Videos de capacitación + Acceso al grupo privado de Discord + Estado VIP UNA NUEVA MANERA DE VER EL MERCADO RelicusRoad es el indicador comercial más poderoso del mundo para divisas, futuros, criptomonedas, acciones e índices, y brinda a los comerciantes toda la información y las herramientas que necesitan para mantenerse rentables. Brindamos análisis téc
Trend Hunter MT5
Andrey Tatarinov
5 (1)
Trend Hunter es un indicador de tendencias para trabajar en los mercados Forex, criptomonedas y CFD. Una característica especial del indicador es que sigue con confianza la tendencia, sin cambiar la señal cuando el precio perfora ligeramente la línea de tendencia. El indicador no se vuelve a dibujar; aparece una señal para ingresar al mercado después del cierre de la barra. Al avanzar a lo largo de una tendencia, el indicador muestra puntos de entrada adicionales en la dirección de la tendenc
¿Está buscando un potente indicador de compraventa de divisas que pueda ayudarlo a identificar oportunidades comerciales rentables con facilidad? No busque más allá de Beast Super Signal. Este indicador basado en tendencias fácil de usar monitorea continuamente las condiciones del mercado, buscando nuevas tendencias en desarrollo o saltando sobre las existentes. Beast Super Signal da una señal de compra o venta cuando todas las estrategias internas se alinean y están en 100% de confluencia entre
Advanced Supply Demand MT5
Bernhard Schweigert
4.46 (13)
¡Actualmente con 33% de descuento! ¡La mejor solución para cualquier tráder principiante o experto! Este indicador es una herramienta comercial única, de alta calidad y asequible, porque incorpora una serie de características patentadas y una nueva fórmula. Con esta actualización, podrá mostrar zonas de doble marco temporal. No solo podrá mostrar un marco temporal más alto, sino también mostrar ambos, el marco temporal del gráfico MÁS el marco temporal más alto: MOSTRANDO ZONAS ANIDADAS. A todos
Este tablero muestra los últimos   patrones armónicos   disponibles para los símbolos seleccionados, por lo que ahorrará tiempo y será más eficiente /   versión MT4 . Indicador gratuito:   Basic Harmonic Pattern Columnas del indicador Symbol:   aparecerán los símbolos seleccionados Trend :   alcista o bajista Pattern :   tipo de patrón (gartley, mariposa, murciélago, cangrejo, tiburón, cifrado o ABCD) Entry :   precio de entrada SL:   precio de stop loss TP1:   1er precio de toma de benefici
Gartley Hunter Multi
Siarhei Vashchylka
5 (8)
Gartley Hunter Multi - An indicator for searching for harmonic patterns simultaneously on dozens of trading instruments and on all possible timeframes. Manual (Be sure to read before purchasing) | Version for MT4 Advantages 1. Patterns: Gartley, Butterfly, Shark, Crab. Bat, Alternate Bat, Deep Crab, Cypher 2. Simultaneous search for patterns on dozens of trading instruments and on all possible timeframes 3. Search for patterns of all possible sizes. From the smallest to the largest 4. A
XQ Indicator MetaTrader 5
Marzena Maria Szmit
2 (1)
Step into the realm of Forex trading with confidence and precision using XQ, a cutting-edge Forex indicator designed to elevate your trading game to unprecedented heights. Whether you're a seasoned trader or just stepping into the world of currency exchange, XQ Forex Indicator empowers you with the insights and signals needed to make informed trading decisions. The signal conditions are a combination of three indicators, and XQ Forex Indicator only display  medium and long-term trends . The ind
Native Channels
BeeXXI Corporation
5 (1)
This indicator recognizes all support and resistance levels. A number of unique high-performance techniques have been applied, which made the existence of this indicator possible. All formed channels are naturally visible: horizontal linear linear parabolic cubic (Polynomial 3 degrees - Wave) This is due to a bundle of approximating channels. The formed channels form "standing waves" in a hierarchical sequence. Thus, all support and resistance levels are visible. All parameter management is
Blahtech Supply Demand MT5
Blahtech Limited
4.54 (13)
Was: $299  Now: $99   Supply Demand uses previous price action to identify potential imbalances between buyers and sellers. The key is to identify the better odds zones, not just the untouched ones. Blahtech Supply Demand indicator delivers functionality previously unavailable on any trading platform. This 4-in-1 indicator not only highlights the higher probability zones using a multi-criteria strength engine, but also combines it with multi-timeframe trend analysis, previously confirmed swings
Was: $249  Now: $99   Market Profile defines a number of day types that can help the trader to determine market behaviour. A key feature is the Value Area, representing the range of price action where 70% of trading took place. Understanding the Value Area can give traders valuable insight into market direction and establish the higher odds trade. It is an excellent addition to any system you may be using. Inspired by Jim Dalton’s book “Mind Over Markets”, this indicator is designed to suit the
Owl Smart Levels MT5
Sergey Ermolov
3.7 (20)
Versión MT4  |  FAQ El Indicador Owl Smart Levels es un sistema comercial completo dentro de un indicador que incluye herramientas de análisis de mercado tan populares como los fractales avanzados de Bill Williams , Valable ZigZag que construye la estructura de onda correcta del mercado y los niveles de Fibonacci que marcan los niveles exactos de entrada. en el mercado y lugares para tomar ganancias. Descripción detallada de la estrategia Instrucciones para trabajar con el indicador Asesor de c
Gold Pointer es el mejor indicador de tendencia. El algoritmo único del indicador analiza el movimiento del precio del activo, teniendo en cuenta los factores del análisis técnico y matemático, determina los puntos de entrada más rentables y da una señal para abrir una orden de COMPRA o VENTA. Las mejores señales del indicador: - Para VENTA = línea de tendencia roja + indicador TF rojo + flecha de señal amarilla en la misma dirección. - Para COMPRA = línea de tendencia azul + indicador TF a
Introduciendo       Quantum Breakout PRO   , el innovador indicador MQL5 que está transformando la forma en que comercia con Breakout Zones. Desarrollado por un equipo de comerciantes experimentados con experiencia comercial de más de 13 años,       Desglose cuántico PRO       está diseñado para impulsar su viaje comercial a nuevas alturas con su innovadora y dinámica estrategia de zona de ruptura. El indicador de ruptura cuántica le dará flechas de señal en las zonas de ruptura con 5 zonas
Bill Williams Advanced
Siarhei Vashchylka
5 (8)
Bill Williams Advanced is designed for automatic chart analysis using Bill Williams' "Profitunity" system. The indicator analyzes four timeframes at once. Manual (Be sure to read before purchasing) Advantages 1. Automatically analyzes the chart using the "Profitunity" system of Bill Williams. The found signals are placed in a table in the corner of the screen. 2. Equipped with a trend filter based on the Alligator indicator. Most of the system signals are recommended to be used only accordi
The Volumebyprice.com Indicator for MetaTrader 5 features Volume Profile and Market Profile TPO (Time Price Opportunity). Volume and TPO histogram bar and line charts. Volume Footprint charts. TPO letter and block marker collapsed and split structure charts. Static, dynamic and flexible range segmentation and compositing methods with relative and absolute visualizations. Session hours filtering and segment concatenation with Market Watch and custom user specifications. Graphical layering, posit
Trend Master Pro MT5
Tatiana Zyrianova
4.5 (2)
MT5 trend indicator with a probability of reaching a profit of 70-90%! Works without redrawing and delays. Trend Master PRO shows good results on all trading instruments: currencies, metals, indices, stocks, cryptocurrencies. Recommended timeframe: H1-H4. More information about the indicator is here :  https://www.mql5.com/en/blogs/post/744748 Recommendations for use Use automatic period detection           The main feature of the indicator is the self-optimization function.             Th
Este es posiblemente el indicador de reconocimiento automático de formación de precios más completo que puede encontrar para la plataforma MetaTrader. Detecta 19 patrones diferentes, toma las proyecciones de Fibonacci tan en serio como usted, muestra la zona de reversión potencial (PRZ) y encuentra niveles adecuados de stop-loss y take-profit. [ Guía de instalación | Guía de actualización | Solución de problemas | FAQ | Todos los productos ] Detecta 19 formaciones de precios armónicos difer
Trend Forecaster
Alexey Minkov
5 (6)
The Trend Forecaster indicator utilizes a unique proprietary algorithm to determine entry points for a breakout trading strategy. The indicator identifies price clusters, analyzes price movement near levels, and provides a signal when the price breaks through a level. The Trend Forecaster indicator is suitable for all financial assets, including currencies (Forex), metals, stocks, indices, and cryptocurrencies. You can also adjust the indicator to work on any time frames, although it is recommen
Trade Assistant MetaTrader System  — a multi-timeframe system that is based on three standard indicators:   Stochastic oscillator ,   RSI   (Relative Strength Index), and   CCI   (Commodity Channel Index). It displays current trend directions for M1, M5, M15, M30, H1, H4, D1, W1, and MN1 timeframes. When you follow such an indicator you have a clear picture of the trends across all important timeframes. It doesn't matter which timeframe you attach this indicator to. Input parameters CheckCandl
AT Forex Indicator MT5
Marzena Maria Szmit
5 (2)
The AT Forex Indicator MT5 is a sophisticated trading tool designed to provide traders with a comprehensive analysis of multiple currency pairs. This powerful indicator simplifies the complex nature of the forex market, making it accessible for both novice and experienced traders. AT Forex Indicator uses advanced algorithms to detect trends, patterns and is an essential tool for traders aiming to enhance their forex trading performance. With its robust features, ease of use, and reliable signal
The Trap Play MT5
Carl Gustav Johan Ekstrom
5 (1)
Trap Play  refers to a market situation where price initially makes a new high or low, luring traders into believing a strong trend is forming. However, the price quickly reverses and invalidates the breakout, trapping those traders who entered positions based on the initial move. This sudden reversal often results in a rapid exit of positions, leading to significant price movement in the opposite direction.  Trap plays  can occur in various financial markets and timeframes and are characterized
The set of most common indicators for day trading and long-term trading. MAs Cross (Global Trend) ADX Based Candle Color (Local Trend) Pivot Points (Entry Levels) Kijun-Sen You can use this indicator in different ways, one of it is opening positions in trend direction on pivot points levels. Contact  If you have some questions or if you need help, contact me via Private Message.
Otros productos de este autor
Ranging Market Detector
Innovicient Limited
5 (2)
Ranging Market Detector scans the market for momentum and price to check whether the price is range- bound and the direction to which it will breakout.  It works with all the  all assets and visually shows you the instances when the market is either ranging or trending. Informs when the price has finished a retracement, an opportune time to re-enter the trend early. This will help you in position management.  It works very well for Scalping, Day trading, and Swing trading. Helpful in all timefra
Trendy Stocks
Innovicient Limited
5 (2)
Trendy Stock is a price following indicator that uses Stochastic to show when the price is out of the oversold or overbought areas.  The algorithm allows you to stay longer in a trend where the bulls or bears are in control. The indicator changes color immediately the price exits oversold/overbought state. In short, the downtrend [red] bars start to paint when the buying pressure decreases while the uptrend [green] bars form as the buy pressure kicks in.    For MT4 version, follow :: https://www
FREE
The True Oversold Overbought indicator provides you with ability to swiftly check whether the asset is oversold or overbought.  Other than complementing your trading with True Oversold Overbought, you can use the indicator as your only trading system. It works with all forex instruments and will save you the headache of estimating when the market is due for a reversal or retracement.  When the "Super Charge" feature is enabled, the areas where the price is in oversold/overbought status are ampli
Trendy Stock is a price following indicator that uses Stochastic to show when the price is out of the oversold or overbought areas.  The algorithm allows you to stay longer in a trend where the bulls or bears are in control. The indicator changes color immediately the price exits oversold/overbought state. In short, the downtrend [red] bars start to paint when the buying pressure decreases while the uptrend [green] bars form as the buy pressure kicks in.  For MT5 version, follow ::     https://w
FREE
Chart Analyzer
Innovicient Limited
The Chart Analyzer is an MT4 indicator that provides visual arrow signals without redrawing them. In addition, we have included trendlines to validate your entries. This indicator has been fine-tuned to work with all timeframes and instruments.  The Chart Analyzer has a number of advantages Does not fade or remove arrows when drawn Sends both email and phone alerts. It is light on computer resources Easy to install. Default setting works just fine.  If price opens above the trendline, open
Retracement Feeder
Innovicient Limited
5 (1)
The Retracement Feeder checks for retracement opportunities after the first move has occurred.  Basically it scans for the second wave of trend. Works with any financial instrument,  It does not repaint/change color or cancel arrows, Easy to set and use. Works great with Renko Charts MT5 version:  https://www.mql5.com/en/market/product/71340 How it works The indicator is based on RSI and Stochastics.  The algorithm used in the Retracement Feeder allows the Stochastic and RSI to minimiz
The True Oversold Overbought indicator provides you with ability to swiftly check whether the asset is oversold or overbought.  Other than complementing your trading with True Oversold Overbought, you can use the indicator as your only trading system. It works with all forex instruments and will save you the headache of estimating when the market is due for a reversal or retracement.  When the "Super Charge" feature is enabled, the areas where the price is in oversold/overbought status are ampl
Introduction The Convergence Divergence Suite contains 17 indicators , built-in MT4 technical indicators and custom ones . The list will be increased in subsequent versions as per users' requests.  Any selected indicator is loaded on your chart then automatic Convergence and Divergence trend lines are drawn on the chart and indicator. This tool is important if you use any of the listed indicators or convergence/divergence in your strategy. Advantages With the Convergence Divergence Suite you
Hot Zones
Innovicient Limited
This indicator simplifies your entry zones by displaying the areas where you can plan your entry that potentially could give you high risk/reward ratios. Other than picking the most optimal entry points, the Hot Zone indicator can act as your typical support/resistance indicator for pullbacks for all timeframes. You can use this indicator as the only trading indicator or use it with another indicator for reentry purposes.  Besides, when using Hot Zones, the risk/reward ratio should be well abov
Price Elevator MT4
Innovicient Limited
The Price Elevator indicator is developed to help you figure out the general long-term trend of the market. If the price is above the Green separator line, this is a clear indication the bulls are in control. Similarly, the bears are in control if the price continues to trend below the red separator line.   Download Price Elevator MT5   Trend Re-entry In this case you would plan your buy entries above the green dotted box (make sure to set the Buy / Sell Retracement Floor=30). The SL should be
Outside The Box MT4
Innovicient Limited
5 (1)
The   Outside The Box (OTB)   is a complete trading system that provides the user with immense trading ability by highlighting on the chart areas where the trader should prepare to Re-enter the trend after pullbacks (Pullback trading strategy) Take partial/complete profit(Profit taking strategy), and Trade breakouts (Stock breakout strategy) - We have updated the indicator to show/hide Micro breakout areas around the major breakouts (Micro Breakouts).  The above is supported by an alert system
Trend Support Resistance is a fairly simple indicator that provides traders with confirmed immediate support and resistance in whatever timeframe you monitor. It's good for short-term and long-term order blocks. With the default settings, the indicator identifies critical support and resistance areas. Bearish Order Blocks are around the OrangeRed areas while Bullish Order Blocks almost always form near the LawnGreen areas. We have also added a Multi-timeframe feature that can be helpful to allow
Essential Trader
Innovicient Limited
The Essential Trader indicator is more comfortable with whipsaw/ranging market conditions. It is not a complicated trading indicator and can be used on any timeframe with high level of confidence. Besides, it has notifications and alerts. The dotted essential points show spots where you can make immediate entries and benefit from breakout on either side of the region. On the other hand, the color filled points display reversal regions. These are important in that you can trade along the trend or
The Retracement Feeder  checks for retracement opportunities after the first move has occurred.  Basically it scans for the second wave of trend. Works with any financial instrument,  It does not repaint/change color or cancel arrows, Easy to set and use. Works great with Renko Charts MT4 version:  https://www.mql5.com/en/market/product/67443 How it works The indicator is based on RSI and Stochastics.  The algorithm used in the Retracement Feeder allows the Stochastic and RSI to minimize the t
Hot Zones MT5
Innovicient Limited
This indicator simplifies your entry zones by displaying the areas where you can plan your entry that potentially could give you high risk/reward ratios. Other than picking the most optimal entry points, the Hot Zone indicator can act as your typical support/resistance indicator for pullbacks for all timeframes. You can use this indicator as the only trading indicator or use it with another indicator for reentry purposes.  Besides, when using Hot Zones, the risk/reward ratio should be well abov
Trend Guard MT5
Innovicient Limited
Bollinger Band is one if the most useful indicators if used properly. Trend Guard used the parameters based on Bollinger to create a tool that can help traders enter trades at most optimal level. The indicator is useful to all traders since it checks for retracements and changing trend direction. With this indicator, you get the opportunity to open trades early and also lock your profits based on the dotted trend lines that form after a certain level of Bollinger band. We have simplified the ind
Price Elevator
Innovicient Limited
The Price Elevator indicator is developed to help you figure out the general long-term trend of the market. If the price is above the Green separator line, this is a clear indication the bulls are in control. Similarly, the bears are in control if the price continues to trend below the red separator line.   Download Price Elevator MT4   Trend Re-entry In this case you would plan your buy entries above the green dotted box (make sure to set the Buy / Sell Retracement Floor=30). The SL should be
Trend Support Resistance is a fairly simple indicator that provides traders with confirmed immediate support and resistance in whatever timeframe you monitor. It's good for short-term and long-term order blocks. With the default settings, the indicator identifies critical support and resistance areas. Bearish Order Blocks are around the OrangeRed areas while Bullish Order Blocks almost always form near the LawnGreen areas. We have also added a Multi-timeframe feature that can be helpful to allow
The Essential Trader indicator is more   comfortable with whipsaw/ranging market conditions. It is not a complicated trading indicator and can be used on any timeframe with high level of confidence. Besides, it has notifications and alerts. The dotted essential points show spots where you can make immediate entries and benefit from breakout on either side of the region. On the other hand, the color filled points display reversal regions. These are important in that you can trade along the trend
Filtro:
No hay comentarios
Respuesta al comentario
Versión 1.37 2024.07.13
The default History amount has been reduced from 2000 bars to 200.
Versión 1.36 2022.09.24
Update to prevent indicator from fetching entire history.
Versión 1.35 2022.09.23
Display bug removed.
Versión 1.34 2022.08.18
Typo correction
Versión 1.33 2022.08.06
Added "Micro Breakout" Feature
Versión 1.32 2022.07.25
Minor alert bug fix
Versión 1.31 2022.07.24
>You can now adjust the value of the main indicator to suit different instruments as per the user's desire
>Added alerts (Screen alert, Push notifications and Email)
>Improvement of boxes