Williams Vix Fix MT5
- Indicadores
- Diego Arribas Lopez
- Versión: 1.0
- Activaciones: 5
Williams Vix Fix MT5
¿Necesitas ayuda para encontrar cuándo el mercado ha alcanza el próximo suelo?
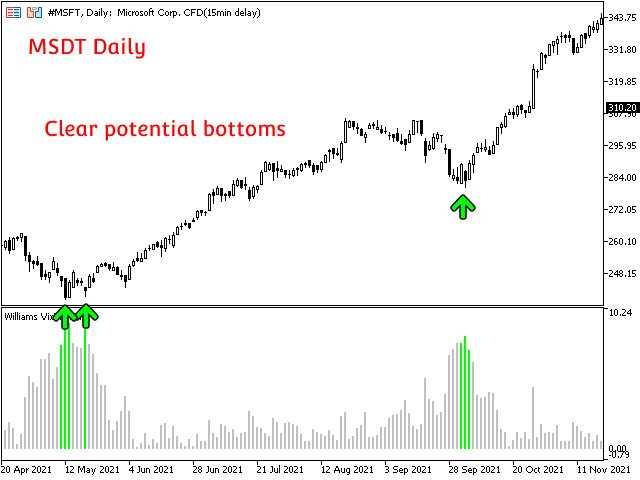
Williams Vix Fix MT5 se basa en la volatilidad del mercado y otorga un gran apoyo para saber cuándo una corrección está llegando a su fin.
¡PRUÉBALO GRATIS AHORA!
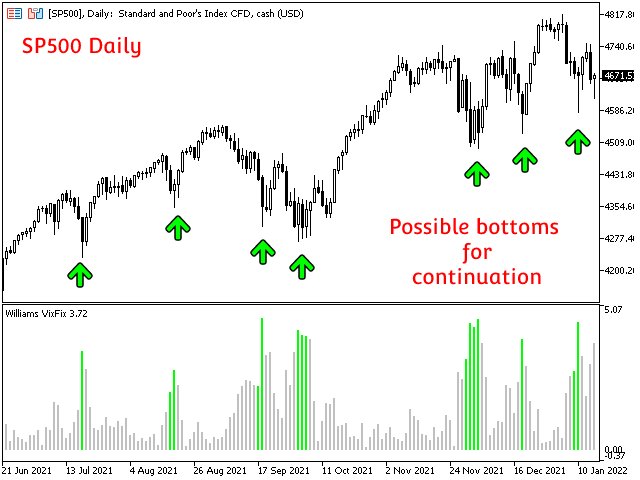
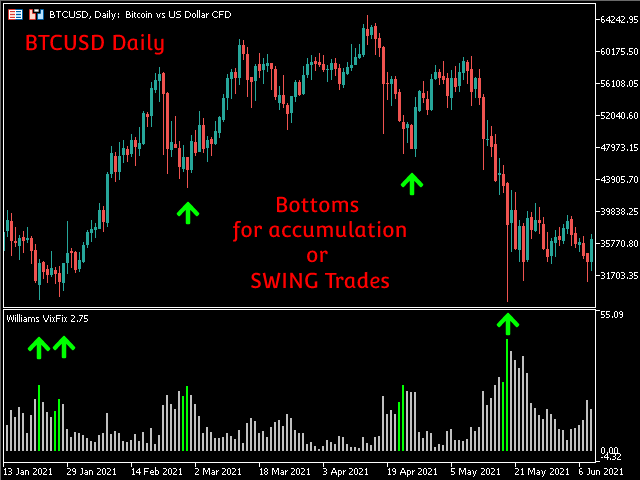
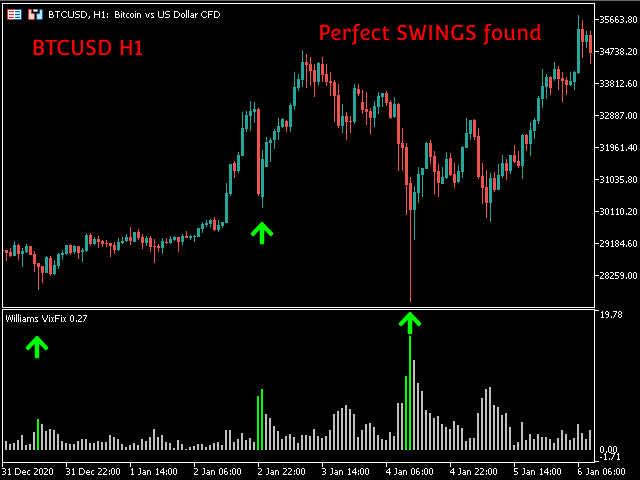
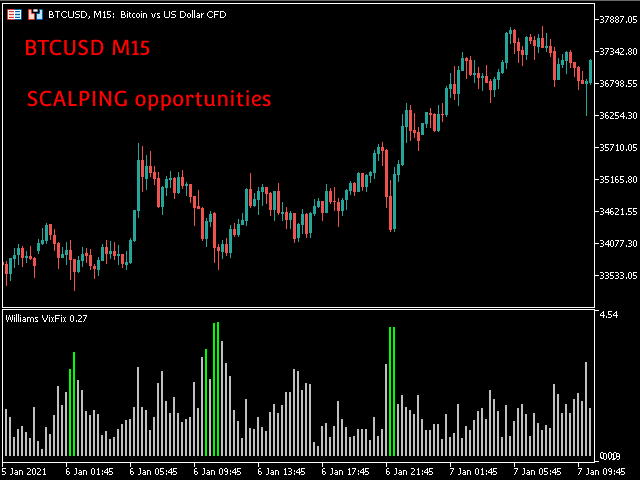
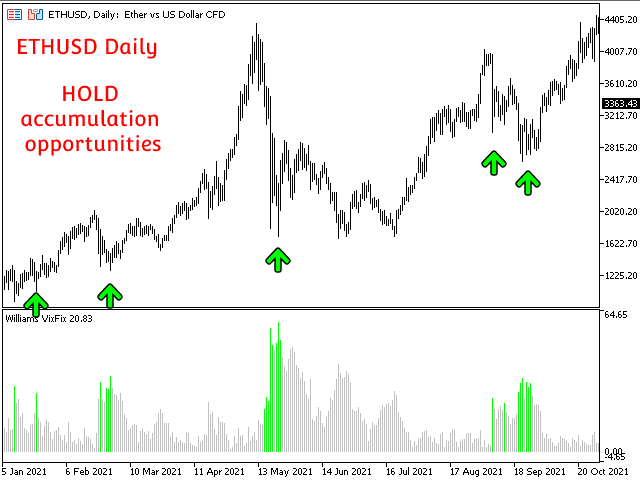
Williams Vix Fix MT5 deriva del indicador VixFix de Larry Williams adaptado para todo tipo de activos financieros. VIX representa el miedo y la codicia en el mercado en función de su volatilidad. Un valor alto de VIX indica miedo en el mercado, este suele ser un buen momento para buscar la acumulación de posiciones largas o la búsqueda de operaciones largas con horizonte temporal más corto. Williams Vix Fix MT5 puede abrir grandes oportunidades si es combinado con marcos temporales menores.
VIX Fix se calcula utilizando la siguiente fórmula:
VIX Fix = (Highest(Close, 22) - Low) / (Highest(Close,22)) * 100
Este indicador ofrece la posibilidad de adaptar la fuente del precio (al máximo, cierre o a la apertura, mediano, típico y ponderado) y el período para la comparación. Esto permite adaptarse mejor a la clase de activo deseada. Además combina las Bandas de Bollinger y percentiles para resaltar mejor posibles suelos.
Este indicador se puede usar solo, con un método de grid para estrategias de HOLD o analizando marcos temporales mayores y buscando entradas en marcos temporales más bajos para estrategias SCALPING y SWING.
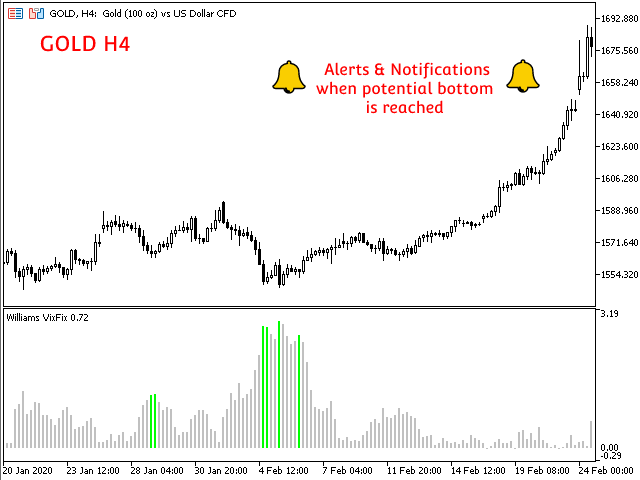
Al mismo tiempo, Williams Vix Fix MT5 proporciona un sistema de alertas y notificaciones en el teléfono móvil y en la Terminal MT5 cuando el precio alcanza un posible suelo.
Algunas de las características del indicador son las siguientes:
- Ahorro de tiempo
- Proporcina información sobre el precio alcanzando posibles suelos
- Ayuda en la toma de decisiones para entradas
- Altamente personalizable
- Funcional en todos los pares (Crypto, Forex, Stocks, Indices, Commodities...)
- Perfecto para Scalping, HOLD o Swing trading
- Alertas y notificaciones en el terminal MT5 y en el teléfono móvil
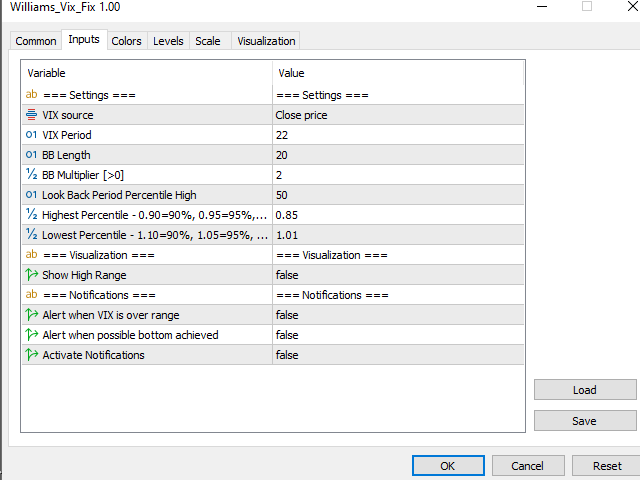
Parámetros de entrada
Settings:
- VIX Source: Fuente de datos del precios para el cálculo de VIX (alto, abierto, cerrado, mediano, típico y ponderado)
- VIX Period: Período de la desviación estándar para el cálculo VIX
- BB Length: Periodo de las Bandas de Bollinger
- BB Multiplier: Multiplicador de las Bandas de Bollinger [>0]
- Look Back Period Percentile High: Número de velas para comprobar el percentil alto
- Highest Percentile: Nivel de Percentil alto (0.90=90%, 0.95=95%, 0.99=99%)
- Lowest Percentile: Nivel de Percentil bajo (0.90=90%, 0.95=95%, 0.99=99%)
- Show High Range: muestra el rango VIX en la ventana del indicador
Notificaciones:
- Alert when VIX is over range: Habilita alertas en la terminal MT5 cada vez que VIX sale del rango
- Alert when possible bottom achieved: Habilita alertas en la Terminal MT5 si el precio alcanza un posible suelo
- Activate Notifications: habilita las notificaciones del teléfono
Soporte y preguntas
Para preguntas y soporte no dudes en ponerte en contacto conmigo
Autor
Diego Arribas, inversor privado y especulador, ingeniero de automatización en la industria aeroespacial
El usuario no ha dejado ningún comentario para su valoración