Draw Candle To Correlation
- Indicadores
- Jose Wdison De Souza
- Versión: 1.3
- Activaciones: 20
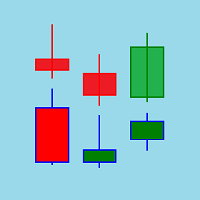
Draw Candle
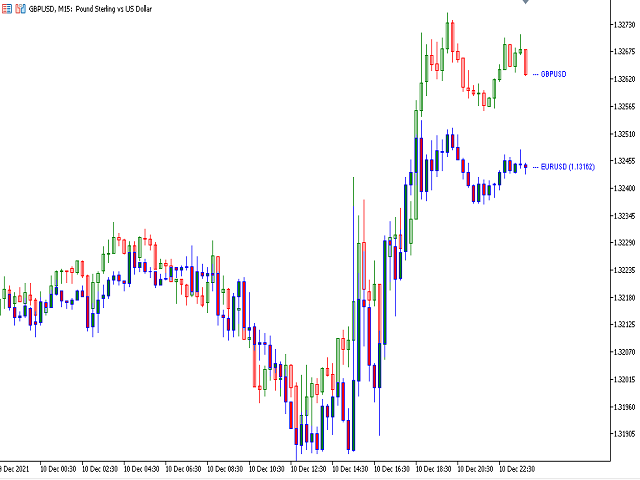
Can you imagine, a direct correlation view on the same chart, seeing an asset and at the same time seeing another asset?
So you found the right indicator.
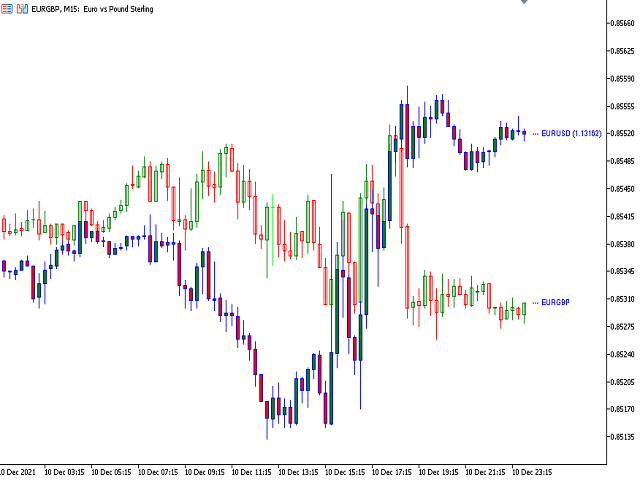
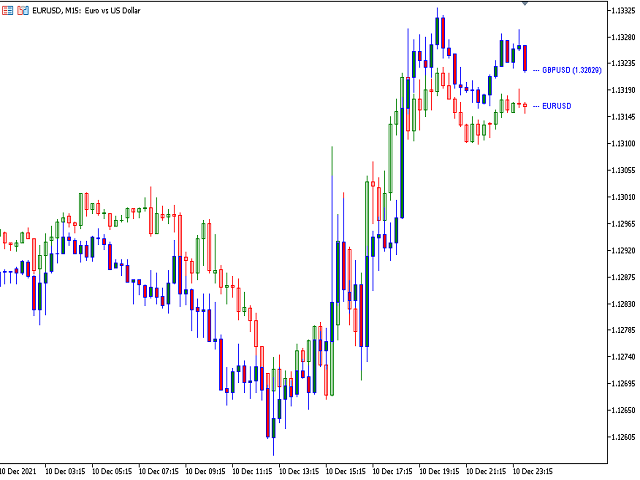
This indicator will draw the asset you choose and have in your brokerage inside the chart of another asset.
Just open a chart of your trading asset, which as an example could be the EURUSD, add this indicator to the chart and in the variable "Correlated Pair", add the asset you want, which for this example can be GBPUSD, EURGBP.
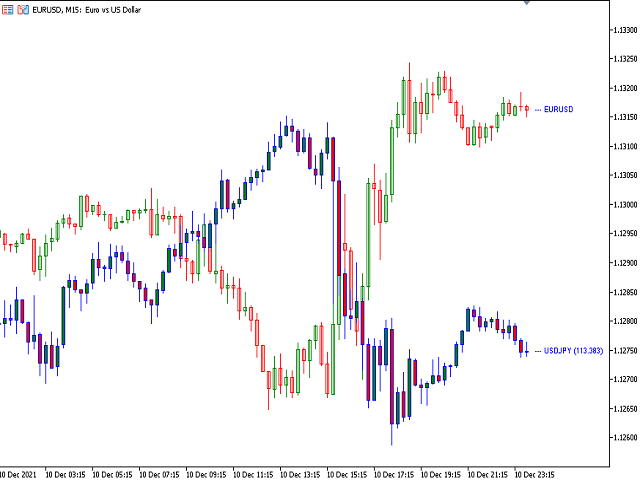
And that's not all, you can place this same indicator as many times as you like on the same chart, and you can also place a negative correlation, which would be the USDJPY.
The indicator variables are:
- "Par correlacionado": Code of the asset whose candles will be drawn on the chart.
- "Quantidade de barras": Number of asset candles that will be drawn on the chart.
- "Shift": Position of the candlesticks in relation to the asset candlesticks on the chart. Ex: 0 equal, positive in front and negative in back.
- "ShowLabelsAssets": Variable that indicates whether the last candle on the indicator will have a label with the asset's name.
- "ColorLabelsAssets": The color that the asset's label will be drawn.
Google translated from portuguese Brazil: https://www.mql5.com/pt/market/product/75463
