• Información general
  • Comentarios
  • Discusión

MultiTimeFrame Support Resistance Levels Indicator

53% OFF until December 31 (Normal price $125)! Don't miss the opportunity to have this invaluable tool! 


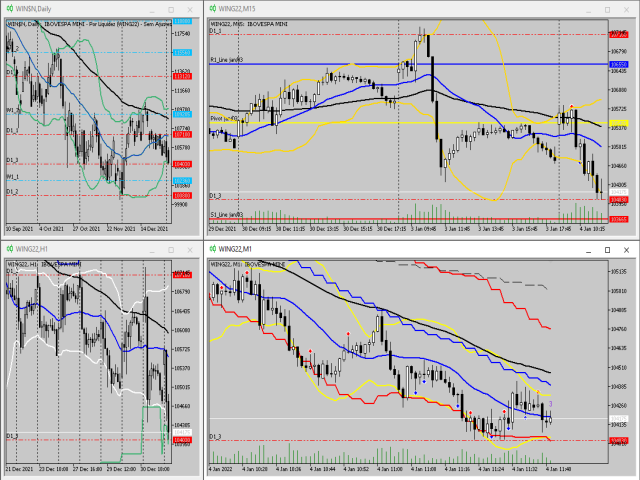
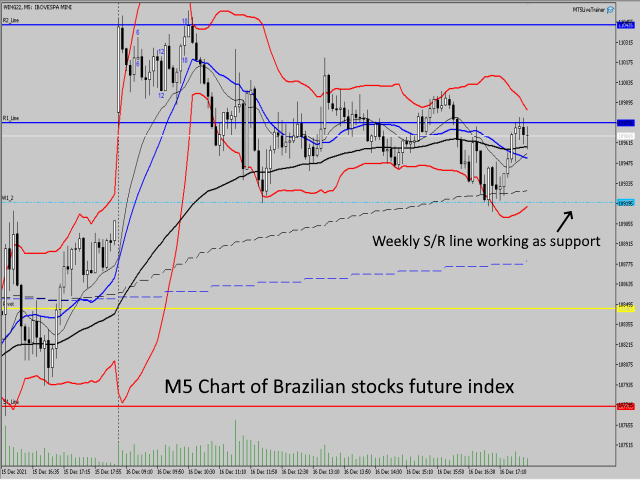
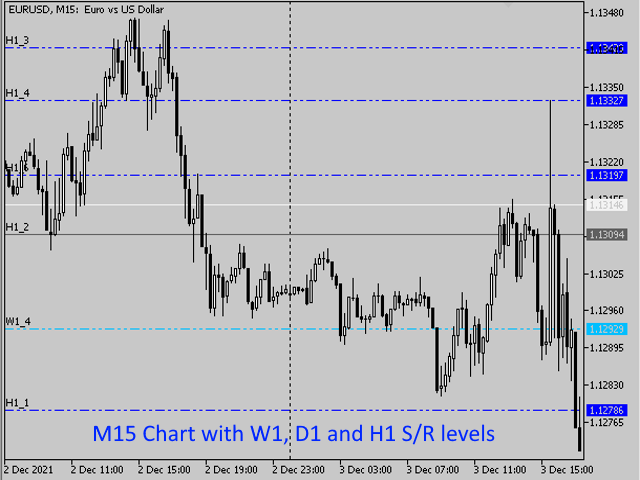
This is a totally automated multi timeframe support and resistance levels finder on every MT5 chart. No manual work! Just drop this indicator on a chart and you will have the S/R levels always up to date. It is very convenient and helps the trader to anticipate possible stalls and reversions in price movements. The levels are displayed as lines and each timeframe has a different color.

The indicator uses a minimum of computer resources, so it can be used in several charts at the same time without impacting MT5 performance.

Parameters:

1 - Use candle body or high/low: Can be "CandleBody" or "CandleHighLow". CandleBody ignores the candles' wicks to determine the S/R levels.

2 - Symbol: If left empty, uses the chart's symbol. This field can be used with instruments that expire monthly but have a continuous series. Put the continuous series here.

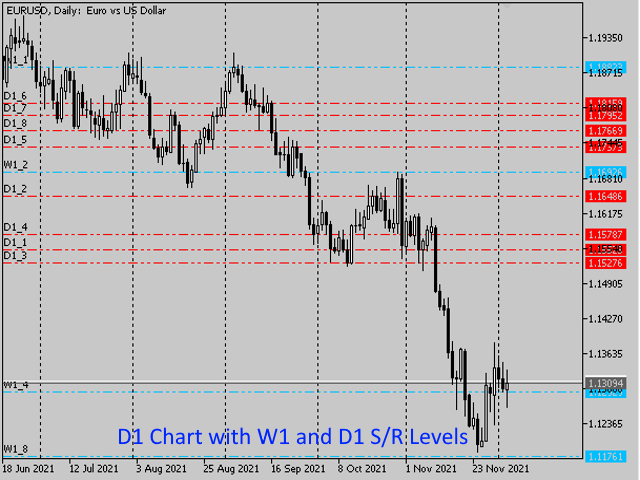
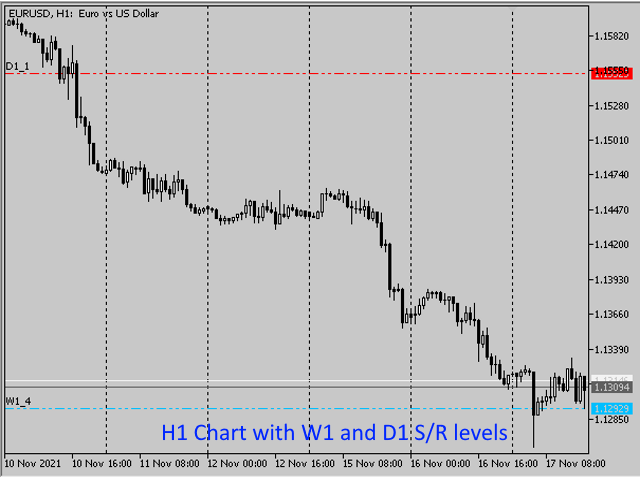
3 - Timeframes: A comma separated list of the timeframes to be used to determine the S/R levels. For instance W1,D1,H1 will draw the S/R levels found in the weekly, daily and hourly candles. Valid timeframes are MN, W1, D1, H4, H1, M15, M5 and M1.

4 - Number of bars: A comma separated list with the number of bars used to search for the S/R in each timeframe. For instance 104,110,50 will use 104 weekly bars, 110 daily bars and 50 hourly bars.

5 - Minimum distance between levels: A comma separated list with the minimum distance between levels. Levels closer than the minimum distance are eliminated with priority to the level from the larger timeframe.

6 - Distance type between levels: The minimum distance between levels can be specified in terms of PercentageOfPrice, FixedPoints (integer) or AverageCandleSize. 

Other parameters: Lines Styles and Colors

Productos recomendados
RevCan Trend Entry MT5
A K M Syedur Rahman
5 (1)
[75% OFF - SALE ENDS SOON] - RevCan Trend Entry Point   is a trend based trade alert indicator for serious traders. It does all the price and chart analysis all by itself, and whenever it finds any potential high quality trading opportunity(Buy or Sell) using its revolutionized price prediction algorithms, it sends instant trade alert directly on the chart, MT4 terminal and on the mobile device.  The trade signals will be visible on the chart as Up and Down arrows, while the instant audible ale
The Antique Trend Indicator is a revolutionary trend trading and filtering solution with all the important features of a trend tool built into one tool! The Antique Trend indicator is good for any trader, suitable for any trader both for Forex and binary options. There is no need to configure anything, everything has been perfected by time and experience, it works great during flats and trends. The Antique Trend indicator is a tool for technical analysis of financial markets, reflecting curre
Pullback Hunter
Anton Polkovnikov
PULLBACK HUNTER (CAZADOR DE RETROCESOS) ¿Cuál es el último sueño de todo comerciante? Para ver sin demora dónde se producirá el retroceso. Por supuesto, es una especie de magia, aunque... nada es imposible. Pero mientras tanto he preparado para usted un indicador que marca en tiempo real el final de la corrección al movimiento actual o en pocas palabras - capta los retrocesos. ¿Cuál es la idea principal? Mucha gente practica los rebotes cuando el precio se mueve en la dirección de la posición ab
KT Horizontal Lines MT5
KEENBASE SOFTWARE SOLUTIONS
In MetaTrader, plotting multiple   horizontal lines   and then tracking their respective price levels can be a hassle. This indicator automatically plots multiple horizontal lines at equal intervals for setting price alerts, plotting support and resistance levels, and other manual purposes. This indicator is suitable for Forex traders who are new and looking for chances to make quick profits from buying and selling. Horizontal lines can help traders find possible areas to start trading when the
To download MT4 version please click here . This is the exact conversion from TradingView: "WaveTrend [LazyBear]" By "zeusuk3". One of the coolest indicators out there to detect overbought and oversold zones. It can be used as a part of more complicated strategy and for confirming a potential trade setup. There are buffers to use in EAs also. The indicator is loaded light and non-repaint. - You can message in private chat for further changes you need. Thanks for downloading 
Indicador único que implementa un enfoque profesional y cuantitativo para el comercio de reversión a la media. Aprovecha el hecho de que el precio se desvía y vuelve a la media de manera predecible y medible, lo que permite reglas claras de entrada y salida que superan ampliamente las estrategias comerciales no cuantitativas. [ Installation Guide | Update Guide | Troubleshooting | FAQ | All Products ] Señales comerciales claras Sorprendentemente fácil de operar Colores y tamaños personalizable
The new update makes this indicator a complete tool for studying, analyzing and operating probabilistic patterns. It includes: On-chart Multi-asset percentage monitor. Configurable martingales. Twenty-one pre-configured patterns, including Mhi patterns and C3. An advanced pattern editor to store up to 5 custom patterns. Backtest mode to test results with loss reports. Trend filter. Hit operational filter. Martingale Cycles option. Various types of strategies and alerts. Confluence between patter
The Riko Trend indicator is a revolutionary trend trading and filtering solution with all the important features of a trend tool built into one tool! The Riko Trend indicator is good for any trader, suitable for any trader for both forex and binary options. You don’t need to configure anything, everything is perfected by time and experience, it works great during a flat and in a trend. The Riko Trend indicator is a technical analysis tool for financial markets that reflects the current price
through this indicator you can make  analysis and also can to distinguish possible weakness or continuous strength  on  price, it is an indicator initially developed by David Weis. This version is for the meta trader 5 platform. The Weis Waves indicator is based on volume and is aligned with the price, being able to find not only possible strenght and weakness, but also possible divergences between price and volume, bringing an interesting analysis between both.
Mine Farm
Maryna Kauzova
5 (1)
Mine Farm is one of the most classic and time-tested scalping strategies based on the breakdown of strong price levels. Mine Farm is the author's modification of the system for determining entry and exit points into the market... Mine Farm - is the combination of great potential with reliability and safety. Why Mine Farm?! - each order has a short dynamic Stop Loss - the advisor does not use any risky methods (averaging, martingale, grid, locking, etc.) - the advisor tries to get
Volume by Price MT5
Brian Collard
3.6 (5)
The Volumebyprice.com Indicator for MetaTrader 5 features Volume Profile and Market Profile TPO (Time Price Opportunity). Volume and TPO histogram bar and line charts. Volume Footprint charts. TPO letter and block marker collapsed and split structure charts. Static, dynamic and flexible range segmentation and compositing methods with relative and absolute visualizations. Session hours filtering and segment concatenation with Market Watch and custom user specifications. Graphical layering, posit
Tool for Identifying Potential Reversal Points and Trend Direction This tool is excellent for identifying potential reversal points and trend direction in the market. It works well with confirming indicators such as MACD, Stochastic, RSI - standard indicators available on all MT5 platforms. Together with them, it forms a reliable strategy. In the settings, you can adjust the channel distance and period. It is recommended to enter a trade when the signal line crosses the upper channel bounda
Your Trend Friend
Luigi Nunes Labigalini
5 (1)
The trend is your friend! Look at the color of the indicator and trade on that direction. It does not  repaint. After each candle is closed, that's the color of the trend. You can focus on shorter faster trends or major trends, just test what's most suitable for the symbol and timeframe you trade. Simply change the "Length" parameter and the indicator will automatically adapt. You can also change the color, thickness and style of the lines. Download and give it a try! There are big movements
Mean Reversion Supply Demand Indicator Mean Reversion Supply Demand is the indicator to detect the important supply demand zone in your chart. The concept of supply demand trading relies on the quantity mismatching between buying and selling volumes in the financial market. Typically, supply demand zone serves to predict the turning point. The wave pattern, for any supply demand zone to work as an successful trade, looks like the price must touch the base zone, move away and then return to zone
Provided Trend is a complex signal formation indicator. As a result of the work of internal algorithms, you can see only three types of signals on your chart. The first is a buy signal, the second is a sell signal, and the third is a market exit signal. Options: CalcFlatSlow - The first parameter that controls the main function of splitting the price chart into waves. CalcFlatFast - The second parameter that controls the main function of splitting the price chart into waves. CalcFlatAvg - Par
Ugenesys AI MT5
Odaine Ramon Mcmillan
uGenesys AI - 90% Accurate Daytrading Indicator Introducing the ultimate forex trading indicator system, uGenesys AI, powered by cutting-edge AI technology and advanced analytical techniques, including Time-Series Analysis and Genetic Algorithms. Our AI-powered trading system leverages the power of time-series analysis to identify trends and patterns in historical price data, allowing traders to make informed predictions about future market movements. By analyzing vast amounts of data, our sys
Was: $249  Now: $99   Market Profile defines a number of day types that can help the trader to determine market behaviour. A key feature is the Value Area, representing the range of price action where 70% of trading took place. Understanding the Value Area can give traders valuable insight into market direction and establish the higher odds trade. It is an excellent addition to any system you may be using. Inspired by Jim Dalton’s book “Mind Over Markets”, this indicator is designed to suit the
Owl Smart Levels MT5
Sergey Ermolov
4.31 (39)
Versión MT4  |  FAQ El Indicador Owl Smart Levels es un sistema comercial completo dentro de un indicador que incluye herramientas de análisis de mercado tan populares como los fractales avanzados de Bill Williams , Valable ZigZag que construye la estructura de onda correcta del mercado y los niveles de Fibonacci que marcan los niveles exactos de entrada. en el mercado y lugares para tomar ganancias. Descripción detallada de la estrategia Instrucciones para trabajar con el indicador Asesor de c
Best SAR MT5
Ashkan Hazegh Nikrou
5 (1)
Descripción :  nos complace presentar nuestro nuevo indicador gratuito basado en uno de los indicadores profesionales y populares en el mercado de divisas (PSAR). Este indicador es una nueva modificación del indicador Parabolic SAR original. En el indicador pro SAR puede ver el cruce entre puntos y el gráfico de precios. el cruce no es una señal, pero habla sobre el final del potencial de movimiento, puede comenzar a comprar con un nuevo punto azul y colocar un límite de pérdidas un atr antes
FREE
Tops and Bottoms Indicator
Josue De Matos Silva
4.57 (7)
Tops & Bottoms Indicator FREE   Tops abd Bottoms:   An effective indicator for your trades The tops and bottoms indicator helps you to find  ascending and descending channel formations with indications of ascending and/or descending tops and bottoms. In addition, it  show possibles  opportunities with a small yellow circle when the indicator encounters an impulse formation. This indicator provide to you  more security and speed in making entry decisions. Also test our FREE advisor indicator:
FREE
UR Gamma MT5
Krzysztof Jan Debski
Gama UR (impulsado por cálculos similares que se encuentran en los sistemas de aprendizaje automático) UR Gamma es una herramienta de análisis financiero de vanguardia que ofrece una versión nueva y mejorada del indicador clásico WaveTrend. Al incorporar técnicas avanzadas de procesamiento de señales digitales, UR Gamma aborda algunas de las limitaciones de los algoritmos WaveTrend tradicionales y brinda un enfoque más preciso, sólido y dinámico para identificar y medir tendencias en la acció
This indicator uses the metaquotes ZigZag indicator as base to plot fibonacci extension and fibonacci retracement based in the Elliot waves. A fibonacci retracement will be plotted on every wave draw by the ZigZag. A fibonacci extension will be plotted only after the 2nd wave. Both fibonacci will be updated over the same wave tendency. Supporting until 9 consecutive elliot waves. Parameters: Depth: How much the algorithm will iterate to find the lowest and highest candles Deviation: Amoun
Contact me after payment to send you the user manual PDF file. Download the MT4 version here. Unlocking Trading Insights Dive into the heart of market dynamics with Advance Divergence Scanner designed for traders seeking a competitive edge. The Divergence Indicator is your key to identifying crucial divergences across various charts, empowering you to make informed decisions in the dynamic world of financial markets. The Divergence A Divergence signals a potential reversal point because directi
KT Renko Patterns MT5
KEENBASE SOFTWARE SOLUTIONS
KT Renko Patterns scans the Renko chart brick by brick to find some famous chart patterns that are frequently used by traders across the various financial markets. Compared to the time-based charts, patterns based trading is easier and more evident on Renko charts due to their uncluttered appearance. KT Renko Patterns features multiple Renko patterns, and many of these patterns are extensively explained in the book titled Profitable Trading with Renko Charts by Prashant Shah. A 100% automate
Noize Absorption Index - is the manual trading system that measures the difference of pressure between bears forces and bulls forces. Green line - is a noize free index that showing curent situation. Zero value of index shows totally choppy/flat market.Values above zero level shows how powerfull bullish wave is and values below zero measures bearish forces.Up arrow appears on bearish market when it's ready to reverse, dn arrow appears on weak bullish market, as a result of reverse expectation.
How to use Pair Trading Station Pair Trading Station is recommended for H1 time frame and you can use it for any currency pairs. To generate buy and sell signal, follow few steps below to apply Pair Trading Station to your MetaTrader terminal. When you load Pair Trading Station on your chart, Pair Trading station will assess available historical data in your MetaTrader platforms for each currency pair. On your chart, the amount of historical data available will be displayed for each currency pai
SolarTrade Suite 金融机器人:LaunchPad 市场专家 - 专为开启交易而设计! 这是一个使用特殊创新和先进算法来计算其价值的交易机器人,是您在金融市场世界中的助手。 使用我们来自 SolarTrade Suite 系列的指标集来更好地选择启动此机器人的时机。 在描述底部查看我们来自 SolarTrade Suite 系列的其他产品。 您想自信地驾驭投资和金融市场的世界吗? SolarTrade Suite 金融机器人:LaunchPad 市场专家是一款创新软件,旨在帮助您做出明智的投资决策并增加您的利润。 SolarTrade Suite 金融机器人的优势:LaunchPad 市场专家: - 准确计算:我们的机器人使用先进的算法和分析方法来准确预测市场走势。 计算购买和出售资产的最佳时机。 - 用户友好界面:直观的界面将使您能够轻松掌握程序并在安装后立即开始享受其好处。 - 专家支持:我们的专业团队随时准备为您解答任何问题,并为您提供有关使用该程序的建议。 立即试用 SolarTrade Suite 金融机器人:LaunchP
RENKO PRICE ACTION ATR es un "Asesor Experto" desarrollado a través de la construcción del Cuadro Renko donde cada LADRILLO tiene el tamaño calculado a través del ATR del período seleccionado por el usuario. Los gráficos de Renko están diseñados para filtrar los movimientos de precios menores, lo que facilita que los operadores se centren en las tendencias importantes. Debido a su eficiencia en la detección de tendencias de precios, también es posible identificar claramente los soportes y resis
The Penta-O is a 6-point retracement harmonacci pattern which usually precedes big market movements. Penta-O patterns can expand and repaint quite a bit. To make things easier this indicator implements a twist: it waits for a donchian breakout in the right direction before signaling the trade. The end result is an otherwise repainting indicator with a very reliable trading signal. The donchian breakout period is entered as an input. [ Installation Guide | Update Guide | Troubleshooting | FAQ | A
A HalfTrend scanner for MT5 (MetaTrader 5) is a technical analysis tool designed to help traders identify trend reversals and trade opportunities in the market. The HalfTrend indicator itself is based on price movements and a specific algorithm that identifies changes in market direction. Here’s a detailed description of an MT5 HalfTrend scanner: Overview The MT5 HalfTrend scanner is an advanced tool that scans multiple currency pairs or financial instruments for potential trend reversal signals
Los compradores de este producto también adquieren
Atomic Analyst MT5
Issam Kassas
4.79 (19)
En primer lugar, vale la pena enfatizar que este Indicador de Trading no repinta, no redibuja y no se retrasa, lo que lo hace ideal tanto para el trading manual como para el automatizado. Manual del usuario: configuraciones, entradas y estrategia. El Analista Atómico es un Indicador de Acción del Precio PA que utiliza la fuerza y el impulso del precio para encontrar una mejor ventaja en el mercado. Equipado con filtros avanzados que ayudan a eliminar ruidos y señales falsas, y aumentan el poten
Primero que todo, vale la pena enfatizar que este Sistema de Trading es un Indicador No Repintado, No Redibujado y No Retrasado, lo que lo hace ideal tanto para el trading manual como para el automatizado. Curso en línea, manual y descarga de ajustes preestablecidos. El "Sistema de Trading Inteligente MT5" es una solución completa de trading diseñada para traders nuevos y experimentados. Combina más de 10 indicadores premium y presenta más de 7 estrategias de trading robustas, lo que lo convie
Quantum Trend Sniper
Bogdan Ion Puscasu
4.92 (48)
Introduciendo       Indicador Quantum Trend Sniper   , el innovador indicador MQL5 que está transformando la forma en que identificas y negocias los cambios de tendencia. Desarrollado por un equipo de comerciantes experimentados con experiencia comercial de más de 13 años,       Indicador de francotirador de tendencia cuántica       está diseñado para impulsar su viaje comercial a nuevas alturas con su forma innovadora de identificar cambios de tendencia con una precisión extremadamente alta.
TPSproTREND PrO MT5
Roman Podpora
4.89 (9)
TPSpro TREND PRO  - is a trend indicator that automatically analyzes the market and provides information about the trend and each of its changes, as well as giving signals for entering trades without redrawing! The indicator uses each candle, analyzing them separately. referring to different impulses - up or down impulse. Exact entry points into transactions for currencies, crypto, metals, stocks, indices!  Version MT4               DETAILED DESCRIPTION               R ecommended to use with an
TPSpro RFI Levels MT5
Roman Podpora
4.67 (9)
Reversal First Impulse levels (RFI)      INSTRUCTIONS        RUS       -       ENG              R ecommended to use with an indicator   -   TPSpro  TREND PRO -  Version MT4                 A key element in trading is zones or levels from which decisions to buy or sell a trading instrument are made. Despite attempts by major players to conceal their presence in the market, they inevitably leave traces. Our task was to learn how to identify these traces and interpret them correctly. Main functi
FX Power MT5 NG
Daniel Stein
5 (6)
Obtenga su actualización diaria del mercado con detalles y capturas de pantalla a través de nuestro Morning Briefing aquí en mql5 y en Telegram ! FX Power MT5 NG es la nueva generación de nuestro popular medidor de fuerza de divisas, FX Power. ¿Y qué ofrece este medidor de fuerza de nueva generación? Todo lo que le encantaba del FX Power original PLUS Análisis de fuerza de ORO/XAU Resultados de cálculo aún más precisos Períodos de análisis configurables individualmente Límite de cálculo persona
ICT, SMC, SMART MONEY CONCEPTS, SMART MONEY, Smart Money Concept, Support and Resistance, Trend Analysis, Price Action, Market Structure, Order Blocks, BOS/CHoCH,   Breaker Blocks ,  Momentum Shift,   Supply&Demand Zone/Order Blocks , Strong Imbalance,   HH/LL/HL/LH,    Fair Value Gap, FVG,  Premium  &   Discount   Zones, Fibonacci Retracement, OTE, Buy Side Liquidity, Sell Side Liquidity, BSL/SSL Taken, Equal Highs & Lows, MTF Dashboard, Multiple Time Frame, BigBar, HTF OB, HTF Market Structure
Automated Trendlines MT5
Georgios Kalomoiropoulos
Las líneas de tendencia son la herramienta más esencial del análisis técnico en el comercio de divisas. Desafortunadamente, la mayoría de los comerciantes no los dibujan correctamente. El indicador de líneas de tendencia automatizadas es una herramienta profesional para comerciantes serios que lo ayuda a visualizar el movimiento de tendencia de los mercados. Hay dos tipos de Trendlines Bullish Trendlines y Bearish Trendlines. En la tendencia alcista, la línea de tendencia de Forex se dib
Gartley Hunter Multi
Siarhei Vashchylka
5 (8)
Gartley Hunter Multi - An indicator for searching for harmonic patterns simultaneously on dozens of trading instruments and on all possible timeframes. Manual (Be sure to read before purchasing) | Version for MT4 Advantages 1. Patterns: Gartley, Butterfly, Shark, Crab. Bat, Alternate Bat, Deep Crab, Cypher 2. Simultaneous search for patterns on dozens of trading instruments and on all possible timeframes 3. Search for patterns of all possible sizes. From the smallest to the largest 4. A
Ahora $ 147 (aumentando a $ 499 después de algunas actualizaciones) - Cuentas ilimitadas (PC o Mac) Manual de usuario de RelicusRoad + Videos de capacitación + Acceso al grupo privado de Discord + Estado VIP UNA NUEVA MANERA DE VER EL MERCADO RelicusRoad es el indicador comercial más poderoso del mundo para divisas, futuros, criptomonedas, acciones e índices, y brinda a los comerciantes toda la información y las herramientas que necesitan para mantenerse rentables. Brindamos análisis téc
Advanced Supply Demand MT5
Bernhard Schweigert
4.53 (15)
¡Actualmente con 33% de descuento! ¡La mejor solución para cualquier tráder principiante o experto! Este indicador es una herramienta comercial única, de alta calidad y asequible, porque incorpora una serie de características patentadas y una nueva fórmula. Con esta actualización, podrá mostrar zonas de doble marco temporal. No solo podrá mostrar un marco temporal más alto, sino también mostrar ambos, el marco temporal del gráfico MÁS el marco temporal más alto: MOSTRANDO ZONAS ANIDADAS. A todos
XQ Indicator MetaTrader 5
Marzena Maria Szmit
5 (1)
Step into the realm of Forex trading with confidence and precision using XQ, a cutting-edge Forex indicator designed to elevate your trading game to unprecedented heights. Whether you're a seasoned trader or just stepping into the world of currency exchange, XQ Forex Indicator empowers you with the insights and signals needed to make informed trading decisions. The signal conditions are a combination of three indicators, and XQ Forex Indicator only display  medium and long-term trends . The ind
Blahtech Supply Demand MT5
Blahtech Limited
4.54 (13)
Was: $299  Now: $99   Supply Demand uses previous price action to identify potential imbalances between buyers and sellers. The key is to identify the better odds zones, not just the untouched ones. Blahtech Supply Demand indicator delivers functionality previously unavailable on any trading platform. This 4-in-1 indicator not only highlights the higher probability zones using a multi-criteria strength engine, but also combines it with multi-timeframe trend analysis, previously confirmed swings
Introduction to X3 Chart Pattern Scanner X3 Cherart Pattern Scanner is the non-repainting and non-lagging indicator detecting X3 chart patterns including Harmonic pattern, Elliott Wave pattern, X3 patterns, and Japanese Candlestick patterns. Historical patterns match with signal patterns. Hence, you can readily develop the solid trading strategy in your chart. More importantly, this superb pattern scanner can detect the optimal pattern of its kind. In addition, you can switch on and off individu
Este tablero muestra los últimos   patrones armónicos   disponibles para los símbolos seleccionados, por lo que ahorrará tiempo y será más eficiente /   versión MT4 . Indicador gratuito:   Basic Harmonic Pattern Columnas del indicador Symbol:   aparecerán los símbolos seleccionados Trend :   alcista o bajista Pattern :   tipo de patrón (gartley, mariposa, murciélago, cangrejo, tiburón, cifrado o ABCD) Entry :   precio de entrada SL:   precio de stop loss TP1:   1er precio de toma de benefici
Order Block Hunter MT5
Noha Mohamed Fathy Younes Badr
5 (1)
Order block hunter indicator is the best indicator for  hunt the order blocks that area where there has been a large concentration of limit orders waiting to be executed Order blocks are identified on a chart by observing previous price action and looking for areas where the price experienced significant movement or sudden changes in direction .This indicator does that for you by using very complicated codes and helps you to take the best areas To buy and sell because it make marks at the best a
AT Forex Indicator MT5
Marzena Maria Szmit
5 (4)
The AT Forex Indicator MT5 is a sophisticated trading tool designed to provide traders with a comprehensive analysis of multiple currency pairs. This powerful indicator simplifies the complex nature of the forex market, making it accessible for both novice and experienced traders. AT Forex Indicator uses advanced algorithms to detect trends, patterns and is an essential tool for traders aiming to enhance their forex trading performance. With its robust features, ease of use, and reliable signal
Este es un genial indicador para MT5 que ofrece señales precisas para entrar en una transacción sin redibujar. Se puede aplicar a cualquier activo financiero: fórex, criptomonedas, metales, acciones, índices. Nos dará valoraciones bastante precisas y nos dirá cuándo es mejor abrir y cerra una transacción. Eche un vistazo  al vídeo  (6:22), ¡contiene un ejemplo de procesamiento de una sola señal que ha amortizado el indicador! La mayoría de los tráders mejoran sus resultados comerciales durante l
FX Volume MT5
Daniel Stein
4.94 (17)
Obtenga su actualización diaria del mercado con detalles y capturas de pantalla a través de nuestro Morning Briefing aquí en mql5 y en Telegram ! FX Volume es el PRIMER y ÚNICO indicador de volumen que proporciona una visión REAL del sentimiento del mercado desde el punto de vista de un bróker. Proporciona una visión impresionante de cómo los participantes institucionales del mercado, como los brokers, están posicionados en el mercado Forex, mucho más rápido que los informes COT. Ver esta info
Introduciendo       Quantum Breakout PRO   , el innovador indicador MQL5 que está transformando la forma en que comercia con Breakout Zones. Desarrollado por un equipo de comerciantes experimentados con experiencia comercial de más de 13 años,       Desglose cuántico PRO       está diseñado para impulsar su viaje comercial a nuevas alturas con su innovadora y dinámica estrategia de zona de ruptura. El indicador de ruptura cuántica le dará flechas de señal en las zonas de ruptura con 5 zonas
Trend Forecaster
Alexey Minkov
5 (6)
The Trend Forecaster indicator utilizes a unique proprietary algorithm to determine entry points for a breakout trading strategy. The indicator identifies price clusters, analyzes price movement near levels, and provides a signal when the price breaks through a level. The Trend Forecaster indicator is suitable for all financial assets, including currencies (Forex), metals, stocks, indices, and cryptocurrencies. You can also adjust the indicator to work on any time frames, although it is recommen
Elliott Wave Trend was designed for the scientific wave counting. This tool focuses to get rid of the vagueness of the classic Elliott Wave Counting using the guideline from the template and pattern approach. In doing so, firstly Elliott Wave Trend offers the template for your wave counting. Secondly, it offers Wave Structural Score to assist to identify accurate wave formation. It offers both impulse wave Structural Score and corrective wave Structure Score. Structural Score is the rating to sh
IVISTscalp5
Vadym Zhukovskyi
5 (5)
Te presentamos el indicador iVISTscalp5, que no solo es único sino también efectivo en operaciones de trading. Este indicador se basa en datos temporales y es el resultado de muchos años de experiencia y análisis profundo de los mercados financieros. El indicador iVISTscalp5 es una excelente herramienta para el trading manual. La conveniencia, simplicidad y visualización, toda la complejidad está oculta en su interior. Hemos simplificado al máximo la configuración y uso del indicador iVISTscalp5
Legacy of Gann for MT5
Pavel Zamoshnikov
5 (6)
The indicator very accurately determines the levels of the possible end of the trend and profit fixing. The method of determining levels is based on the ideas of W.D.Gann, using an algorithm developed by his follower Kirill Borovsky. Extremely high reliability of reaching levels (according to K. Borovsky  - 80-90%) Indispensable for any trading strategy – every trader needs to determine the exit point from the market! Precisely determines targets on any timeframes and any instruments (forex, met
Matrix Arrow Indicator MT5
Juvenille Emperor Limited
5 (14)
Matrix Arrow Indicator MT5   es una tendencia única 10 en 1 que sigue un indicador   100% sin repintado   de marcos temporales múltiples que se puede usar en todos los símbolos/instrumentos:   divisas ,   materias primas ,   criptomonedas ,   índices ,   acciones .  Matrix Arrow Indicator MT5  determinará la tendencia actual en sus primeras etapas, recopilando información y datos de hasta 10 indicadores estándar, que son: Índice de movimiento direccional promedio (ADX) Índice de canales de prod
If you want to find good trading opportunities, then you must trade near the Trend Line. This allows you to have a tighter         stop loss   on your trades — which improves your       risk to reward . But that’s not all… Because if you combine Trend Line with Support and Resistance, that’s where you find the best trading opportunities. Now you might wonder: “So when do I enter a trade?” Well, you can use reversal     candlestick patterns   (like the   Hammer, Bullish Engulfing, etc.) as your e
Market Overview MT5
Mehran Sepah Mansoor
Optimice sus decisiones de trading con nuestro indicador de fuerza y sentimiento del mercado y deje de operar contra tendencia! Diseñado meticulosamente para los operadores serios que valoran la información precisa y oportuna, nuestro indicador proporciona una vista de pájaro de los 28 pares principales de una manera muy sencilla. Esta herramienta es capaz de clasificar los pares de divisas basándose en términos de popularidad, fuerza de tendencia alcista o bajista y porcentaje de compradores y
Este es posiblemente el indicador de reconocimiento automático de formación de precios más completo que puede encontrar para la plataforma MetaTrader. Detecta 19 patrones diferentes, toma las proyecciones de Fibonacci tan en serio como usted, muestra la zona de reversión potencial (PRZ) y encuentra niveles adecuados de stop-loss y take-profit. [ Guía de instalación | Guía de actualización | Solución de problemas | FAQ | Todos los productos ] Detecta 19 formaciones de precios armónicos difer
Royal Scalping Indicator M5
Vahidreza Heidar Gholami
5 (8)
Royal Scalping Indicator is an advanced price adaptive indicator designed to generate high-quality trading signals. Built-in multi-timeframe and multi-currency capabilities make it even more powerful to have configurations based on different symbols and timeframes. This indicator is perfect for scalp trades as well as swing trades. Royal Scalping is not just an indicator, but a trading strategy itself. Features Price Adaptive Trend Detector Algorithm Multi-Timeframe and Multi-Currency Trend Low
Nuestro innovador   Panel Básico de Patrones de Velas   está diseñado específicamente para identificar patrones de velas rentables en el gráfico de forma automática. Este panel utiliza algoritmos avanzados para escanear los gráficos de precios en tiempo real y detectar una amplia gama de patrones de velas, desde los más clásicos hasta los más complejos. Además, tiene una interfaz fácil de usar que le permite visualizar los patrones detectados en diferentes marcos de tiempo, por lo que es fácil t
Otros productos de este autor
Format Charts MT4
Vital H B Engenharia Ltda
If you use several charts open at the same time, you know how boring it is to apply formats to each chart individually. This script can change all open charts using a single command. Parameters: 1 - Choose symbol to put on charts: apply the selected symbol to all charts. If "current", it does not change the symbol; 2 - Choose timeframe or leave empty: apply the selected timeframe to all charts. If "CURRENT", it does not change the timeframe; 3 - Apply template to the charts: If true, apply the t
FREE
Format Charts
Vital H B Engenharia Ltda
If you use several charts open at the same time, you know how boring it is to apply formats to each chart individually. This script can change all open charts using a single command. Parameters: 1 - Choose symbol to put on charts: apply the selected symbol to all charts. If "current", it does not change the symbol; 2 - Choose timeframe or leave empty: apply the selected timeframe to all charts. If "CURRENT", it does not change the timeframe; 3 - Apply template to the charts: If true, apply the t
FREE
53% OFF until December 31 (Normal price $125)! Don't miss the opportunity to have this invaluable tool!  This is a totally automated multi timeframe support and resistance levels finder on every MT4 chart. No manual work! Just drop this indicator on a chart and you will have the S/R levels always up to date. It is very convenient and helps the trader to anticipate possible stalls and reversions in price movements. The levels are displayed as lines and each timeframe has a different color. The
Filtro:
No hay comentarios
Respuesta al comentario