• Información general
  • Comentarios
  • Discusión

Institucional Pivot

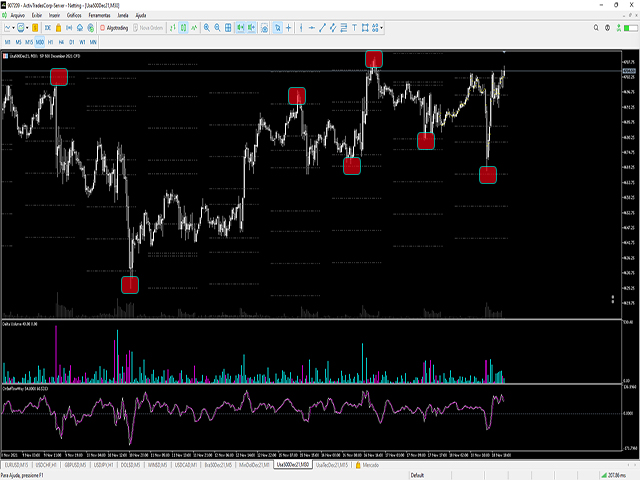
Institutional Pivot is a result of 5 years of research on order flow analysis in the Forex market and Nasdaq,

seeking mounting and defense positions. The one of the best support and resistance points you can have right now available to everyone.

You can opt for the Forex, CME and Brazilian markets

in the settings


Choosing the market just plot on the chart to make your trades

Productos recomendados
Four MA on OBV
Danton Dos Santos Sardinha Junior
Four MA on OBV - ¡Su Guía Definitiva para el Éxito en el Trading! Desbloquee el verdadero potencial de sus operaciones con el indicador Four MA on OBV . Diseñado exclusivamente para la plataforma MetaTrader 5, este potente indicador combina cuatro medias móviles con el On-Balance Volume (OBV) para proporcionar señales precisas y fiables. Características Técnicas: Cuatro Medias Móviles: Integración de medias móviles simples, exponenciales, suavizadas y lineales para un monitoreo detallado de l
Este indicador de marco de tiempo múltiple y de símbolo múltiple escanea en busca de formaciones envolventes y de pinzas. Combinado con sus propias reglas y técnicas, este indicador le permitirá crear (o mejorar) su propio sistema poderoso. Características Puede monitorear todos los símbolos visibles en su ventana Market Watch al mismo tiempo. Aplique el indicador a un solo gráfico y monitoree instantáneamente todo el mercado. Monitorea cada período de tiempo, desde M1 hasta MN, y le envía una a
Fight Zone
Tiago Viger Ortiz
Vertical bar chart of candles! What is it This indicator creates a vertical bar chart of all visible candles corresponding to the amount of candles that the bars cross. The goal of this indicator is to easily check the places or regions where the candles concentrate. Those regions are a good place to place positions because they have a increased chance of staying more time there again. It's hard to explain in words the exactly working of this indicator, we suggest you watch the video, it is o
Difícil de encontrar y escasa en frecuencia, las divergencias son uno de los escenarios comerciales más confiables. Este indicador busca y escanea las divergencias regulares y ocultas automáticamente usando su oscilador favorito. [ Guía de instalación | Guía de actualización | Solución de problemas | FAQ | Todos los productos ] Fácil de comerciar Encuentra divergencias regulares y ocultas Admite muchos osciladores bien conocidos Implementa señales comerciales basadas en rupturas Muestra nive
KT Tether Line MT5
KEENBASE SOFTWARE SOLUTIONS
The KT Tether Line is a trend-following tool consisting of three indicators that work together to generate trading signals. It can correctly identify market trends while signaling trade entries. It was first introduced by Bryan Strain in the Stock & Commodities magazine in 2000 in "How to get with the trend and out at the end." The Concept When a market trend is confirmed, the most challenging part is determining the timing of the entries. This indicator alerts you to potential trend reversals
Moving Average Crossover Scanner and Dashboard For MT5 Advanced Moving Average Scanner Moving Averages Crossover Dashboard MT4 Version of the product can be downloaded:  https://www.mql5.com/en/market/product/69260 The indicator scans the market and sends signals and alerts for Moving Average crossovers, death cross and golden cross. Crossovers are one of the main moving average ( MA ) strategies. MA Crossover ( cut ) strategy is to apply two moving averages to a chart: one longer and one sho
Rush Point Histogram Continuity force indicator. Operation: After a breach of support or resistance of an asset, the trader can understand by reading the histogram if such a move tends to continue, thus filtering false breaks or short breaks without trend formation. Through a simple, level-based reading, the trader can make a decision based on the histogram, where: Below 21: No trend formation 21 to 34: Weak trend 34 to 55: Strong Trend 55 to 89: Strong tendency Suggested Reading: Observed disru
Higher Time Frame Bars
Rajesh Kumar Nait
5 (1)
Este indicador rastrea eficientemente cualquier otra vela temporal que desee rastrear en el mismo gráfico. 1. Seleccione cualquier período de tiempo superior para cargar barras en el mismo gráfico. 2. Personaliza los colores y el estilo de los candelabros. 3. Elige el número de barras para dibujar velas. 4. Realice un seguimiento de las velas completas con períodos de tiempo más altos junto con la mecha y el cuerpo. 5. Fácil y conveniente para aquellos que no quieren cambiar de gráfico.
My Pivot
Ashok Kumar Singha
My Pivot is an Indicator based on Pivot Lines and Support-Resistance zones. This Indicator will Plot 11 SR zones including Pivot Line which will definitely help you to understand the exact SR zones of the Market. Steps to Setup the Indicator: Install the Custom Indicator; Set all the Lines Color, Width and Styles; Set visualization to All Timeframe; and DONE It can be used for: All Pairs: Forex, Cryptocurrencies, Metals, Stocks, Indices.  All Timeframe All Brokers All type of Trading S
KT Fisher Transform MT5
KEENBASE SOFTWARE SOLUTIONS
KT Fisher Transform is an advanced version of the original Fisher Transform oscillator equipped with divergence detection, crossover alerts, and many more features. Originally it was developed by John F. Ehlers. It converts the asset's price into a Gaussian normal distribution to find the local extremes in a price wave.  Features A light-weighted oscillator that efficiently identifies the upward and downward crossovers and marks them using vertical lines. It also finds regular and hidden diverg
Custom Timeframe MAs
Behnam Farnaghinejad
Overview: The Custom_Timeframe_MAs indicator for MetaTrader 5 lets you study different timeframes using M1 candles. It offers 12 moving average methods for analyzing trends. Why It's Useful: Versatile Timeframes: Even though MetaTrader has fewer timeframes, this indicator expands options by using M1 candles. Various Moving Averages: Choose from 12 moving average types: SMA, EMA, DEMA,TEMA,WMA, VWMA,SMMA, HullMA, LSMA, ALMA, SSMA, TMA, to understand price movements better. For Automated Trading
EURUSD Mastery: EA Tailored for Prop Firm Success on M15 Description: Introducing the ultimate EURUSD trading companion—an EA meticulously crafted for the 15-minute timeframe, engineered to surpass the rigorous evaluations of top proprietary firms like FTMO. Designed with precision and tested rigorously, this automated solution integrates advanced algorithms to optimize your trading performance. Key Features: - EURUSD Expertise: Specialized for the EURUSD currency pair, ideal for the dynamic
Este indicador de marco de tiempo múltiple e indicador de símbolo múltiple identifica patrones dobles superior / inferior, cabeza y hombro, banderín / triángulo y bandera. También es posible configurar alertas solo cuando se ha producido una ruptura del escote / triángulo / asta de bandera (ruptura del escote = señal confirmada para arriba / abajo y cabeza y hombros).       El indicador también se puede utilizar en modo de gráfico único. Lea más sobre esta opción en el producto   blog . Combinad
Hammer Star
Arkadii Zagorulko
This powerful tool is designed to help traders identify key reversal patterns in their charts, including the hammer and star bar formations. With this indicator, you can quickly and easily spot these patterns as they form, allowing you to make well-informed trades and potentially increase your profits. The Hammer Start indicator is customizable, allowing you to set your own parameters for identifying patterns and alerts. Whether you're a seasoned trader or just starting out, the Hammer and Star
Este indicador de marco de tiempo múltiple y símbolo múltiple identifica cuándo la línea de señal estocástica cruza la línea principal estocástica. Como alternativa, también puede alertar cuando el estocástico está saliendo (sin que la línea de señal cruce la línea principal) de un área de sobrecompra/sobreventa. Como beneficio adicional, también puede buscar bandas de Bollinger y cruces de sobrecompra/sobreventa RSI. Combinado con sus propias reglas y técnicas, este indicador le permitirá crear
A very good indicator for experienced and professional traders . A practical approach to trading. Easy to understand. A helping tool for traders looking for price movements . Signals: Signal Number 1: When yellow line which is a signal line  crossing the zero line  towards downward direction is  a selling opportunity. Signal Number 2: When yellow line which is a signal line  crossing the zero line  towards upward direction is  a buying opportunity.
Here I present you this awesome indicator I made. This is a nique combination witch puts you in the same level as MM's. So you can surf a lot of waves and identify the rally time, breakouts, and the perfect time to get in the market. ---- The SSL Channel is a great all-rounder based on 2 Simple Moving Averages, one of recent Highs, one of recent Lows. The calculation prints a   channel   on the chart consisting of 2 lines. This strategy gives a Long signal when price closes above the top of thes
The Expert Advisor and the video are attached in the Discussion tab . The robot applies only one order and strictly follows the signals to evaluate the indicator efficiency. Pan PrizMA CD Phase is an option based on the Pan PrizMA indicator. Details (in Russian). Averaging by a quadric-quartic polynomial increases the smoothness of lines, adds momentum and rhythm. Extrapolation by the sinusoid function near a constant allows adjusting the delay or lead of signals. The value of the phase - wave s
KT Horizontal Lines MT5
KEENBASE SOFTWARE SOLUTIONS
En MetaTrader, trazar múltiples   líneas horizontales   y luego hacer seguimiento de sus respectivos niveles de precio puede ser una tarea tediosa. Este indicador dibuja automáticamente varias líneas horizontales a intervalos iguales para establecer alertas de precio, marcar niveles de soporte y resistencia, y otros fines manuales. Este indicador es ideal para traders de Forex principiantes que buscan oportunidades para obtener ganancias rápidas comprando y vendiendo. Las líneas horizontales pue
Heat Map Pro mt5
Augusto Martins Lopes
Heat Map Indicator - Advanced Volume Analysis Introducing the Heat Map Indicator - A Professional Tool for Market Volume Analysis! **Key Features** **Visual Heat Map** - Instant volume intensity visualization through colors - Blue: Low volume - Green: Medium volume - Yellow/Orange: Increasing volume - Red: High volume **Intuitive Interface** - Dynamic color scale - Real-time percentage indicator - Current level indicator - Customizable colors and transparency **Smart Alert System** - Custo
The Rocket Trend indicator is trending. The indicator draws two-color points connected by lines along the chart. This is a trend indicator, it is an algorithmic indicator. It is easy to work and understand when a blue circle appears, you need to buy, when a red one appears, sell. The indicator is used for scalping and pipsing, and has proven itself well. Rocket Trend is available for analyzing the direction of the trend for a specific period of time. Ideal for novice traders learning the laws o
Jumping and Dumping Candles Detector Also known as Pumping and Dumping Candles Detector. Multi - timeframe. Scans historical candles. For MT5 program. With this amazing indicator, adopt your own strategy. Note: Share your strategy with us and we automate it. Check out my 98% win rate signal : https://www.mql5.com/en/signals/2278767?source=Site +Profile (Expired)
KT Market Structure MT5
KEENBASE SOFTWARE SOLUTIONS
1 (1)
The KT Market Structure intelligently detects and displays Break of Structure (BOS) , Change of Character (CHoCH) , Equal Highs/Lows (EQL) , and various significant  swing high/low points using our proprietary algorithm for accurate pattern detection. It also offers advanced pattern analysis by effectively demonstrating the captured profit for each pattern. A fully automated EA based on this indicator is available here: KT Market Structure EA MT5 Features Accurate Pattern Detection: Our advance
Indicador único que implementa un enfoque profesional y cuantitativo para el comercio de reversión a la media. Aprovecha el hecho de que el precio se desvía y vuelve a la media de manera predecible y medible, lo que permite reglas claras de entrada y salida que superan ampliamente las estrategias comerciales no cuantitativas. [ Installation Guide | Update Guide | Troubleshooting | FAQ | All Products ] Señales comerciales claras Sorprendentemente fácil de operar Colores y tamaños personalizables
This is a powerful multi cycle, multi currency pair, and multi indicator monitoring tool for MT5 version, with main functions including: 1. Monitor real-time performance of multiple indicators, including RSI, MACD, MA, and STO. 2. Monitor multiple currency pairs, customizable to add or delete currency pairs, and automatically update indicators. 3. Monitor multiple currency pairs over multiple cycles. 4. After clicking, you can directly switch to the chart and cycle you want to view. 5. Click th
Pivot Point Fibo RSJ es un indicador que rastrea las líneas de soporte y resistencia del día utilizando las tasas de Fibonacci. Este espectacular indicador crea hasta 7 niveles de soporte y resistencia a través del Pivot Point utilizando las tasas de Fibonacci. Es fantástico cómo los precios respetan cada nivel de este soporte y resistencia, donde es posible percibir posibles puntos de entrada / salida de una operación. Características Hasta 7 niveles de soporte y 7 niveles de resistencia Es
FREE
Cit VWAP Continuo
Mauricio Bornancin Cit
Apresentação:  - O Indicador "VWAP Contínua" da CIT Group é um indicador especializado na bolsa brasileira (B3). Objetivo:  - Especificamente desenvolvido para o perfil de pessoas que operam IntraDay. Funcionamento:  - Calculado com base nos trades realizados durante o pregão, sendo atualizado a cada 1 segundo, tendo maior precisão dos preços Funcionalidades:  - Entrega de até 5 VWAPs simultâneas, onde as 4 primeiras são configuráveis, e a última é fixa sendo a diária  - Opção para visualizar di
MTF Candles PRO
Renato Fiche Junior
1 (2)
Tool that allows viewing candles in multiple timeframes. This way, it helps the analysis in multiple timeframes. This is another product developed by Renato Fiche Junior and available to all MetaTrader 5 users! Input Parameters - Option 1 - TimeFrame: Standard MT5 timeframe - Option 2 - Custom TimeFrame (in minutes): Or, if this value is different from zero, the timeframe will be customized. This allows you to choose timeframe other than the MT5 standard. - Total Candles: Number of candles. -
¡Este indicador es un indicador para el análisis automático de ondas que es perfecto para practicar el trading real! Caso... Nota:   No estoy acostumbrado a usar nombres occidentales para clasificar las ondas. Debido a la influencia de la convención de nomenclatura de Tang Lun (Tang Zhong Shuo Zen), nombré la onda básica como   pluma   y la banda de onda secundaria como   segmento   . Al mismo tiempo, el segmento tiene la dirección de la tendencia. Se nombra   el segmento de tendencia principa
The Angle Prices indicator is a tool that calculates the price angle based on price analysis, interpreting the time vector in the form of price points on the price chart. In other words, the X axis and Y axis are represented as price points, so you can actually calculate the angle with two axes of the same dimension. This allows traders to obtain information about the direction of price movement and possible entry or exit points for trades. Let's look at the main characteristics and interpretat
Los compradores de este producto también adquieren
Divergence Bomber
Ihor Otkydach
5 (5)
Cada comprador de este indicador recibe adicionalmente y de forma gratuita: La utilidad exclusiva "Bomber Utility", que acompaña automáticamente cada operación, establece niveles de Stop Loss y Take Profit, y cierra operaciones según las reglas de la estrategia; Archivos de configuración (set files) para ajustar el indicador en diferentes activos; Archivos de configuración para el "Bomber Utility" en los modos: "Riesgo Mínimo", "Riesgo Balanceado" y "Estrategia de Espera"; Un manual en video pas
Golden Trend Indicator MT5
Noha Mohamed Fathy Younes Badr
4.89 (18)
Golden Trend indicator  is The best indicator for predicting trend movement this indicator never lags and never repaints and never back paints    and give  arrow buy and sell    before the candle appear  and it will help you and  will make your trading decisions clearer its work on all currencies and  gold and crypto and all time frame This unique  indicator uses very secret algorithms to catch the  trends, so you can trade using this indicator and see the trend clear on charts  manual guide and
Algo Pumping
Ihor Otkydach
5 (11)
PUMPING STATION – Tu estrategia personal "todo incluido" Te presentamos PUMPING STATION, un indicador revolucionario para Forex que transformará tu forma de operar en una experiencia emocionante y eficaz. No es solo un asistente, sino un sistema de trading completo con potentes algoritmos que te ayudarán a operar de forma más estable. Al comprar este producto, recibes GRATIS: Archivos de configuración exclusivos: para una configuración automática y un rendimiento óptimo. Manual en video paso a
TPSproTREND PrO MT5
Roman Podpora
4.72 (18)
VERSION MT4        —        ИНСТРУКЦИЯ RUS           —        INSTRUCTIONS  ENG Funciones principales: Señales de entrada precisas ¡SIN RENDERIZACIÓN! Si aparece una señal, ¡sigue siendo relevante! Esta es una diferencia importante con respecto a los indicadores de redibujo, que pueden proporcionar una señal y luego cambiarla, lo que puede provocar una pérdida de fondos depositados. Ahora puedes ingresar al mercado con mayor probabilidad y precisión. También existe la función de colorear las v
Quantum TrendPulse
Bogdan Ion Puscasu
5 (13)
Presentamos   Quantum TrendPulse   , la herramienta de trading definitiva que combina el poder de   SuperTrend   ,   RSI   y   Stochastic   en un indicador integral para maximizar su potencial de trading. Diseñado para traders que buscan precisión y eficiencia, este indicador le ayuda a identificar tendencias del mercado, cambios de impulso y puntos de entrada y salida óptimos con confianza. Características principales: Integración con SuperTrend:   siga fácilmente la tendencia predominante del
TPSpro RFI Levels MT5
Roman Podpora
4.55 (20)
Zonas de reversión / Volúmenes máximos / Zonas activas de un jugador importante =       SISTEMA TS TPSPRO INSTRUCCIONES RUS       /       INSTRUCCIONES       ESP       /           Versión MT4        Cada comprador de este indicador recibe adicionalmente GRATIS: 3 meses de acceso a señales comerciales del servicio RFI SIGNALS: puntos de entrada listos para usar según el algoritmo TPSproSYSTEM. Materiales de formación con actualizaciones periódicas: sumérgete en la estrategia y haz crecer tu niv
RelicusRoad Pro MT5
Relicus LLC
4.79 (19)
Ahora $ 147 (aumentando a $ 499 después de algunas actualizaciones) - Cuentas ilimitadas (PC o Mac) Manual de usuario de RelicusRoad + Videos de capacitación + Acceso al grupo privado de Discord + Estado VIP UNA NUEVA MANERA DE VER EL MERCADO RelicusRoad es el indicador comercial más poderoso del mundo para divisas, futuros, criptomonedas, acciones e índices, y brinda a los comerciantes toda la información y las herramientas que necesitan para mantenerse rentables. Brindamos análisis técnico
MetaBands M5
Vahidreza Heidar Gholami
4.5 (2)
MetaBands utiliza algoritmos potentes y únicos para dibujar canales y detectar tendencias para que pueda proporcionar a los traders puntos potenciales para entrar y salir de operaciones. Es un indicador de canal junto con un potente indicador de tendencia. Incluye diferentes tipos de canales que se pueden fusionar para crear nuevos canales simplemente utilizando los parámetros de entrada. MetaBands utiliza todos los tipos de alertas para notificar a los usuarios sobre eventos del mercado. Caract
MonetTrend — Премиум-индикатор для торговли по тренду (M30, H1, H4) MonetTrend — это мощный и визуально понятный трендовый индикатор, созданный для торговли на таймфреймах M30, H1 и H4. Он идеально подходит для работы с волатильными инструментами, такими как: • Золото (XAUUSD) • Криптовалюты (BTCUSD) • Валютные пары (EURUSD, USDJPY и др.) Ключевые особенности MonetTrend: • Автоматическое отображение Take Profit 1 (TP1) и Stop Loss (SL): После появления сигнала индикатор сразу показывает: • TP
Este es posiblemente el indicador de reconocimiento automático de formación de precios más completo que puede encontrar para la plataforma MetaTrader. Detecta 19 patrones diferentes, toma las proyecciones de Fibonacci tan en serio como usted, muestra la zona de reversión potencial (PRZ) y encuentra niveles adecuados de stop-loss y take-profit. [ Guía de instalación | Guía de actualización | Solución de problemas | FAQ | Todos los productos ] Detecta 19 formaciones de precios armónicos diferen
MONEYTRON – ТВОЙ ЛИЧНЫЙ СИГНАЛ НА УСПЕХ! XAUUSD | AUDUSD | USDJPY | BTCUSD Поддержка таймфреймов: M5, M15, M30, H1 Почему трейдеры выбирают Moneytron? 82% успешных сделок — это не просто цифры, это результат продуманной логики, точного алгоритма и настоящей силы анализа. Автоматические сигналы на вход — не нужно гадать: когда покупать, когда продавать. 3 уровня Take Profit — ты сам выбираешь свой уровень прибыли: безопасный, уверенный или максимум. Четкий Stop Loss — контролируешь риск
Blahtech Supply Demand MT5
Blahtech Limited
4.54 (13)
Was: $299  Now: $149  Supply Demand uses previous price action to identify potential imbalances between buyers and sellers. The key is to identify the better odds zones, not just the untouched ones. Blahtech Supply Demand indicator delivers functionality previously unavailable on any trading platform. This 4-in-1 indicator not only highlights the higher probability zones using a multi-criteria strength engine, but also combines it with multi-timeframe trend analysis, previously confirmed swings
Este tablero muestra los últimos   patrones armónicos   disponibles para los símbolos seleccionados, por lo que ahorrará tiempo y será más eficiente /   versión MT4 . Indicador gratuito:   Basic Harmonic Pattern Columnas del indicador Symbol:   aparecerán los símbolos seleccionados Trend :   alcista o bajista Pattern :   tipo de patrón (gartley, mariposa, murciélago, cangrejo, tiburón, cifrado o ABCD) Entry :   precio de entrada SL:   precio de stop loss TP1:   1er precio de toma de beneficios
Elliott Wave Trend was designed for the scientific wave counting. This tool focuses to get rid of the vagueness of the classic Elliott Wave Counting using the guideline from the template and pattern approach. In doing so, firstly Elliott Wave Trend offers the template for your wave counting. Secondly, it offers Wave Structural Score to assist to identify accurate wave formation. It offers both impulse wave Structural Score and corrective wave Structure Score. Structural Score is the rating to sh
MTF Supply Demand Zones MT5
Georgios Kalomoiropoulos
5 (1)
Próxima generación de zonas de oferta y demanda automatizadas. Algoritmo nuevo e innovador que funciona en cualquier gráfico. Todas las zonas se crean dinámicamente de acuerdo con la acción del precio del mercado. DOS TIPOS DE ALERTAS --> 1)CUANDO EL PRECIO LLEGA A UNA ZONA 2)CUANDO SE FORMA UNA NUEVA ZONA No obtienes un indicador inútil más. Obtiene una estrategia comercial completa con resultados probados.     Nuevas características:     Alertas cuando el precio llega a la zona de ofert
Este indicador es una herramienta de transacción única, de alta calidad y asequible porque hemos incorporado una serie de características propias y una fórmula secreta.   Con solo un gráfico, da Alertas para los 28 pares de divisas.   ¡Imagina cómo mejorarás porque puedes identificar el punto de activación exacto de una nueva tendencia u oportunidad de crecimiento! Basado en   nuevos algoritmos subyacentes , hace que sea aún más fácil identificar y confirmar   operaciones potenciales . Esto se d
IQ Gold Gann Levels a non-repainting, precision tool designed exclusively for XAUUSD/Gold intraday trading. It uses W.D. Gann’s square root method to plot real-time support and resistance levels, helping traders spot high-probability entries with confidence and clarity. William Delbert Gann (W.D. Gann) was an exceptional market analyst, whose trading technique was based on a complex blend of mathematics, geometry, astrology, and ancient mathematics which proved to be extremely accurate. Download
Este es un genial indicador para MT5 que ofrece señales precisas para entrar en una transacción sin redibujar. Se puede aplicar a cualquier activo financiero: fórex, criptomonedas, metales, acciones, índices. Nos dará valoraciones bastante precisas y nos dirá cuándo es mejor abrir y cerra una transacción. Eche un vistazo  al vídeo  (6:22), ¡contiene un ejemplo de procesamiento de una sola señal que ha amortizado el indicador! La mayoría de los tráders mejoran sus resultados comerciales durante l
Grabber System MT5
Ihor Otkydach
5 (6)
Te presento un excelente indicador técnico: Grabber, que funciona como una estrategia de trading "todo incluido" lista para usar. En un solo código se integran potentes herramientas de análisis técnico del mercado, señales de trading (flechas), funciones de alertas y notificaciones push. Cada comprador de este indicador recibe además de forma gratuita: Grabber Utility: una herramienta para la gestión automática de órdenes abiertas Video manual paso a paso: cómo instalar, configurar y operar con
Primero que todo, vale la pena enfatizar que este indicador de trading no repinta, no redibuja y no tiene retrasos, lo que lo hace ideal tanto para trading manual como algorítmico. Manual de usuario, ajustes preestablecidos y soporte en línea incluidos. AI Trend Pro Max es un sistema de trading sofisticado todo en uno, diseñado para traders que buscan precisión, potencia y simplicidad. Construido sobre años de desarrollo a través de indicadores anteriores, y esta es la versión más avanzada hast
Trend Forecaster
Alexey Minkov
5 (6)
The Trend Forecaster indicator utilizes a unique proprietary algorithm to determine entry points for a breakout trading strategy. The indicator identifies price clusters, analyzes price movement near levels, and provides a signal when the price breaks through a level. The Trend Forecaster indicator is suitable for all financial assets, including currencies (Forex), metals, stocks, indices, and cryptocurrencies. You can also adjust the indicator to work on any time frames, although it is recommen
Royal Scalping Indicator M5
Vahidreza Heidar Gholami
5 (6)
Royal Scalping Indicator is an advanced price adaptive indicator designed to generate high-quality trading signals. Built-in multi-timeframe and multi-currency capabilities make it even more powerful to have configurations based on different symbols and timeframes. This indicator is perfect for scalp trades as well as swing trades. Royal Scalping is not just an indicator, but a trading strategy itself. Features Price Adaptive Trend Detector Algorithm Multi-Timeframe and Multi-Currency Trend Low
Spot the Trend. Read the Pattern. Time the Entry. 3 Steps in Under 30 Seconds! Trade effortlessly — no analysis required, Your smart assistant is ready to simplify your workflow No more chart overload. Trade with confidence using smart bias detection. Compatible with all currencies, crypto, stocks, metals, indices, and any timeframe. Just click and execute — it’s that simple. deal for busy traders who want speed and clarity. TPTSyncX is a powerful all-in-one MetaTrader 5 indicator that seamles
MetaForecast M5
Vahidreza Heidar Gholami
5 (3)
MetaForecast predice y visualiza el futuro de cualquier mercado basándose en las armonías de los datos de precios. Aunque el mercado no siempre es predecible, si existe un patrón en el precio, MetaForecast puede predecir el futuro con la mayor precisión posible. En comparación con otros productos similares, MetaForecast puede generar resultados más precisos al analizar las tendencias del mercado. Parámetros de entrada Past size (Tamaño del pasado) Especifica el número de barras que MetaForecast
Kecia Footprint Orderflow
Niccolo Filippo Palombi
5 (1)
if you want to test it : private message me ( MT5 demo testing doesn't work ) Designed to help traders gain a deeper understanding of the market’s true order flow dynamics . By visualizing the “ footprints ” left by candles, this indicator reveals how the delta ( the difference between buying and selling pressure ) changes during the candle formation, as well as how volume fluctuates at different price levels. These insights are essential for traders seeking to identify reversals, breakouts, and
Volume by Price MT5
Brian Collard
3.25 (4)
Volume Profile, Footprint and Market Profile TPO (Time Price Opportunity). Volume and TPO histogram bar and line charts. Volume Footprint charts. TPO letter and block marker collapsed and split structure charts. Static, dynamic and flexible range segmentation and compositing methods with relative and absolute visualizations. Session hours filtering and segment concatenation with Market Watch and custom user specifications. Graphical layering, positioning and styling options to suit the user's a
FxaccurateLS
Shiv Raj Kumawat
WHY IS OUR FXACCCURATE LS MT5 THE PROFITABLE ? PROTECT YOUR CAPITAL WITH RISK MANAGEMENT Gives entry, stop and target levels from time to time. It finds Trading opportunities by analyzing what the price is doing during established trends. POWERFUL INDICATOR FOR A RELIABLE STRATEGIES We have made these indicators with a lot of years of hard work. It is made at a very advanced level. Established trends provide dozens of trading opportunities, but most trend indicators completely ignore them! The
CBT Quantum Maverick Sistema de Comercio de Opciones Binarias de Alta Eficiencia CBT Quantum Maverick es un sistema de opciones binarias de alto rendimiento diseñado para traders que buscan precisión, simplicidad y un enfoque disciplinado. No requiere personalización: el sistema está optimizado para resultados efectivos desde el primer momento. Simplemente sigue las señales, que se pueden dominar con un poco de práctica. Características clave: Precisión de señales: Señales basadas en la próxim
¡La mejor solución para cualquier operador novato o experto! Este indicador es una herramienta única, de alta calidad y asequible porque hemos incorporado una serie de características propias y una nueva fórmula. ¡Con sólo UN gráfico puede leer la Fuerza de la Divisa para 28 pares de Divisas! Imagínese cómo mejorará su operativa porque podrá señalar el punto exacto de activación de una nueva tendencia o de una oportunidad de scalping. Manual del usuario: haga   clic aquí Ese es el primero, ¡
IVISTscalp5
Vadym Zhukovskyi
5 (6)
Te presentamos el indicador iVISTscalp5, que no solo es único sino también efectivo en operaciones de trading. Este indicador se basa en datos temporales y es el resultado de muchos años de experiencia y análisis profundo de los mercados financieros. El indicador iVISTscalp5 es una excelente herramienta para el trading manual. La conveniencia, simplicidad y visualización, toda la complejidad está oculta en su interior. Hemos simplificado al máximo la configuración y uso del indicador iVISTscalp5
Otros productos de este autor
Institucional Color Candle
Jean Jacques Huve Ribeiro
4.86 (7)
Idea extracted from the books by Anna Coulling and Gavin Holmes using Volume and Spread Analysis (VSA) techniques coupled with Al Brooks' expertise with Price Action these candles are magical, identify the exact moment   of the performance of the big players are acting in the market represented by the colors: 1) Red Candles we have an Ultra High activity, 2) Candles Orange we have a Very High Activity 3) Candles Yellow we have one High Activity 4) White Candles represent normal activity in
FREE
Simple Weis Wave
Jean Jacques Huve Ribeiro
3.67 (3)
One of the best tools for analyzing volume, Weis Wave was idelized by David Weis, to facilitate the reading of directional flow. For the VSA method disciples it is an evolution of the practices created by Richard Wycoff, facilitating a predictive reading of the market, always seeking an accumulation and distribution of the negotiated contracts. Cumulative wave volume  Range of wave ( removed) Average Wave volume Ref "Tim Ord lectures" ( removed)
FREE
Wave Box Market Frenquency
Jean Jacques Huve Ribeiro
4.75 (4)
Totally linked to the result of a movement and the duration he had. Its height records how many ticks the asset walked during a given movement, its width shows us the duration that movement had. Its configuration must be in line with the Weis Wave Indicator configuration to observe the movement force and can indicate a possible accumulation or distribution of the movement;
FREE
Simple Midas
Jean Jacques Huve Ribeiro
5 (2)
Initiated in 1995 by the physicist and technical analyst Paul Levine, PhD, and subsequently developed by Andrew Coles, PhD, and David Hawkins in a series of articles and the book MIDAS Technical Analysis: A VWAP Approach to Trading and Investing in Today's Markets.Latterly, several important contributions to the project, including new MIDAS curves and indicators, have been made by Bob English, many of them published in the book.
FREE
Vwap Bar
Jean Jacques Huve Ribeiro
5 (1)
VWAP BAR  It´s power full indicator of candle by candle when lined up   with greate analysis, you have great opportunity, finder defense candle. Is a good ideia from order flow method, now your meta trader 5   inside you time frame chart .   What is the Volume Weighted Average Price (VWAP)? The volume weighted average price (VWAP) is a trading benchmark used by traders that gives the average price a security has traded at throughout the day, based on both volume and price. It is important be
FREE
OrderFlowWay
Jean Jacques Huve Ribeiro
Indicator tested for 7 years with excellent results when used correctly An order flow tracking indicator when used at support and residence points simply shows the direction of the Big Players, validating good opportunities seek optimal risk-adjusted returns on their investments. Use when Flow line crossing at signal line after candle closed , works with absolutely everything
Filtro:
No hay comentarios
Respuesta al comentario