Perfect Trend Scanner
- Indicadores
- Elias Mtwenge
- Versión: 1.0
- Activaciones: 20
Disclaimer: There is no guaranteed profitability! Invest wisely.
The Perfect Trend Scanner is a trend following indicator which is designed to show you the direction of the current trend.
The aim is to assist you not to trade against the trend.
How it works.
- The indicator doesn't repaint.
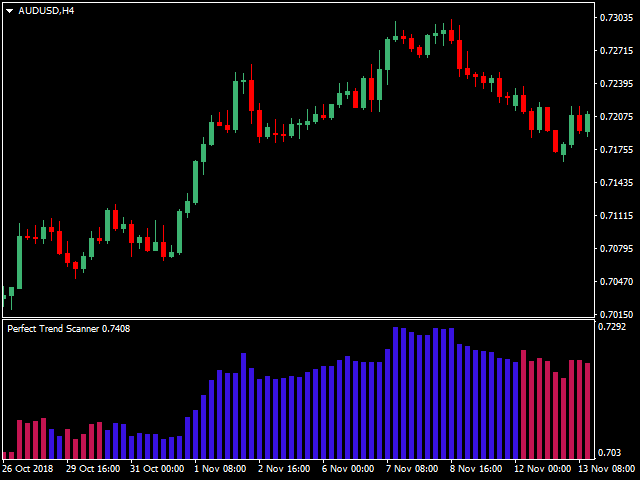
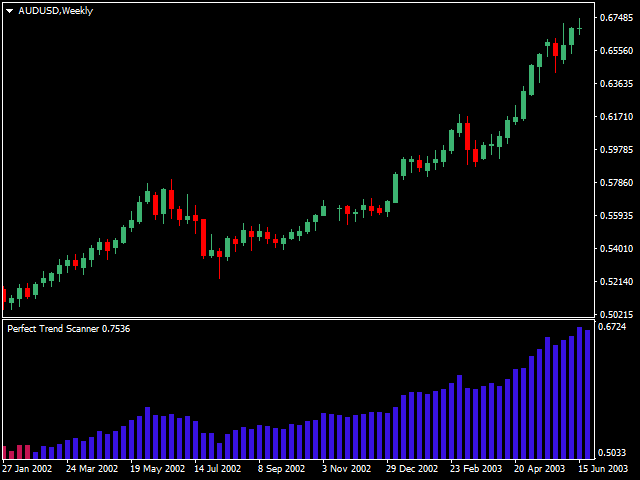
- The indicator works on all time-frames.
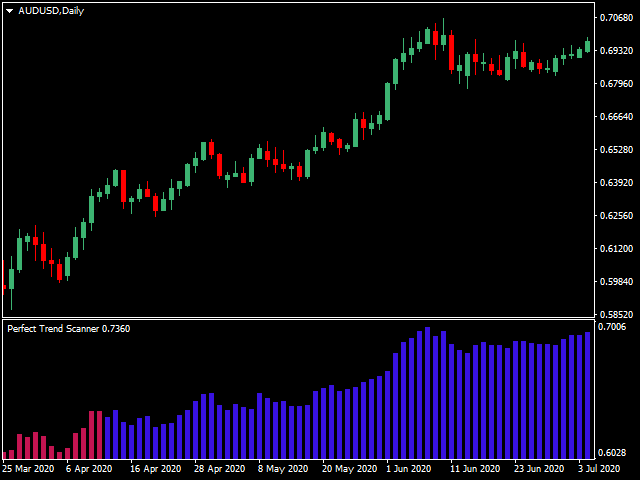
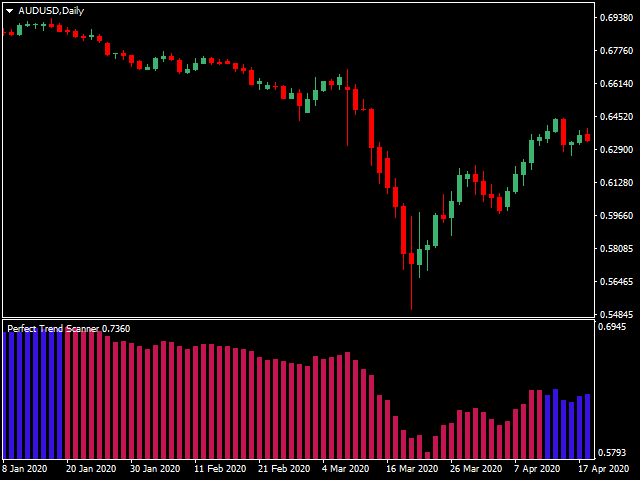
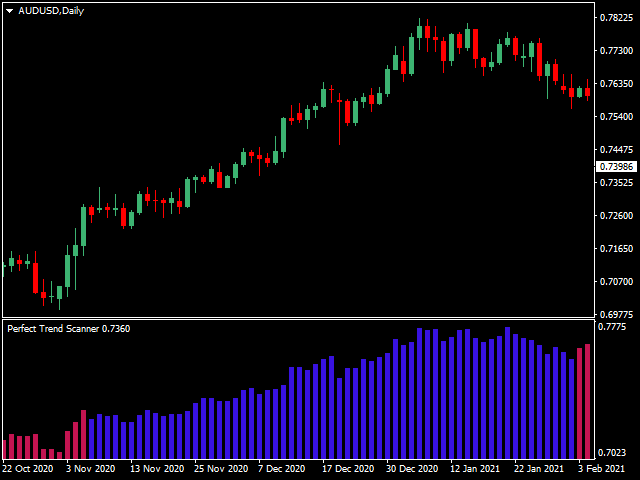
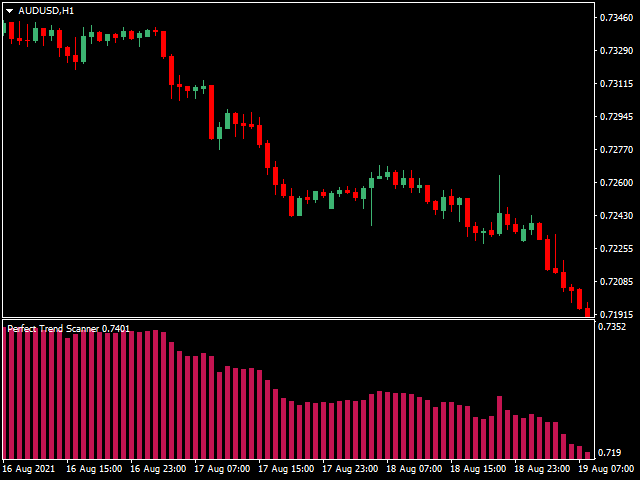
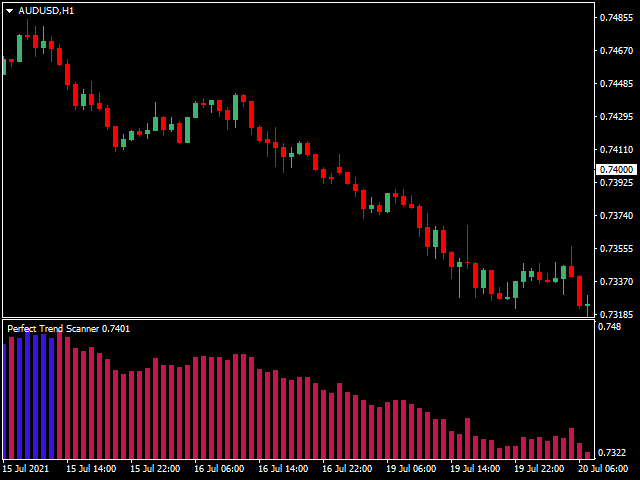
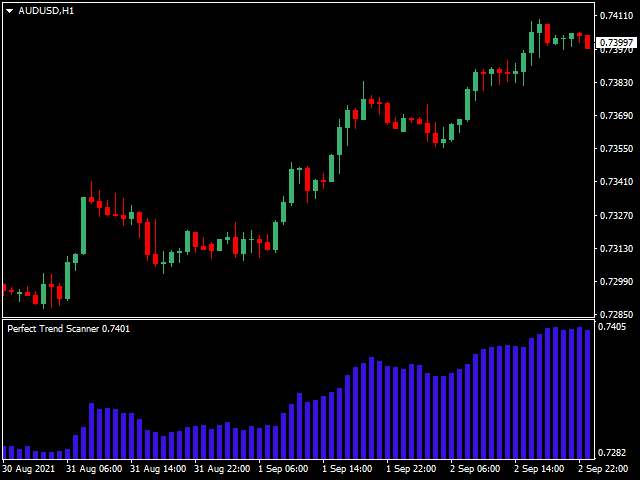
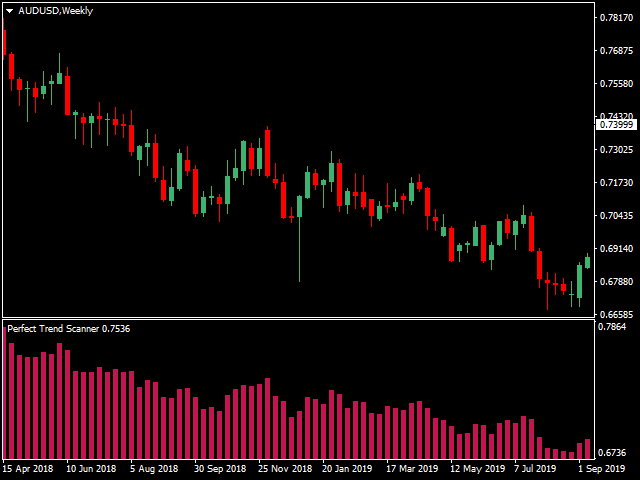
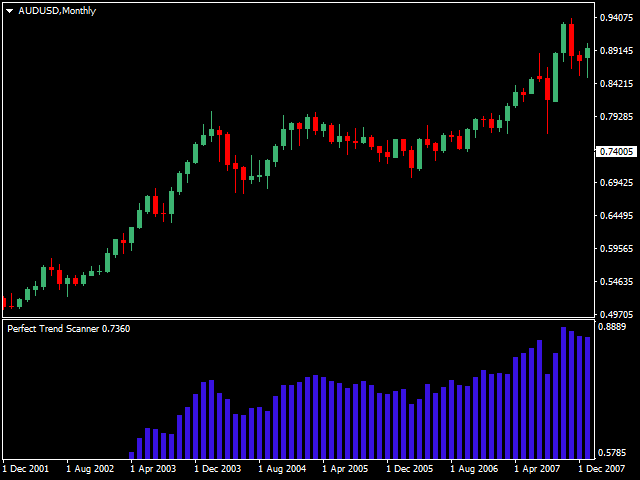
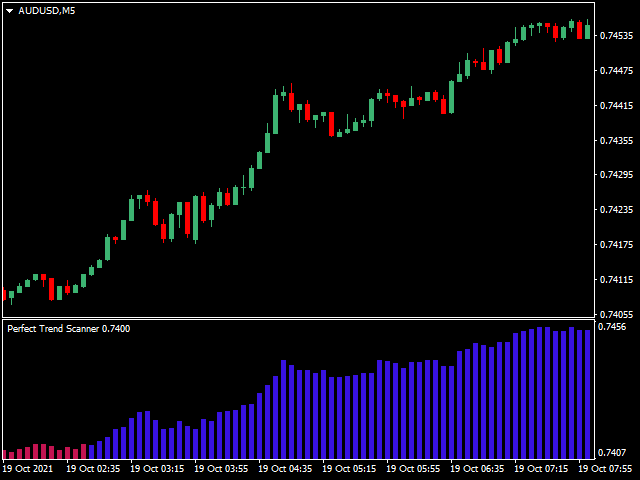
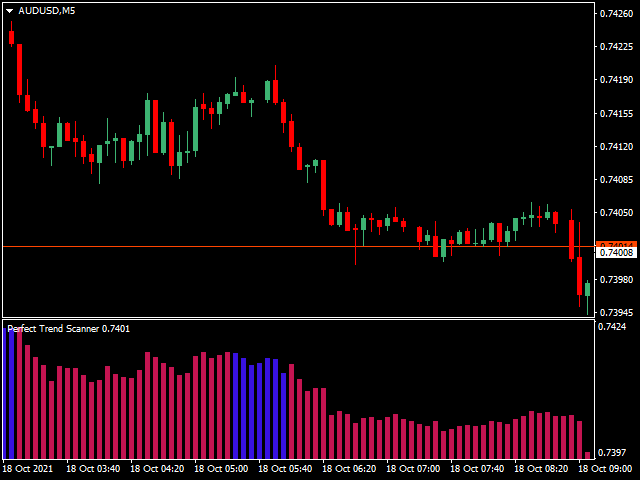
- The pink histograms indicate a bearish trend while the blue histograms indicates a bullish trend/signals.
- You can us this indicator in the top down market analysis approach.
- Generally we look to sell when the histograms are pink and when they are blue we look for buying opportunities.
- If the trend is very strong in one direction like in the the very strong bearish trend if we see few blue histograms and then after we see few pink histograms followed by pink ones we look for selling opportunities.
- If the trend is very strong in one direction like in the the very strong bullish trend if we see pink histograms and then after we see few blue histograms followed with blue ones we look for buying opportunities.
Last words.
Disclaimer: You are responsible for every financial decisions you make. The signals generated by this tool should not be used as a final trigger to making financial decisions. Use this tool wisely.
Thank you for considering this product.

