• Información general
  • Comentarios (4)
  • Discusión (3)
  • Novedades

Candle Time indicator

5

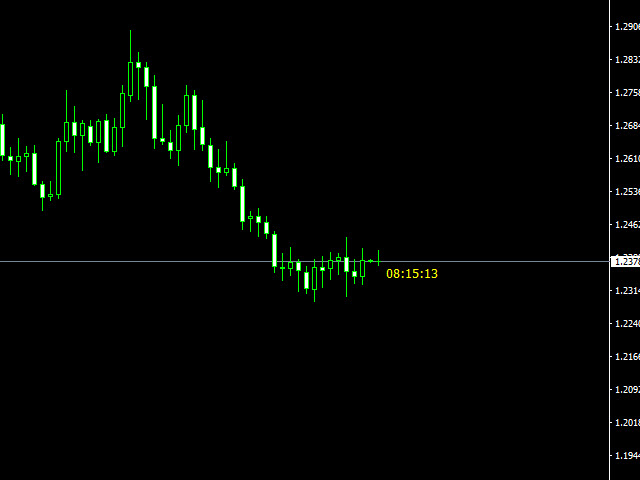
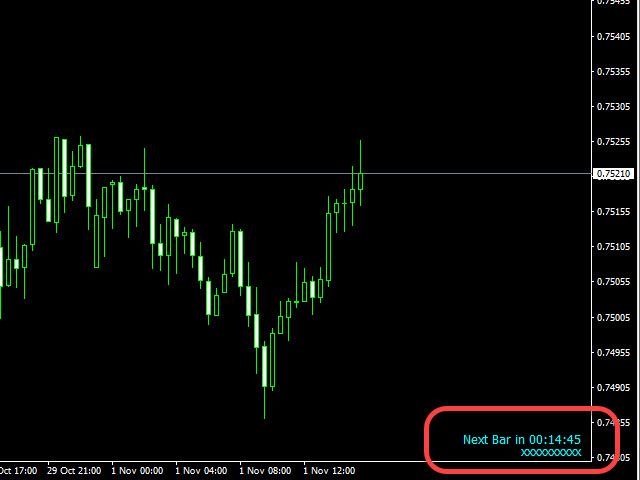
Sometimes a trader needs to know when a candle will close and a new one appears to make the right decisions, this indicator calculates and displays the remaining of current candle time .

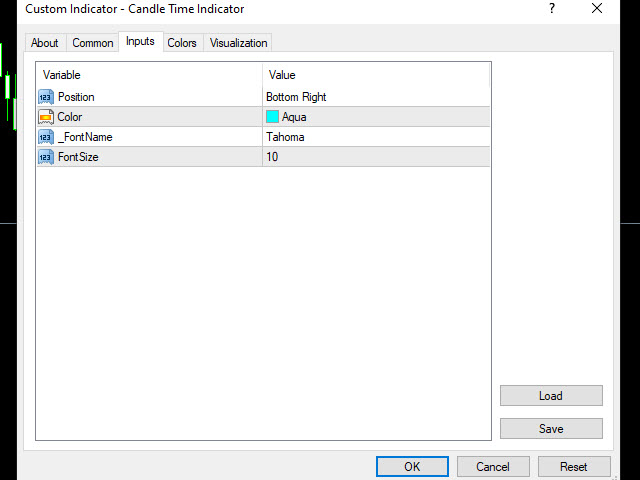
It is simple to use, just drag it on the chart.

Please use and express your opinion, expressing your opinions will promote the products.

To see other free products, please visit my page.


Comentarios 4
Nikodem Dobrzynski
215
Nikodem Dobrzynski 2023.03.15 17:45 
 

Nice , simple indicator . Mihails responded very quick . Five star.

Omar Adil Abdulateef Al Shaikhli
181
Omar Adil Abdulateef Al Shaikhli 2022.01.10 18:44 
 

جيد جدا شكرا لك سيدي

Productos recomendados
El Capturador de Tendencias: La Estrategia del Capturador de Tendencias con Indicador de Alerta es una herramienta versátil de análisis técnico que ayuda a los traders a identificar las tendencias del mercado y los posibles puntos de entrada y salida. Presenta una Estrategia dinámica del Capturador de Tendencias, adaptándose a las condiciones del mercado para una clara representación visual de la dirección de la tendencia. Los traders pueden personalizar los parámetros para que se ajusten a s
FREE
TrendPlus
Sivakumar Subbaiya
4.21 (14)
Trend Plus   Trendplus  Indicator   Time Frame: Suitable for any time frame.  Purpose: Trend Prediction. Blue and red candle indicate the buy and sell call respectively. Buy: When the blue candle is formed buy call is initiated. close the buy trades when the next red candle will formed.   Sell: When the Red candle is formed Sell call is initiated. close the Sell trades when the next blue candle will formed.   Happy trade!!
FREE
Show Pips
Roman Podpora
4.31 (70)
This information indicator will be useful for those who always want to be aware of the current situation on the account. The indicator displays data such as profit in points, percentage and currency, as well as the spread for the current pair and the time until the bar closes on the current timeframe. VERSION MT5 - More useful indicators There are several options for placing the information line on the chart: 1. To the right of the price (runs behind the price); 2. As a comment (in the up
FREE
Wicks UpDown Target GJ Wicks UpDown Target GJ is specialized in GJ forex pairs. Choppy movement up and down on the opening range every day.  Trading breakouts on London session and New York session is recommended. Guideline Entry Strategy Idea: Step 1 - Breakout Forming (Warning! Trade on London Session and New York Session) Step 2 - Breakout Starting (Take Action on your trading plan) Step 3 - Partial Close your order & set breakeven (no-risk) Step 4 - Target complete Step 5 - Don't tr
FREE
This indicator alerts you when/before new 1 or 5 minute bar candle formed. In other words,this indicator alerts you every 1/5 minutes. This indicator is especially useful for traders who trade when new bars formed. *This indicator don't work propery in strategy tester.Use this in live trading to check functionality. There is more powerful Pro version .In Pro version,you can choose more timeframe and so on. Input Parameters Alert_Or_Sound =Sound ----- Choose alert or sound or both to not
FREE
MegaTrends
Sivakumar Subbaiya
1 (1)
Megatrends  Indicator   Time Frame: Suitable for any time frame.  Purpose: Trend Prediction. Blue and red color indicate the buy and sell call respectively. Buy: When the blue line is originating it is opened buy call. Sell: When the Red line is origination it is opened sell call Happy trade!! this indicator is suitable for all time frame, but our recommended time frame to use 1hour and 4 hours, suitable for any chart.
FREE
This indicator shows the latest untouched support and resistance as horizontal lines. The indicator can show support/resistance from higher timeframes. With this indicator you can e.g. easily see the support/resistance of the timeframes H4, D1 and W1 on a H1 chart, which can be a big advantage while time your entry on H1. This is the FREE version of the indicator: Support Resistance Multi Time Frame The free version works only on EURUSD and GBPUSD! Parameters referenceTF: the timeframe from wh
FREE
Are you tired of drawing trendlines every time you're analyzing charts? Or perhaps you would like more consistency in your technical analysis. Then this is for you. This indicator will draw trend lines automatically when dropped on a chart. How it works Works similar to standard deviation channel found on mt4 and mt5. It has 2 parameters: 1. Starting Bar 2. Number of bars for calculation The   starting bar   is the bar which drawing of the trend lines will begin, while the   number of bars for c
FREE
Trend Ray
Andriy Sydoruk
The indicator shows the potential trend direction by cyclical-wave dependence. Thus, all the rays of the intersection will be optimal rays, in the direction of which the price is expected to move, taking into account the indicator period. Rays can be used as a direction for potential market movement. But we must not forget that the approach must be comprehensive, the indicator signals require additional information to enter the market.
Free automatic Fibonacci is an indicator that automatically plots a Fibonacci retracement based on the number of bars you select on the BarsToScan setting in the indicator. The Fibonacci is automatically updated in real time as new highest and lowest values appears amongst the selected bars. You can select which level values to be displayed in the indicator settings. You can also select the color of the levels thus enabling the trader to be able to attach the indicator several times with differe
FREE
Discover the power of precision and efficiency in your trading with the " Super Auto Fibonacci " MT4 indicator. This cutting-edge tool is meticulously designed to enhance your technical analysis, providing you with invaluable insights to make informed trading decisions. Key Features: Automated Fibonacci Analysis: Say goodbye to the hassle of manual Fibonacci retracement and extension drawing. "Super Auto Fibonacci" instantly identifies and plots Fibonacci levels on your MT4 chart, saving you tim
FREE
The indicator detects and displays М. Gartley's Butterfly pattern. The pattern is plotted by the extreme values of the ZigZag indicator (included in the resources, no need to install). After detecting the pattern, the indicator notifies of that by the pop-up window, a mobile notification and an email. The pattern and wave parameters are displayed on the screenshots. The default parameters are used for demonstration purposes only in order to increase the amount of detected patterns. Parameters
Pivot Point Fibo RSJ es un indicador que rastrea las líneas de soporte y resistencia del día utilizando las tasas de Fibonacci. Este espectacular indicador crea hasta 7 niveles de soporte y resistencia a través del Pivot Point utilizando las tasas de Fibonacci. Es fantástico cómo los precios respetan cada nivel de este soporte y resistencia, donde es posible percibir posibles puntos de entrada / salida de una operación. Características Hasta 7 niveles de soporte y 7 niveles de resistencia
FREE
OrderBlock TS Roman
Vladislav Vlastovskii
3.88 (8)
Индикатор строит блоки заказов (БЗ) по торговой системе (ТС) Романа. Поиск блоков осуществляется одновременно на двух таймфремах: текущем и старшем (определяемым в настройках). Для оптимизации и игнорирования устаревших блоков в настройках задается ограничение количества дней в пределах которых осуществляется поиск блоков. Блоки строятся по правилам ТС состоящем из трех шагов: какую свечу вынесли (что?); какой свечой вынесли (чем?); правило отрисовки (как?).
FREE
MASi Three Screens
Aleksey Terentev
5 (3)
MASi Three Screens is based on the trading strategy by Dr. Alexander Elder. This indicator is a collection of algorithms. Algorithms are based on the analysis of charts of several timeframes. You can apply any of the provided algorithms. List of versions of algorithms:     ThreeScreens v1.0 - A simple implementation, with analysis of the MACD line;     ThreeScreens v1.1 - A simple implementation, with analysis of the MACD histogram;     ThreeScreens v1.2 - Combines the first two algorithms
FREE
Rainbow MT4
Jamal El Alama
Rainbow MT4 is a technical indicator based on Moving average with period 34 and very easy to use. When price crosses above MA and MA changes color to green, it’s a signal to buy. When price crosses below MA and MA changes color to red, it’s a signal to sell. The Expert advisor ( Rainbow EA MT4) based on Rainbow MT4 indicator, as you can see in the short video below is now available here .
FREE
TIbors Timer
Tibor Hartmut Sturm
Indikator zur klaren Anzeige im Metatrader Dieser Indikator wurde von mir Entwickelt damit die Anzeige der relevanten Parameter klar und deutlich im Chart auf einen Blick zu sehen ist.  Er dient zur Information und ist ohne Gewähr.  Folgende Parameter werden angezeigt: -   Der  Aktuelle Kurs - Das Aktuelle Handelspaar - Die Restzeit zur nächsten Kerzenbildung / Zum Abschluss der Aktuellen Kerze - Die Kontonummer des Handelskontos - Die Frei Verfügbare Margin - Die Margin auf 1 Lot - Der Akt
FREE
Power Trend Free
Yurij Kozhevnikov
5 (2)
Power Trend Free - the indicator shows the trend strength in the selected period. Input Parameters The indicator has three input parameters: Period - a positive number greater than one, it shows the number of candlesticks used for calculations. If you enter one or zero, there will be no error, but the indicator will not be drawn. Applied Price - the standard "Apply to:" set meaning data used for the indicator calculation: Close - Close prices; Open - Open prices; High - High prices; Low - Low
FREE
Trend arrow Indicator
NGUYEN NGHIEM DUY
3.23 (13)
Trend arrow Indicator is an arrow Indicator used as an assistant tool for your trading strategy. The indicator analyzes the standard deviation of bar close for a given period and generates a buy or sell signals if the deviation increases. It good to combo with Martingale EA to follow Trend and Sellect Buy Only/Sell Only for EA work Semi-Automatic. You can use this  Indicator with any EAs in my Products.
FREE
The Rayol Code Hour Interval Lines indicator was  designed to assist your trading experience.  It  draws the range of hours chosen by the user directly on the chart, so that it enables traders to visualize price movements during their preferred trading hours, providing  traders   a more comprehensive view of   price movements and market dynamics. This indicator allows the user to choose not only the Broker's time, but also the Local time. This way, the user no longer needs to calculate local ti
FREE
Toby Strategy Indicator
Ahmd Sbhy Mhmd Ahmd ʿYshh
The indicator rely on The Toby strategy >> The mother candle which is bigger in range than the previous six candles. A vertical line shows the last Toby Candle with the targets shown up and down. The strategy is about the closing price out of the range of the toby candle to reach the 3 targets..The most probable to be hit is target1 so ensure reserving your profits and managing your stop lose.
FREE
Wise Men Indicator demo
Bohdan Kasyanenko
3.67 (3)
The indicator displays signals according to the strategy of Bill Williams on the chart. Demo version of the indicator has the same features as the paid, except that it can work only on a demo account . Signal "First Wise Man" is formed when there is a divergent bar with angulation.  Bullish divergent bar - with lower minimum and closing price in the upper half. Bearish divergent bar - higher maximum and the closing price at the bottom half. Angulation is formed when all three lines of Alligat
FREE
PZ Pivot Points
PZ TRADING SLU
4.64 (14)
This indicator displays pivot points in the chart, including historical vales, and supports many calculation modes for Pivot Points and S/R levels.  [ Installation Guide | Update Guide | Troubleshooting | FAQ | All Products ] It plots historical levels for backtesting purposes It allows you to select the reference timeframe It implements different Pivot Point calculation modes It implements different SR calculation modes It implements customizable colors and sizes Calculation Modes The indi
FREE
ContiStat restricted - Free DEMO version of the ContiStat indicator Free version of the indicator is ment as DEMO of full paid version. Full functionality is available, however The indicator work only on M30 chart period . Find the ContiStat indicator for full functionality Brief description The ContiStat indicator calculate statistic frequency of green (up) and red (down) movement in the chart and determine movement dynamics (silver curve). There are two key parameters to understand the Cont
FREE
HMA Trend
Pavel Zamoshnikov
4.62 (84)
A trend indicator based on the Hull Moving Average (HMA) with two periods. The Hull Moving Average is an improved variant of the moving average, which shows the moment of trend reversal quite accurately. It is often used as a signal filter. Combination of two types of Hull Moving Averages makes a better use of these advantages: HMA with a slow period identifies the trend, while HMA with a fast period determines the short-term movements and signals in the trend direction. Features The movement
FREE
Ppr PA
Yury Emeliyanov
4.75 (4)
"Ppr PA" is a unique technical indicator created to identify "PPR" patterns on the currency charts of the MT4 trading platform. These patterns can indicate possible reversals or continuation of the trend, providing traders with valuable signals to enter the market. Features: Automatic PPR Detection:   The indicator automatically identifies and marks PPR patterns with arrows on the chart. Visual Signals:   Green and red arrows indicate the optimal points for buying and selling, respectively. A
FREE
Following
Vladimir Perervenko
5 (1)
"Follow the Market Desire" . The indicator shows the market "Desire" (force) on the current and the higher timeframe (TF), indicates the current and confirmed targets, identifies and shows the resistance (Res) and support (Sup) lines of the current and/or older TF. Not always the Desire on a TF coincides with the possibility (real price movement), but the confirmed target is always achieved in the following "lives". Not always neighboring TFs have identical Desires. Every TF lives its own life,
The indicator detects and displays 3 Drives harmonic pattern (see the screenshot). The pattern is plotted by the extreme values of the ZigZag indicator (included in the resources, no need to install). After detecting the pattern, the indicator notifies of that by a pop-up window, a mobile notification and an email. The indicator highlights the process of the pattern formation and not just the complete pattern. In the former case, it is displayed in the contour triangles. After the pattern is com
Market Profile 3
Hussien Abdeltwab Hussien Ryad
4 (4)
Market Profile 3 MetaTrader 4 indicator  — is a classic Market Profile implementation that can show the price density over time, outlining the most important price levels, value area, and control value of a given trading session. This indicator can be attached to timeframes between M1 and D1 and will show the Market Profile for daily, weekly, monthly, or even intraday sessions. Lower timeframes offer higher precision. Higher timeframes are recommended for better visibility. It is also possible t
FREE
Tipu Heikin Ashi Panel
Kaleem Haider
4.56 (25)
Tipu Heikin-Ashi Panel is the modified version of the original Heiken Ashi indicator published by MetaQuotes here . A professional version of this indicator is available here . Features An easy to use Panel that shows the Heiken Ashi trend of selected timeframe. Customizable Buy/Sell alerts, push alerts, email alerts, or visual on-screen alerts. Customizable Panel. The panel can be moved to any place on the chart or minimized to allow more space. Heikin means "the average", and Ashi means "foo
FREE
Los compradores de este producto también adquieren
Gann Made Easy
Oleg Rodin
4.88 (97)
Gann Made Easy es un sistema de comercio de Forex profesional y fácil de usar que se basa en los mejores principios de comercio utilizando la teoría del Sr. W. D. Gann. El indicador proporciona señales precisas de COMPRA y VENTA, incluidos los niveles de Stop Loss y Take Profit. Puede comerciar incluso sobre la marcha utilizando notificaciones PUSH. ¡Por favor, póngase en contacto conmigo después de la compra! ¡Compartiré mis consejos comerciales con usted y excelentes indicadores de bonificació
Gold Stuff
Vasiliy Strukov
4.9 (269)
Gold Stuff: un indicador de tendencia diseñado específicamente para el oro, también se puede usar en cualquier instrumento financiero. El indicador no se vuelve a dibujar ni se retrasa. El marco de tiempo recomendado es H1. Este indicador está escrito por EA Gold Stuff Advisor, puede encontrarlo en mi perfil.  Puede obtener una copia gratuita de nuestro indicador Strong Support y Trend Scanner, por favor envíe un mensaje privado. ¡a mí! IMPORTANTE! Póngase en contacto conmigo inmediatamente d
Atomic Analyst
Issam Kassas
5 (3)
En primer lugar, vale la pena enfatizar que este Indicador de Trading no repinta, no redibuja y no se retrasa, lo que lo hace ideal tanto para el trading manual como para el automatizado. Manual del usuario: configuraciones, entradas y estrategia. El Analista Atómico es un Indicador de Acción del Precio PA que utiliza la fuerza y el impulso del precio para encontrar una mejor ventaja en el mercado. Equipado con filtros avanzados que ayudan a eliminar ruidos y señales falsas, y aumentan el poten
Trend Pulse
Mohamed Hassan
5 (4)
Please contact me after purchase to immediately get your PDF strategy + documentation for Trend Pulse !  Official release price of $89  ( 3 /50 copies left). Next price is $199 . Introducing Trend Pulse , a unique and robust indicator capable of detecting bullish, bearish, and even ranging trends! Trend Pulse uses a special algorithm to filter out market noise with real precision. If the current symbol is moving sideways, Trend Pulse will send you a ranging signal, letting you know that it
Scalper Inside PRO
Alexey Minkov
4.75 (60)
An exclusive indicator that utilizes an innovative algorithm to swiftly and accurately determine the market trend. The indicator automatically calculates opening, closing, and profit levels, providing detailed trading statistics. With these features, you can choose the most appropriate trading instrument for the current market conditions. Additionally, you can easily integrate your own arrow indicators into Scalper Inside Pro to quickly evaluate their statistics and profitability. Scalper Inside
Trend Punch
Mohamed Hassan
4.91 (22)
This indicator is unstoppable when combined with our other indicator called  Support & Resistance . After purchase, send us a message and you will get it   for  FREE as a BONUS! Introducing Trend Punch , the revolutionary forex trend indicator that will transform the way you trade! Trend Punch is uniquely designed to provide precise buy and sell arrows during strong market trends, making your trading decisions clearer and more confident. Whether you're trading major currency pairs or exotic sym
ACTUALMENTE 26% DE DESCUENTO ¡La mejor solución para cualquier operador novato o experto! Este indicador es una herramienta única, de alta calidad y asequible porque hemos incorporado una serie de características propias y una nueva fórmula. ¡Con sólo UN gráfico puede leer la Fuerza de la Divisa para 28 pares de Divisas! Imagínese cómo mejorará su operativa porque podrá señalar el punto exacto de activación de una nueva tendencia o de una oportunidad de scalping. Manual del usuario: haga
ACTUALMENTE 31% DE DESCUENTO Este indicador es una herramienta de transacción única, de alta calidad y asequible porque hemos incorporado una serie de características propias y una fórmula secreta. Con solo un gráfico, da Alertas para los 28 pares de divisas. ¡Imagina cómo mejorarás porque puedes identificar el punto de activación exacto de una nueva tendencia u oportunidad de crecimiento! Basado en nuevos algoritmos subyacentes , hace que sea aún más fácil identificar y confirmar operaciones po
PZ Day Trading
PZ TRADING SLU
3.67 (3)
Este indicador detecta reversiones de precios en forma de zig-zag, utilizando solo análisis de acción de precios y un canal donchian. Ha sido diseñado específicamente para el comercio a corto plazo, sin repintar ni pintar en absoluto. Es una herramienta fantástica para comerciantes astutos con el objetivo de aumentar el tiempo de sus operaciones. [ Guía de instalación | Guía de actualización | Solución de problemas | FAQ | Todos los productos ] Increíblemente fácil de comerciar Proporciona
Currency Strength Wizard es un indicador muy poderoso que le proporciona una solución todo en uno para operar con éxito. El indicador calcula el poder de este o aquel par de divisas utilizando los datos de todas las monedas en múltiples marcos de tiempo. Estos datos se representan en forma de índice de moneda fácil de usar y líneas eléctricas de moneda que puede usar para ver el poder de esta o aquella moneda. Todo lo que necesita es adjuntar el indicador al gráfico que desea operar y el indicad
Enigmera
Ivan Stefanov
5 (4)
ENIGMERA: El núcleo del mercado https://www.enigmera.com Introducción Este indicador y sistema de negociación es un enfoque extraordinario de los mercados financieros. ENIGMERA utiliza los ciclos fractales para calcular con precisión los niveles de soporte y resistencia. Muestra la auténtica fase de acumulación y proporciona dirección y objetivos.  Un sistema que funciona tanto si estamos en una tendencia como en una corrección.  ¿Cómo funciona? ENIGMERA consta de tres líneas: la línea de s
¡Actualmente 20% OFF ! ¡La mejor solución para cualquier novato o trader experto! Este software funciona con 28 pares de divisas. Se basa en 2 de nuestros principales indicadores (Advanced Currency Strength 28 y Advanced Currency Impulse). Proporciona una gran visión general de todo el mercado de divisas. Muestra los valores de Advanced Currency Strength, la velocidad de movimiento de las divisas y las señales para 28 pares de divisas en todos los (9) marcos temporales. Imagine cómo mejorar
Gold Channel is a volatility-based indicator, developed with a specific timing algorithm for the XAUUSD pair, which consists of finding possible corrections in the market. This indicator shows two outer lines, an inner line (retracement line) and an arrow sign, where the theory of the channel is to help identify overbought and oversold conditions in the market. The market price will generally fall between the boundaries of the channel. If prices touch or move outside the channel it is a tra
Order Block Hunter
Noha Mohamed Fathy Younes Badr
5 (1)
Order block hunter indicator is the best indicator for  hunt the order blocks that area where there has been a large concentration of limit orders waiting to be executed Order blocks are identified on a chart by observing previous price action and looking for areas where the price experienced significant movement or sudden changes in direction .This indicator does that for you by using very complicated codes and helps you to take the best areas To buy and sell because it make marks at the best a
FX Power MT4 NG
Daniel Stein
5 (12)
Obtenga su actualización diaria del mercado con detalles y capturas de pantalla a través de nuestro Morning Briefing aquí en mql5 y en Telegram ! FX Power MT4 NG es la nueva generación de nuestro popular medidor de fuerza de divisas, FX Power. ¿Y qué ofrece este medidor de fuerza de nueva generación? Todo lo que le encantaba del FX Power original PLUS Análisis de fuerza de ORO/XAU Resultados de cálculo aún más precisos Períodos de análisis configurables individualmente Límite de cálculo persona
Scalper Vault
Oleg Rodin
5 (29)
Scalper Vault es un sistema profesional de reventa que le brinda todo lo que necesita para una reventa exitosa. Este indicador es un sistema comercial completo que puede ser utilizado por operadores de divisas y opciones binarias. El marco de tiempo recomendado es M5. El sistema le proporciona señales de flecha precisas en la dirección de la tendencia. También le proporciona señales superiores e inferiores y niveles de mercado de Gann. Los indicadores proporcionan todo tipo de alertas, incluidas
Ante todo, vale la pena enfatizar que esta Herramienta de Trading es un Indicador No Repintado, No Redibujado y No Retrasado, lo que la hace ideal para el trading profesional. Curso en línea, manual del usuario y demostración. El Indicador de Conceptos de Acción del Precio Inteligente es una herramienta muy potente tanto para traders nuevos como experimentados. Combina más de 20 indicadores útiles en uno solo, combinando ideas avanzadas de trading como el Análisis del Trader del Círculo Interio
Advanced Supply Demand
Bernhard Schweigert
4.9 (314)
¡Actualmente con 33% de descuento! ¡La mejor solución para cualquier tráder principiante o experto! Este indicador es una herramienta comercial única, de alta calidad y asequible, porque incorpora una serie de características patentadas y una nueva fórmula. Con esta actualización, podrá mostrar zonas de doble marco temporal. No solo podrá mostrar un marco temporal más alto, sino también mostrar ambos, el marco temporal del gráfico MÁS el marco temporal más alto: MOSTRANDO ZONAS ANIDADAS. A todos
- Real price is 80$ - 40% Discount ( It is 49$ now ) Contact me for instruction, any questions! Introduction The breakout and retest strategy is traded support and resistance levels. it involves price breaking through a previous level.  The break and retest strategy is designed to help traders do two main things, the first is to avoid false breakouts. Many false breakouts start with a candlestick that breaks out of a level but ends with an immediate candlestick that brings the price back into t
¡LEA LA INFORMACIÓN A CONTINUACIÓN ANTES DE COMPRAR EL PRODUCTO! ¡Apollo Pips PLUS SP es un producto único! ¡ES PARA AQUELLOS QUE QUIEREN OBTENER MI NUEVO INDICADOR "APOLLO PIPS" MÁS BONO "SUPER PACK" CON ACCESO A TODOS MIS INDICADORES COMERCIALES! Al comprar el producto Apollo Pips PLUS SP, en realidad está comprando una versión absolutamente nueva de mi indicador Apollo Pips. Esta versión del indicador tiene un algoritmo mejorado y un parámetro fácil de usar que le brinda la oportunidad de uti
RelicusRoad Pro
Relicus LLC
4.73 (141)
Ahora $ 147 (aumentando a $ 499 después de algunas actualizaciones) - Cuentas ilimitadas (PC o Mac) Manual de usuario de RelicusRoad + Videos de capacitación + Acceso al grupo privado de Discord + Estado VIP UNA NUEVA MANERA DE VER EL MERCADO RelicusRoad es el indicador comercial más poderoso del mundo para divisas, futuros, criptomonedas, acciones e índices, y brinda a los comerciantes toda la información y las herramientas que necesitan para mantenerse rentables. Brindamos análisis téc
¡Descubra el secreto para el comercio de Forex exitoso con nuestro indicador MT4 personalizado! ¿Alguna vez se ha preguntado cómo lograr el éxito en el mercado de Forex, obteniendo ganancias constantemente al tiempo que minimiza el riesgo? ¡Aquí está la respuesta que ha estado buscando! Permítanos presentar nuestro indicador MT4 patentado que revolucionará su enfoque para el comercio. Versatilidad única Nuestro indicador está especialmente diseñado para usuarios que prefieren las formacio
Automated Trendlines
Georgios Kalomoiropoulos
5 (17)
Las líneas de tendencia son la herramienta más esencial del análisis técnico en el comercio de divisas. Desafortunadamente, la mayoría de los comerciantes no los dibujan correctamente. El indicador de líneas de tendencia automatizadas es una herramienta profesional para comerciantes serios que lo ayuda a visualizar el movimiento de tendencia de los mercados. Hay dos tipos de Trendlines Bullish Trendlines y Bearish Trendlines. En la tendencia alcista, la línea de tendencia de Forex se dib
M1 Arrow
Oleg Rodin
4.73 (15)
Una estrategia intradía basada en dos principios fundamentales del mercado. El algoritmo se basa en el análisis de volúmenes y ondas de precios utilizando filtros adicionales. El algoritmo inteligente del indicador da una señal solo cuando dos factores de mercado se combinan en uno. El indicador calcula ondas de cierto rango en el gráfico M1 utilizando los datos del marco de tiempo más alto. Y para confirmar la onda, el indicador utiliza el análisis por volumen. Este indicador es un sistema come
IX Power MT4
Daniel Stein
5 (6)
IX Power lleva por fin la insuperable precisión de FX Power a los símbolos que no son de Forex. Determina con exactitud la intensidad de las tendencias a corto, medio y largo plazo de tus índices, acciones, materias primas, ETF e incluso criptodivisas favoritas. Puede analizar todo lo que su terminal le ofrece. Pruébalo y experimenta cómo tu timing mejora significativamente a la hora de operar. Características principales de IX Power Resultados de cálculo 100% precisos y sin repintado -
Italo Trend Indicator
Italo Santana Gomes
4.79 (38)
BUY INDICATOR AND GET EA FOR FREE AS A BONUS + SOME OTHER GIFTS! ITALO TREND INDICATOR  is the best trend indicator on the market, the Indicator works on all time-frames and assets, indicator built after 7 years of experience on forex and many other markets. You know many trend indicators around the internet are not complete, does not help, and it's difficult to trade, but the Italo Trend Indicator is different , the Italo Trend Indicator shows the signal to buy or sell, to confirm the signal t
Break and Retest
Mohamed Hassan
4.12 (17)
This Indicator only places quality trades when the market is really in your favor with a clear break and retest. Patience is key with this price action strategy! If you want more alert signals per day, you increase the number next to the parameter called: Support & Resistance Sensitivity.  After many months of hard work and dedication, we are extremely proud to present you our  Break and Retest price action indicator created from scratch. One of the most complex indicators that we made with ove
Trend Screener
STE S.S.COMPANY
4.82 (93)
Indicador de tendencia, solución única e innovadora para el comercio y filtrado de tendencias con todas las funciones de tendencias importantes integradas en una sola herramienta. Es un indicador 100% sin repintar de marcos temporales y monedas múltiples que se puede usar en todos los símbolos/instrumentos: divisas, materias primas, criptomonedas, índices y acciones. Trend Screener es un indicador de seguimiento de tendencia eficiente que proporciona señales de tendencia de flecha con puntos en
ALERTA DE COMPRA Y VENTA MULTIDIVISA y MULTITIMEFRAME. ¡STOP DE TRAILING AUTOMÁTICO Y TOMA DE BENEFICIOS DE RECOMPENSA DE RIESGO! ¡EL INDICADOR ESCANEA Y ANALIZA EL MERCADO PARA QUE NO TENGAS NADA QUE HACER! ¡COMERCIA TODAS TUS MONEDAS EN 1 GRÁFICO!   Después de la compra, deje un comentario, contácteme y le enviaré el asistente comercial EA. El indicador utiliza varios osciladores y filtros adjuntos para encontrar los mejores puntos de entrada CONFIRMADOS, ¡así que no necesita preocupars
TPSpro RFI Levels
Roman Podpora
4.83 (24)
Reversal First Impulse levels (RFI)    INSTRUCTIONS        RUS       -       ENG              R ecommended to use with an indicator   -   TPSpro  TREND PRO -  Version MT5 A key element in trading is zones or levels from which decisions to buy or sell a trading instrument are made. Despite attempts by major players to conceal their presence in the market, they inevitably leave traces. Our task was to learn how to identify these traces and interpret them correctly. Main functions: Displaying activ
Otros productos de este autor
Contact me after payment  to send you the  User-Manual PDF  File. Volume Profile Indicator A functional and useful tool that can improve your trading plan. This indicator calculates volume in price levels(typical volume indicator shows only candle volumes). With the volume of price levels, you can identify important areas that have the potential to reverse. You can also see the volume of support and resistance levels and decide on them. Using volume profiles along with   Price Action   and
Greedy Green MT4
Mihails Babuskins
4.81 (94)
Contact me after payment to send you the user manual PDF file See the real monitoring signal in my profile. Real monitoring signals: Signal 1 Full Automated trading robot, for the first time on the market, an Expert Advisor is designed based on Volume Profile FR . Volume Profile FR  calculates volume in price levels (typical volume indicator shows only candle volumes). With the volume of price levels, you can identify important areas that have the potential to reverse. You can also see the volu
FREE
Greedy Red
Mihails Babuskins
4.34 (29)
Contact me after payment to send you the user manual PDF file See the real monitoring signal in my profile. Real monitoring signals: Signal 1 Greedy Red is an Expert Advisor is designed based on Volume Profile FR . Volume Profile FR  calculates volume in price levels (typical volume indicator shows only candle volumes). With the volume of price levels, you can identify important areas that have the potential to reverse. You can also see the volume of support and resistance levels and decide on
Contact me after payment to send you the user manual PDF file. Monitoring the EA in real time: Signal 1 Full Automated trading robot, for the first time on the market, an Expert Advisor is designed based on divergence. Using divergences is one of the most common and practical trading methods. Because we see a divergence in most places where there is potential for price return. Diagnosis and trading based on them has a higher efficiency than many methods based on static indicators. You can down
Volume Profile MT5
Mihails Babuskins
5 (3)
Contact me after payment to send you the User-Manual PDF File. Volume Profile Indicator A functional and useful tool that can improve your trading plan. This indicator calculates volume in price levels(typical volume indicator shows only candle volumes). With the volume of price levels, you can identify important areas that have the potential to reverse. You can also see the volume of support and resistance levels and decide on them. Using volume profiles along with   Price Action   and  
Quasimodo Pattern QM MT4
Mihails Babuskins
4.33 (45)
Contact me after payment to send you the User-Manual PDF File. ADVANCE PRICE ACTION TRADING CONCEPT. To test the indicator, you can download the demo version on my product list. it’s free (only shows patterns that have occurred in the past of the market). Quasimodo is  a reversal trading pattern  that appears at the end of an uptrend. As a price formation, the Quasimodo pattern is depicted by three peaks and two valleys, where: First, the middle peak is the highest, while the outside two peaks
Advance 123 Pattern Scanner
Mihails Babuskins
3.91 (11)
Contact me after payment to send you the User-Manual PDF File. How To Test You can test the indicator by free version, to get the free version please contact me   (  the free version scans charts in W1 and MN1 time-frames )  it's free. 123 Pattern Breakout Trend is your friend, trade along the trend, but how do we identify trends? Sometimes the simplest methods have the best results. Pattern 123 is based on the breakout important price levels, when the price is trying to break the previou
Contact me after payment to send you the user manual PDF file. Introduction Introducing the Wolfe Pattern Indicator, a powerful tool designed to help traders identify and capitalize on the elusive Wolfe Pattern in financial markets. This innovative indicator uses advanced algorithms to scan for the Wolfe Pattern in all symbols and time frames, providing traders with a unique edge in the market. How to trade with the Wolfe Pattern The Wolf Pattern is a rare and lucrative trading opportunity that
Important: Please use in accounts with lower swap or swap-free accounts. Real monitoring signals: Signal 1 Contact me after payment to send you the user manual PDF file See the real monitoring signal in my profile. Use only on gold and on the  BUY direction. Trading gold is attractive to many traders due to the high volatility and depth of the market. Should we invest in gold or just scalp it? Answering this question is a big challenge for many traders. X trading robot is the answer to this cha
Contact me after payment to send you the User-Manual PDF File. Triangle Pattern Sometimes the price cannot make higher highs or lower lows and it moves in a converging price range and waves are shorter than before until the movement creates a geometric shape of a symmetrical triangle, which indicates It is maybe the end of the trend. The triangle pattern is a well-known in forex and the trading plan and strategy of many traders is based on it. The Triangle Pattern Scanner Indicator It is
Calculator of Lot Size
Mihails Babuskins
4.73 (22)
Calculation of Lot Size for many traders is a big challenge. A case that is very important in money management. What many traders ignore. Choosing an appropriate Lot Size in trades can improve results and it will ultimately lead to success. This indicator calculates the authorized Lot Size for your trades. The indicator uses the following values to get the appropriate Lot Size for positioning: The distance of Stop Loss. The Pip Value. The amount of Risk Allowed For Each Trade. T
FREE
RSI Divergence Full
Mihails Babuskins
4.65 (37)
RSI Divergence Full   +10 other divergence indicators Contact me after payment to send you the User-Manual PDF File. Download the MT5 version here. Also you can download the >>>  Hybrid Trading EA  <<< that is designed and implemented based on RSI Divergence Indicator. RSI is a pretty useful indicator in itself but it's even more effective when you trade divergence patterns with that. Because the divergence signal of the RSI indicator is one of the most powerful signals among the indicators. D
Waves Follower
Mihails Babuskins
5 (1)
Contact me after payment to send you the User-Manual PDF File. This indicator gives a signal when the probability of starting a trend is high. To calculate entry points, it uses a combination of some indicators like "Moving Average", "ADX", RSI with support and resistance points. This indicator is a trend follower and it doesn't determine that TP because it is not necessary, it uses the stop-loss trailing system (Of course, the indicator determines the SL, but you have to move it yourself becau
harmonic patterns   Harmonic patterns can be used to spot new trading opportunities and pricing trends – but only if you know exactly what you are looking for. Harmonic patterns are formed by combining geometric shapes and Fibonacci levels. As a result, Fibonacci levels are the key concept of these patterns. Identifying harmonic patterns requires more practice than other market classical patterns. But by learning these patterns, you can recognize the future trend of the price chart. These patter
Greedy Purple
Mihails Babuskins
3.67 (3)
Contact me after payment to send you the user manual PDF file See the real monitoring signal in my profile. Real monitoring signals: Signal 1 Greedy Purple is an Expert Advisor is designed based on Ichimoku kinko hyo . Ichimoku is a trend detection indicator, the robot detects support and resistance levels by the Ichimoku indicator and trades based on it. Greedy Purple’s algorithmalso  uses divergence   to open trades and manage them with Ichimoku. You can download the  Divergence  Indicator 
See my other products here. One Click Order This product helps you to send your order as quickly and easily as possible. Send your order as fast as possible: Just set your position parameter values(Price, TP, SL, Ex Date) with just a few simple mouse drags. On the other hand, the calculation of the losses and profits value before ordering is always a big challenge for traders; This expert is very useful in taking a position and calculating the amount of the stop loss/the take profit(in the curr
FREE
RSI Signals Scanner
Mihails Babuskins
4.8 (5)
RSI Signal Scanner The primary trend of the stock or asset is an important tool in making sure the indicator's readings are properly understood. For example, some of the technical analysts, have promoted the idea that an oversold reading on the RSI in an uptrend is likely much higher than 30%, and an overbought reading on the RSI during a downtrend is much lower than the 70% level. This indicator notifies you of RSI important levels breakouts (30% and 70%) by searching among the symbols and chec
FREE
MACD Signals Dashboard
Mihails Babuskins
4 (4)
Download directly the indicator file here. (if you can't open on MT4) MACD Indicator is one of the most popular momentum indicators among users. Searching and detecting MACD signals by the eye may not be easy. Scan Full Charts Dashboard Indicator with simple user interface and search customization panel saves time and scans all charts for MACD signals search and notifies the user with high accuracy. After finding the signal, the user was aware of the result by alerts and notifications. This ind
FREE
Contact me after payment to send you the user manual PDF file. Introduction The moving average indicator is the most well-known and one of the most popular indicators among traders. It is very simple to work with, but a basic question has always become a big challenge among traders: What is the most optimal setting of the moving average for each chart-time frame? The answer to this question is very difficult, you have to try different settings of the moving average indicator for different chart
Contact me after payment to send you the User-Manual PDF File. Double Top/Bottom Pattern Double top and bottom patterns are chart patterns that occur when the underlying investment moves in a similar pattern to the letter "W" (double bottom) or "M" (double top). Double top and bottom analysis are used in technical analysis to explain movements in a security or other investment, and can be used as part of a trading strategy to exploit recurring patterns. Searching for this pattern among the c
Ichimoku Signal Scanner
Mihails Babuskins
4 (1)
Ichimoku Signals Dashboard To test the indicator please download demo version  here. Find Ichimoku signals as easy as you can. Ichimoku is one of the most powerful trends recognition indicators. And it has valid signals for the trades. This indicator scans several symbols and time-frames by the Ichimoku to find all the signals that you want and show in a dashboard. It's easy to use, just drag it onto the chart. It's better to add  Ichimoku indicator  to chart before adding this indicator. Ichimo
This utility manage your position risk by trailing stop with "Parabolic SAR" indicator value. Indicator Parameters SAR step(Parabolic SAR step value) SAR maximum(Parabolic SAR maximum value) Timeframes(Choose timeframes). Stop Place(put SL in current(open) candle or last close candle). Is the spread considered?(Set SL with considering to Spread or not, the choice is with you). Working with this utility is very simple, Just drag it onto the chart. There is no problem with multi-part trades. It is
FREE
MACD Divergence Full
Mihails Babuskins
5 (4)
Contact me after payment to send you the User-Manual PDF File. Divergence detection indicator with a special algorithm. Using divergences is very common in trading strategies. But finding opportunities for trading with the eyes is very difficult and sometimes we lose those opportunities. The indicator finds all the regular and hidden divergences. (RD & HD) It uses an advanced method to specify divergence. This indicator is very functional and can greatly improve the outcome of your trading. Thi
Currency Strength Gauge incicator The currency strength gauge is an indicator to measure of the strength or weakness of currencies in the Forex market. Comparing the strength of currencies in a graphic representation will lead to a good overview of the market and its future trends. You will see in a graphic chart both the strength of the currencies and their correlation, and this will help you in your decisions to get better trades.   -To easy detection of over Overbought and Oversold point
Contact me after payment to send you the User-Manual PDF File. Harmonic Trading The secret is the Fibonacci. It has been proven in the markets that price always reacts to Fibonacci levels. Fibonacci levels are one of the most important indicators of price changes. Sometimes the sequence of reactions to these levels in the chart make geometric shapes, which are called harmonic patterns. The price creates harmonic patterns with its fluctuation and reaction to Fibonacci levels. Harmonic patterns c
Pattern 5W Scanner
Mihails Babuskins
4.4 (10)
Contact me after payment to send you the User-Manual PDF File. 5W Pattern  introduction The 5W pattern occurs when the price forms an alternating 5-wave cycle with its volatility. In fact, the 5W  pattern is a price series of alternating HH or LL (higher high or lower low), which is the main characteristic of a trend. The pattern of 5W should have the characteristic of non-overlapping waves, also the points of the pattern are usually formed in Fibonacci levels. The completed pattern of 5W actua
Contact me after payment to send you the user manual PDF file See the real monitoring signal in my profile. Real monitoring signals: Signal 1 Full Automated trading robot, for the first time on the market, an Expert Advisor is designed based on  123 Breakout indicator . Breakout scanner   uses Fibonacci percentage to get PRZ(Price Reversal Zone)and opens trades. The Greedy Blue also uses   Volume Profile FR   to manage trades.  With the Volume of Profile the EA can identify important areas that
Contact me after payment to send you the user manual PDF file. Download the MT4 version here. Unlocking Trading Insights Dive into the heart of market dynamics with Advance Divergence Scanner designed for traders seeking a competitive edge. The Divergence Indicator is your key to identifying crucial divergences across various charts, empowering you to make informed decisions in the dynamic world of financial markets. The Divergence A Divergence signals a potential reversal point because directi
Filtro:
Nikodem Dobrzynski
215
Nikodem Dobrzynski 2023.03.15 17:45 
 

Nice , simple indicator . Mihails responded very quick . Five star.

Mihails Babuskins
71696
Respuesta del desarrollador Mihails Babuskins 2023.04.13 08:42
Thank you.
Mohd Syafiq
18
Mohd Syafiq 2022.02.27 16:50 
 

good indicator, tqvm

Mihails Babuskins
71696
Respuesta del desarrollador Mihails Babuskins 2022.02.27 23:16
you're welcome.
Omar Adil Abdulateef Al Shaikhli
181
Omar Adil Abdulateef Al Shaikhli 2022.01.10 18:44 
 

جيد جدا شكرا لك سيدي

Mihails Babuskins
71696
Respuesta del desarrollador Mihails Babuskins 2022.01.12 14:51
Thank you.
Lisema Shaale
18
Lisema Shaale 2021.12.20 19:41 
 

This indicator didn't work

Mihails Babuskins
71696
Respuesta del desarrollador Mihails Babuskins 2021.12.20 22:23
First, you should login to MetaTrader4, then download and run the indicator.
Simple and Easy :-)
Respuesta al comentario
Versión 1.2 2023.03.15
Some changes were made.