RSI Scanner Plus
- Indicadores
- Wartono
- Versión: 1.40
- Actualizado: 3 noviembre 2021
- Activaciones: 5
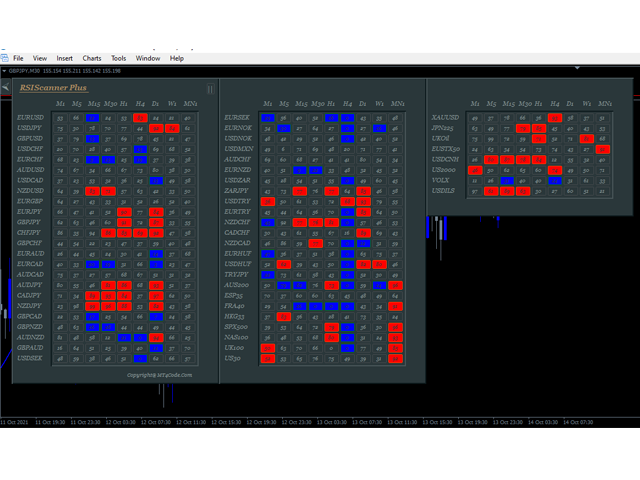
RSI Scanner Plus Indicator scans RSI values in multiple symbols and timeframes. Plus trend line buffer on the chart.
Features:
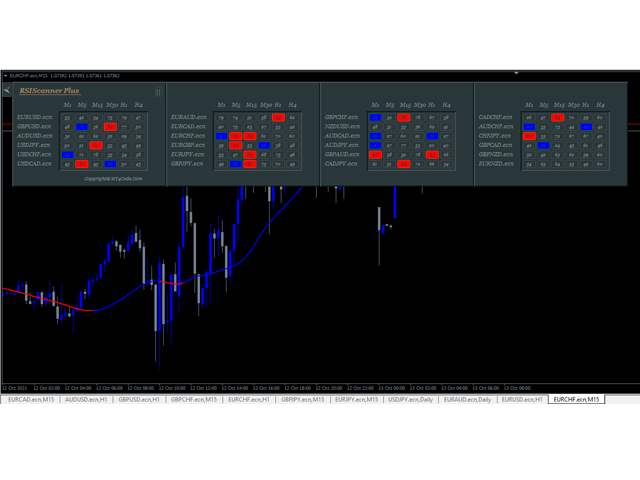
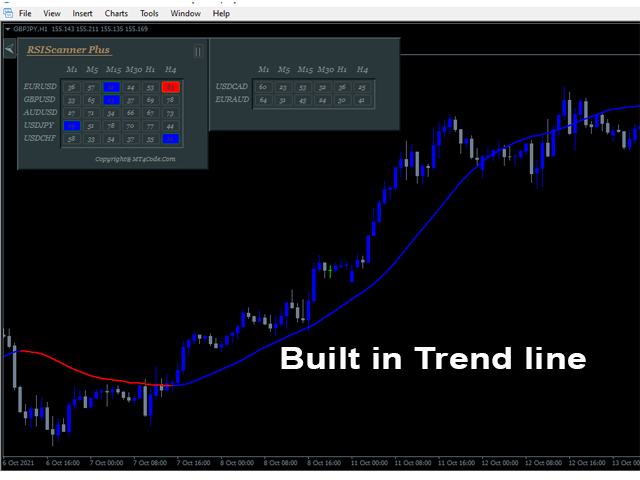
-Trend Line : We add trend line on the chart in the hope it help you to see current trend on the chart while following oversold and overbought from RSI. This is additional feature in the indicator. We consider that following the trend is very important in trading.
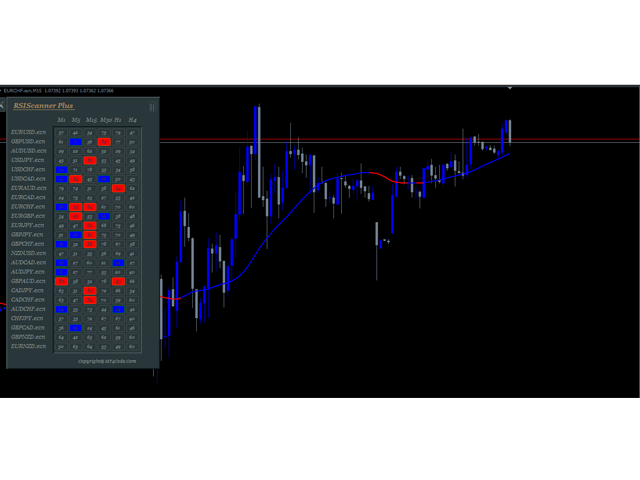
-Changeable Panel Display : Change the value of Max.Symbols/Panel and the indicator will adjust the dashboard display according to your input
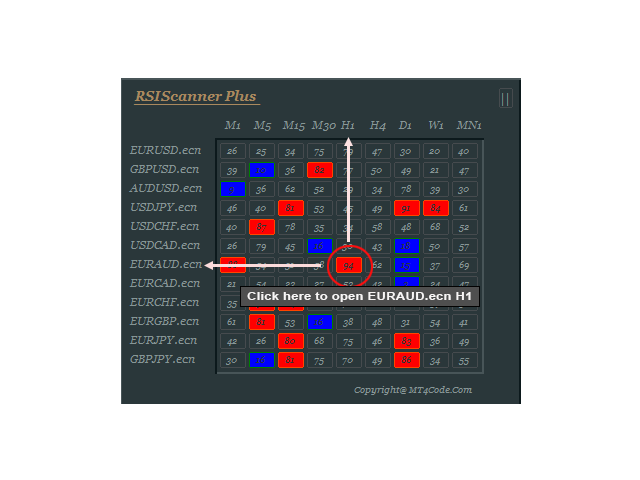
-Clickable Boxes: Click on the boxes to open appropriate Symbol and Timeframe. See image and video
- Hide/Show Dashboard: You can hide/show dashboard on the chart. In case you have some indicators in your chart and want to see them without being hindered by the dashboard then hide it. See button on the top left of the dashboard.
- Changeable color: If your setting , BUY color =Blue and SELL color = Red . Then Red color Boxes mean price in the appropriate symbol and timeframe is currently overbought and Blue oversold. Red line means downtrend and blue line means uptrend.
-RSI values: Values in the boxes are RSI values
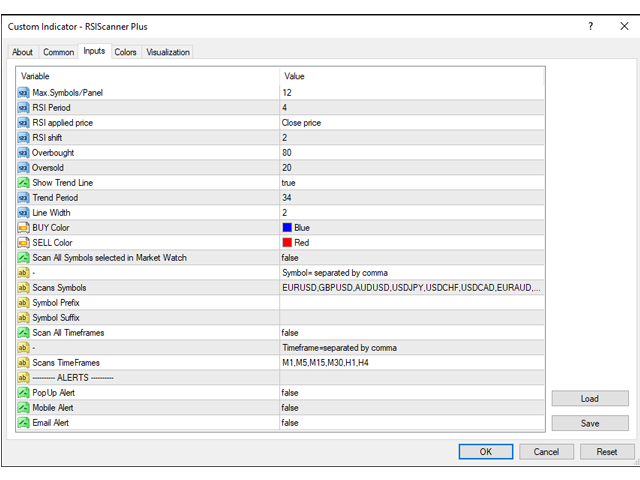
Parameter Setting
1. Max.Symbols/Panel = You can define the total symbols/panel here. the indicator will adjust the dashboard display according to your input.
2. RSI Period=RSI Period, default input 4
3. RSI applied price=RSI price,default PRICE CLOSE. You can change from dropdown menu.
4. RSI shift=This is bar shift where the RSI will be scanned as a value. Shift value is counted from right to left (Last to Past). And starting from value 0 that is current bar.
5. Overbought = The value of Overbought
6. Oversold= The value of OverSold
7. Show Trend Line = If true, Indicator will draw trend line in the current chart otherwise false.
8. Trend Period = Trend Period value.
9. Line Width = Trend Line Width
10. BUY Color = The color of Uptrend Line and Oversold boxes in the panel.
11. SELL Color = The color of Downtrend Line and Overbought boxes in the panel.
12. Scan All Symbols selected in Market Watch = If true, Indicator will ignore symbol inputs and scan all symbol in the market watch otherwise false.
13. Scans Symbols= If Scan All Symbols selected in Market Watch =false, make symbols input here. Separated by comma.
14. Symbol Prefix= This is the characters before symbol if available otherwise leave it blank
15. Symbol Suffix= This is the characters after symbol if available otherwise leave it blank. Example : EURUSD.ecn then you can fill in the column “.ecn” without quotes.
16. Scan All Timeframes = If true, Indicator will ignore Timeframe inputs and scan all timeframe from M1-Monthly, otherwise false.
17. Scans TimeFrames= If Scan All Timeframes = false, make timeframes input here.
18. Minimum Total TFs to alert/symbol = Alert only if minimum total TFs in the same signal is reached
19. PopUp Alert = If true and price is oversold or overbought, Indicator will Alert on the chart, otherwise false.
20. Mobile Alert = If true and price is oversold or overbought, Indicator will Alert on the mt4 mobile platform, otherwise false.
21. Email Alert = If true and price is oversold or overbought, Indicator will send email, otherwise false.
How To Trade
Maybe you already know some trading strategies using the RSI indicator. Whether it's , RSIScanner Plus will be helpful for you.
1. Higher Trend Lower RSI strategy
Trend line as a trend and RSI signal on the dashboard as an entry momentum, RSI as a retracement. The strategy is to trade by following the higher timeframe trend and entry when the price of lower/same timeframes are currently oversold or overbought.
Example:
Trendline on timeframe H1 is uptrend. RSI on lower/same timeframes of course H1 or lower (H1,M30,M15,M5,M1) is oversold then enter BUY order. Stoploss in lower price and takeprofit about 1 or 2 time of stoploss. In this case, more timeframes being oversold is better.
2. All Over strategy
If there are at least 3 timeframes currently oversold/overbought then enter a trade.
Example: Timeframe M1,M5,M15 oversold then enter Buy order.
2 strategies above is just for example of trading strategy using RSIScanner Plus. If you have your own RSI strategy then you can use it. Get RSI infos from RSIScanner Plus to help your trading.

