Flat finder MT4
- Indicadores
- Yuriy Lyachshenko
- Versión: 1.0
- Activaciones: 5
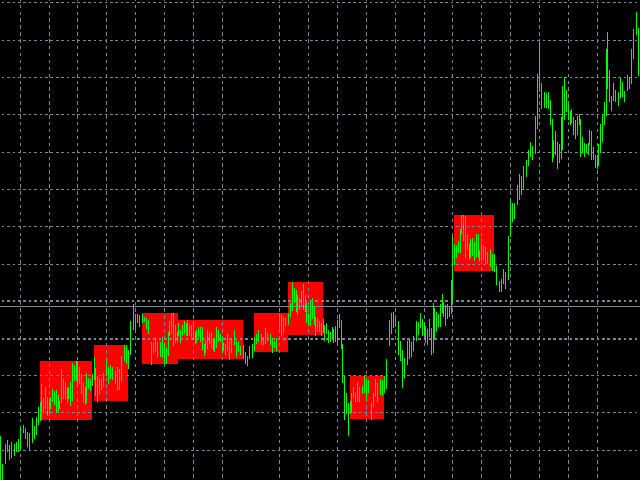
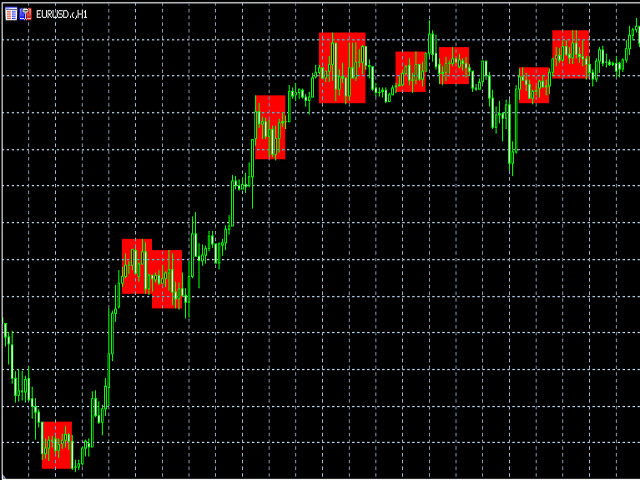
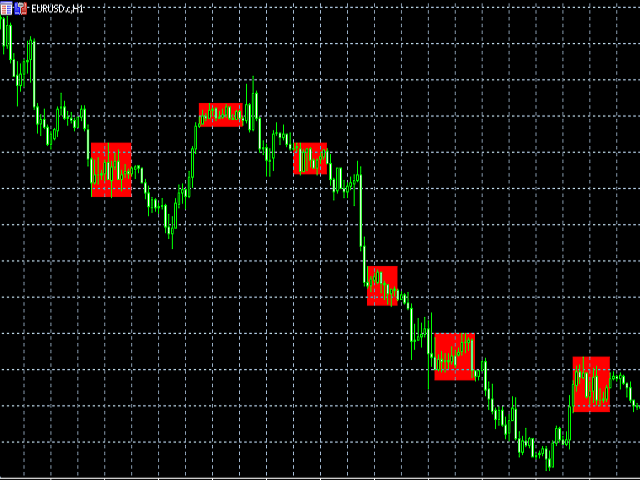
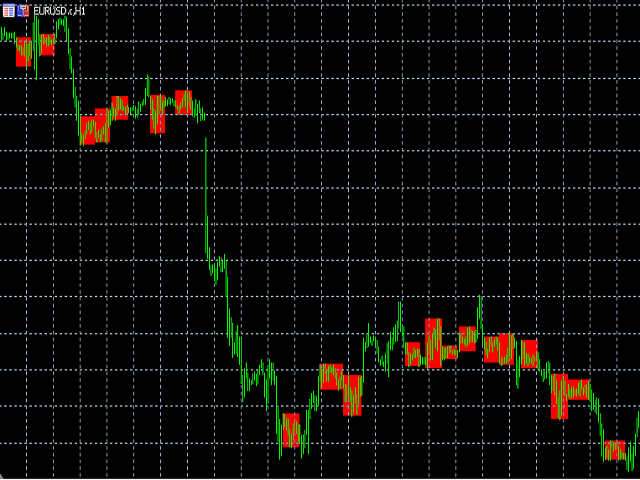
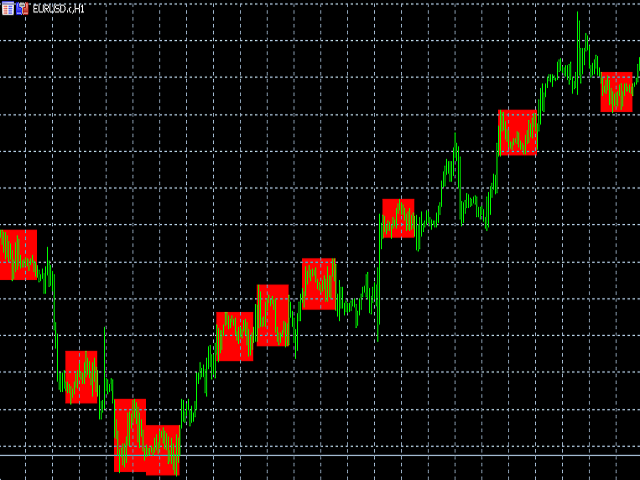
Este indicador detecta un flat y pinta el área encontrada con un rectángulo de color.
La idea principal de este indicador es detectar un piso cuando el precio llena un área determinada en el gráfico.
Parámetros de entrada:
Color rectangle - color del rectángulo a sombrear.
Bars in rectangle - número mínimo permitido de barras en un rectángulo.
Density in % - densidad del flat, establecida como un porcentaje del área del rectángulo.