Top and bottom patterns
- Indicadores
- Alexander Nikolaev
- Versión: 1.3
- Actualizado: 29 septiembre 2021
- Activaciones: 10
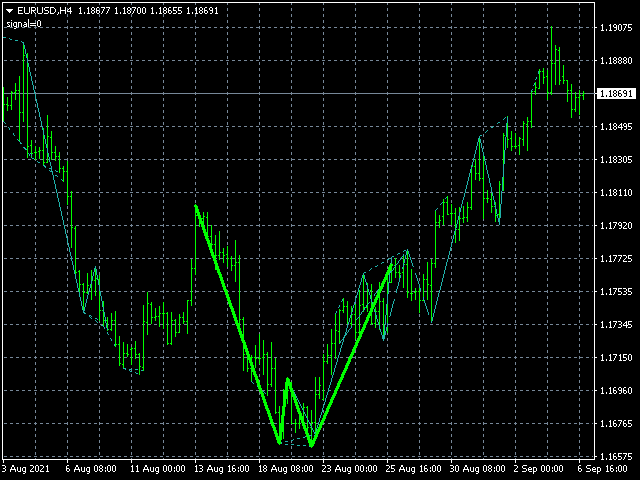
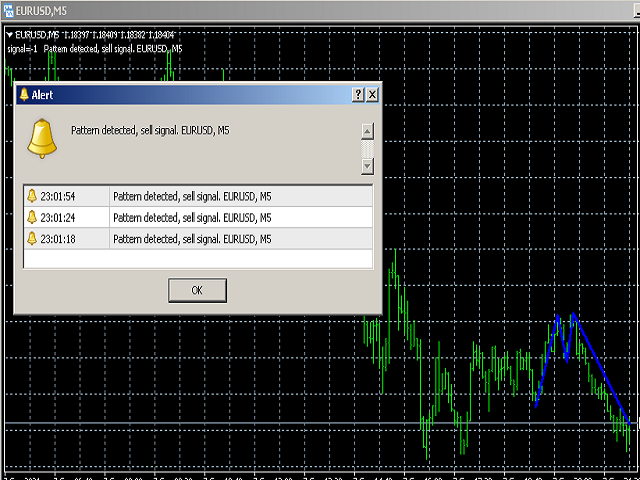
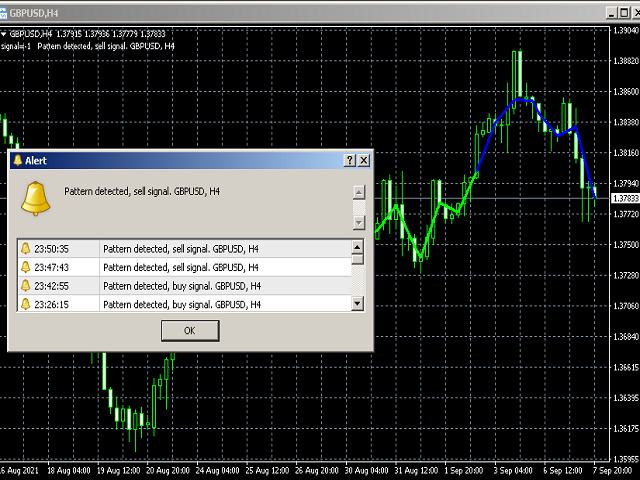
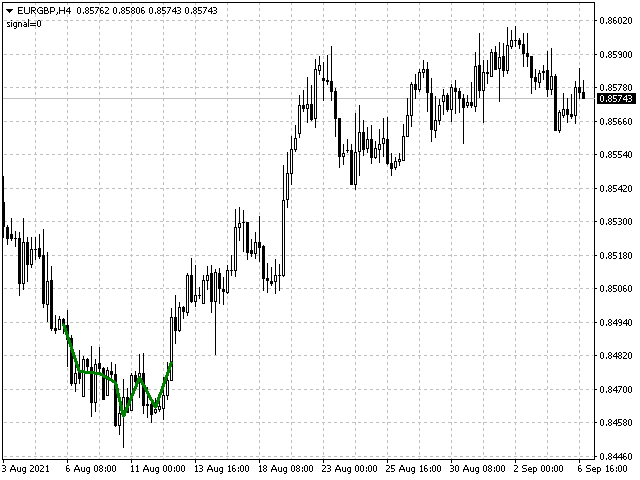
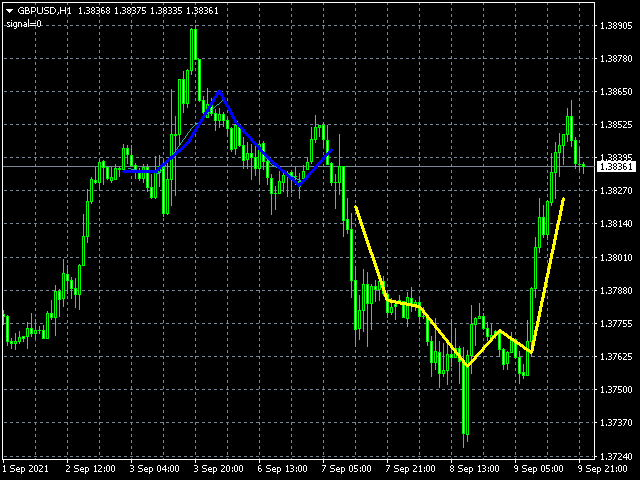
Este indicador encuentra patrones de inversión de análisis técnico como Double Bottom, Triple Bottom, Head & Shoulders y sus contrapartes opuestas. El indicador los muestra en el gráfico de un par de divisas y puede indicar a un comerciante si se ha formado un patrón recientemente. Esto le permite detectar rápidamente una posible reversión o corrección de tendencia, basta con agregar un indicador al gráfico, luego de eso, puede cambiar diferentes marcos de tiempo para encontrar rápidamente dichos patrones, si los patrones no se encuentran o, por el contrario, no se encuentran en los mejores lugares de la historia, puede cambiar los parámetros para una mejor visualización de un determinado par de divisas. Además, puede cambiar el color de las líneas de los patrones mostrados y habilitar la visualización de líneas de patrones no completamente formados.
Opciones
History: el número de barras para buscar patrones en el gráfico;
ExtremCountBars: el número de barras para buscar extremos, por ejemplo, máximos en el segundo pico (se recomienda 3-40);
MinExtremDist: el número mínimo de barras entre 2 extremos (se recomienda 2-12, cuanto mayor sea el valor, mayor será el tamaño del patrón encontrado);
MaxExtremDist: número máximo de barras entre 2 extremos (se recomienda de 10 a 50);
MultipleVerticesFilter - Filtrado para encontrar máximos o mínimos "extra" (si está habilitado, debe haber solo 2 máximos o mínimos);
PeriodMAforEdgeFiltering: filtrar los bordes de las formas de doble fondo y superior por MA para que haya una subida o bajada suave (0 - apagado, se recomienda 0-10);
PriceDeviationsParam - La desviación máxima del precio (dependiendo de la volatilidad) de un par de divisas de dos extremos (cuanto mayor sea este valor, más la figura puede resultar ser una curva, pero se encontrará con más frecuencia);
PriceChangeBefore: cuánto debe ser menor el valor del cambio de precio antes del patrón que el tamaño del patrón en sí (recomendado de 1 a 2.5);
MaxPriceStrengthAfterPattern - Un parámetro para aumentar (y disminuir) la divergencia máxima del precio del patrón (por ejemplo, 1.5 = 1.5 veces el tamaño del patrón);
SelfTuningParametersCount: el número de intentos de autoajuste de parámetros (cuántas veces se pueden cambiar los valores de los parámetros para buscar al menos 1 cifra, se recomienda 0-10, 0 - el autoajuste de parámetros está deshabilitado);
PeriodMAforHeadS: período de la media móvil para dibujar la figura "Cabeza y hombros" (y la versión invertida), 0: el patrón está desactivado, se recomienda 2-10 (cuanto mayor sea el valor, mayor será el tamaño del patrón encontrado). ser);
DrawUnfinishedPatterns: dibuja patrones sin terminar (líneas en el gráfico que muestran que se pudo haber formado un patrón);
EnableAlert: habilita las alertas cuando aparece un patrón y estalla;
AlertPeriodBars: el número de barras después de las cuales la alerta puede volver a aparecer;
MaximumFigureShiftForAlert: distancia máxima de la figura desde la barra actual para que aparezca la alerta;
NeutralLinesClr: color de las líneas neutrales (se muestra cuando el parámetro DrawUnfinishedPatterns está habilitado);
FinalBuyPatternClr: color de línea de la forma de compra completada;
FinalSellPatternClr: color de línea de la forma de venta completa.