Bifurcated Averages Analyzer
- Indicadores
- Kevin Peter Abate
- Versión: 1.1
- Actualizado: 6 septiembre 2021
a novel indicator by the maker of velvet.
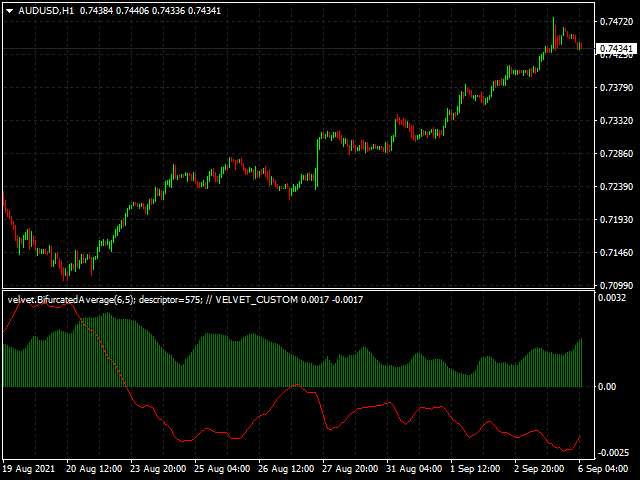
This indicator analyzes the differences between moving averages with averaging periods that increase exponentially to detect the direction of a trend and the volatility within that trend. The histogram displays the standard deviation and the position of the line versus time indicates the mean value of the differences between each subsequent averaging period. So the line indicates the degree of expectation for an equilibrium process to occur, so this is an indicator of bearishness, where negative values for the mean value of the differences indicate bullish expectations. The histogram, then is a measure of volatility within a trend.
The indicator will also reveal the parameters used to generate the graph via the indicator's short name using the Velvet compatibility protocol.
Acknowledgements:
Desmos Graphing Calculator (used to make the logo)
Combinatorics and Probability Theory for Trading (Part I): The Basics. (The explanations of some very advanced maths are clear and down to Earth here, even translated from Russian.)


El usuario no ha dejado ningún comentario para su valoración