RSI Color Candles with Moving Average
- Indicadores
- John Louis Fernando Diamante
- Versión: 1.0
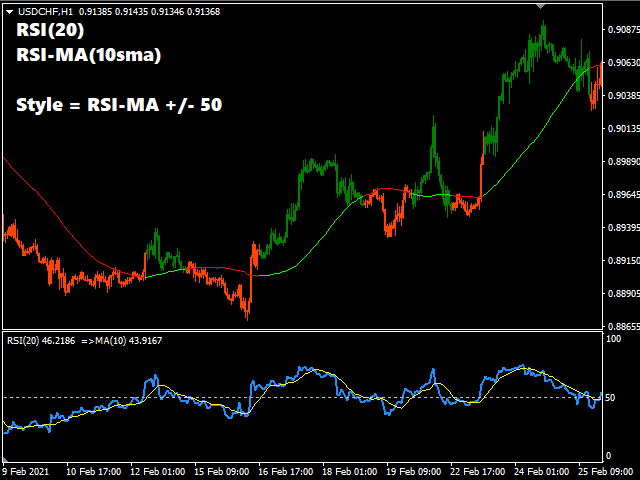
See RSI values turned into colored candles
Applying coding to the chart may help in conceptualizing price trend and impulse movements defined through RSI values.
Features
- optional colored candles
- optional colored ma
- 6 draw styles;
- RSI slope
- RSI above/below overbought/oversold levels
- RSI above/below level 50
- RSI above/below it's moving average
- RSI-MA slope
- RSI-MA above/below 50
Troubleshooting:
- if you do not see any colored candles, unselect the "chart on foreground" option in the common tab of the chart properties (right click on chart, select properties).
- If there are any issues or suggestions for the indicator, please comment and let me know. The feedback will be noted and considered in future updates.


Muy buen indicador. Ayuda a establecer la tendencia y se puede usar con cualquier estrategia.