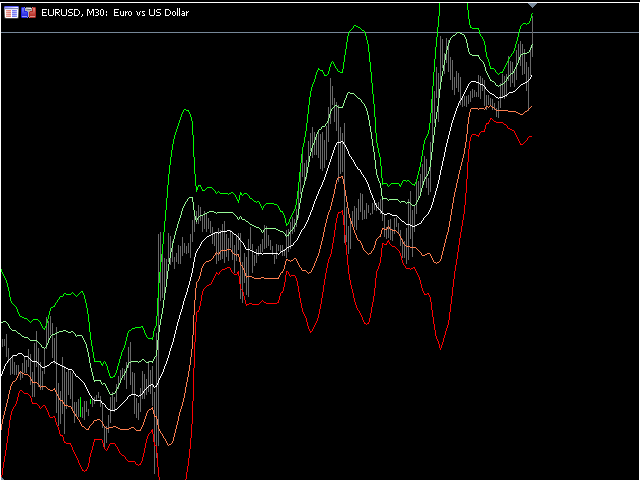
Bollinger Bands Max Free MT5
- Indicadores
- John Louis Fernando Diamante
- Versión: 1.0
A flexible BB indicator
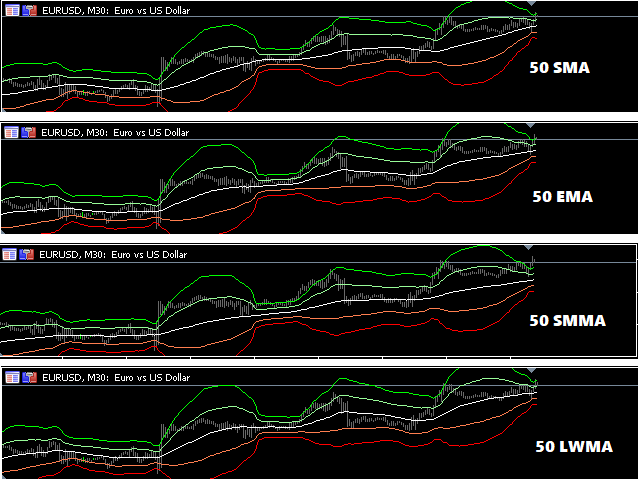
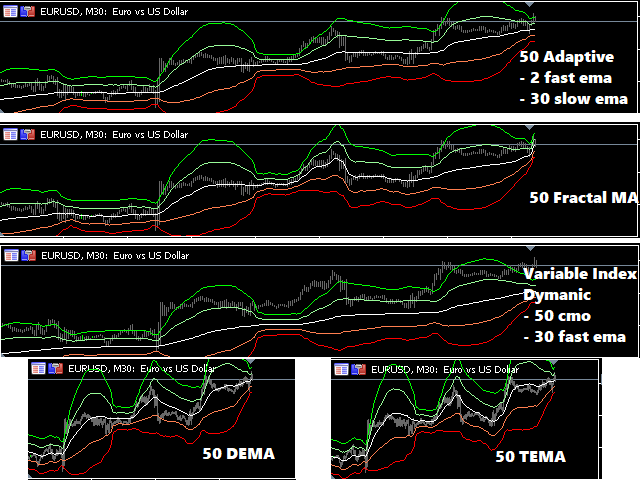
You're no longer limited to the built in default of using BB off a SMA method, now you can choose from:
SMA - SMMA - EMA - LWMA - ADAPTIVE - FRACTAL ADAPTIVE - DEMA - TEMA - VARIABLE INDEX DYNAMIC
You now also have 2 standard deviation levels. A more featured version is available with 5 deviation levels, color gradients to lines and filling as well as candles, with full alerts too: Bollinger Bands Max MT5
Options:
- MTF
- 9 choices of MA to base the BB off
- 2 adjustable deviation levels
Troubleshooting:
- If there are any issues or suggestions for the indicator, please comment and let me know. The feedback will be noted and considered in future updates.

Great !