MACD by MK
- Indicadores
- Maxim Kuznetsov
- Versión: 1.0
- Activaciones: 5
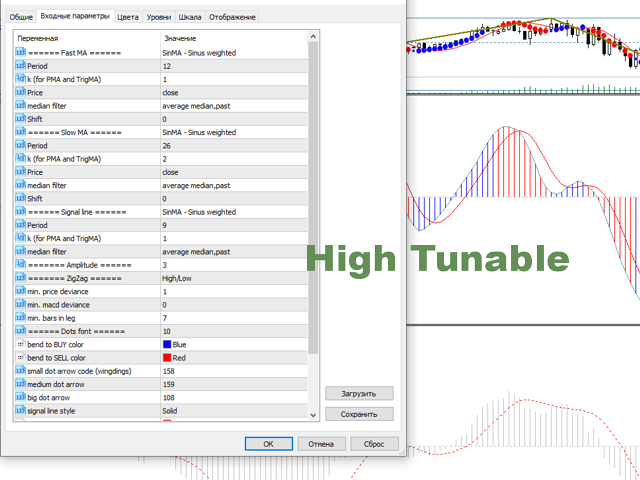
Like the classic MACD, this indicator is based on a comparison of two averages. You can choose the average from a wide number of options:
- the usual SMA,LWMA, EMA
- indicators FraMA,DEMA, TMA
- weighted Parabolic (weight~n^k), Sinus Weighted (weight~sin (n)^k)
- Volume weighted(weight~volume (n)^k)
- weighted by exponential coefficients (weight~exp(n))
- the average of the last values of the
- median filter
- and their combinations
- at an amplitude of 1, the MACD on the main chart coincides with the fast MA
- at large values has a larger scope.
- accordingly, at the amplitude of 0, everything will coincide with the slow MA on the main chart
By default, the amplitude is 2.
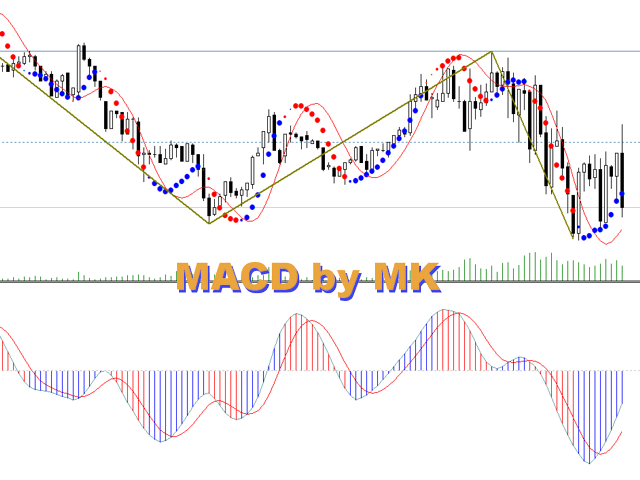
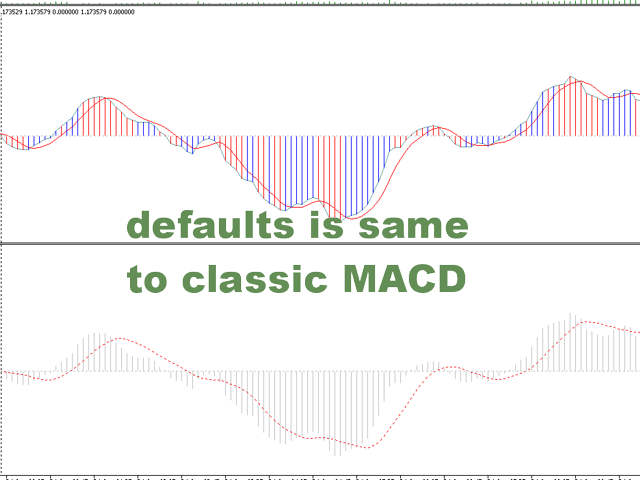
The "MACD by MK" indicator looks generally similar to the MACD and displays the difference between the two averages and its smoothed value (signal line).
The colors of the histogram indicate the direction of the signal line bend. Blue means that purchases are accelerating and sales are slowing down. That is, the signal line has an upward bend. Red on the contrary-in favor of sales
The main chart displays :
- dots are the strengthened values of the MACD. The color and size show the bending directions and stability
- line - enhanced signal line MACD
- zigzag - trend zigzag at prices, based on the indicator readings
Trading recommendations
Use the ZigZag as the trend direction

