Candle com Fibonacci
- Indicadores
- Fernando Sanches
- Versión: 8.21
- Activaciones: 5
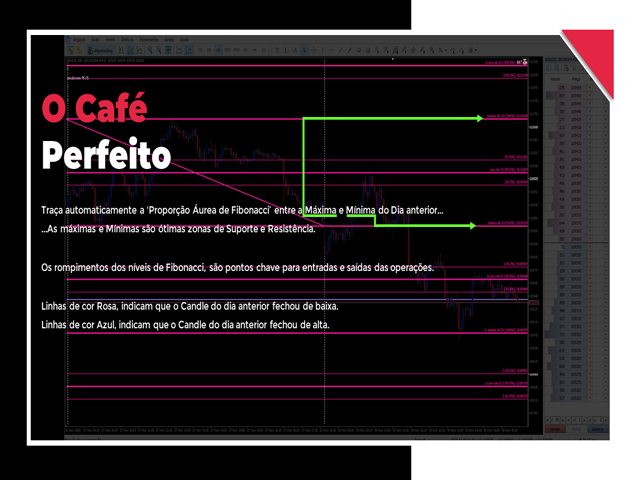
Automatically plots the 'Golden Fibonacci Ratio’ between the High and Low of the previous day...
...Highs and Lows are great Support and Resistance zones.
Breakouts of Fibonacci levels are key points for entry and exit of trades.
Pink lines indicate that the previous day's Candle closed lower.
Blue colored lines indicate that the previous day's Candle closed higher.


