Variativity
- Indicadores
- Maxim Kuznetsov
- Versión: 1.0
- Activaciones: 5
El indicador evalúa el grado de volatilidad de los precios e identifica los componentes que conducen al crecimiento y la disminución. Usando Variativity, puede determinar dónde cambia el movimiento, buenos momentos para operar con la tendencia o contra la tendencia. Acompañar transacciones abiertas.
Monitor
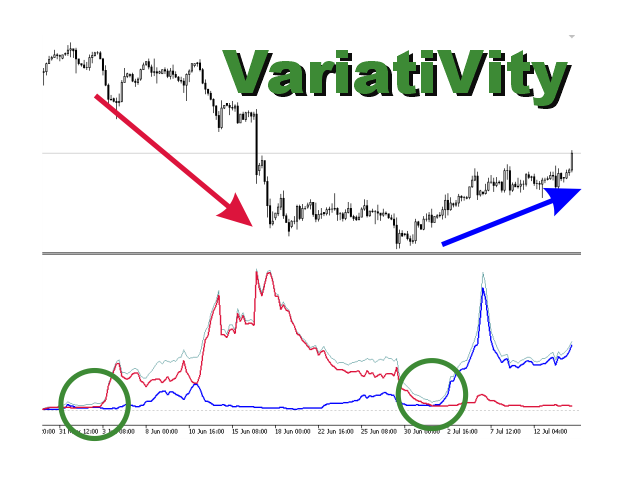
El indicador muestra 3 líneas:
VARIATIVITY - delgada línea gris. Volatilidad total del precio. El crecimiento de la línea indica un aumento en la actividad del mercado. La disminución indica la posibilidad de operaciones en contra de la tendencia. Una caída significativa a valores pequeños significa una alta probabilidad de un cambio de tendencia.
UP - línea azul. La proporción de cambios que conducen a un aumento del tipo de cambio. El inicio del crecimiento al alza a partir de valores pequeños, mientras que la volatilidad general disminuye, puede servir como una señal para las compras.
DN es la fracción que conduce a una disminución. La proporción de cambios que conducen a una depreciación.
El cruce de las líneas UP y DN también se puede utilizar como señal de entrada.
Usando el indicador
Comercio de tendenciasLa negociación de tendencias se realiza cuando la línea de VARIATIVITY comienza a subir desde valores bajos. La dirección se elige de acuerdo con el UP o DN predominantemente creciente
Comercio de contratendenciaEl comercio de contratendencia se realiza cuando la línea de VARIATIVITY disminuye y UP o DN comienzan a crecer desde valores pequeños.
Escolta de transaccionesSe recomienda rastrear órdenes stop solo cuando la volatilidad total cae.
Tendencia y movimiento lateral
Una caída significativa en la VARIATIVITY a mínimos solo precede a un posible cambio de tendencia y puede indicar el comienzo de un movimiento lateral.
Existe poca variabilidad en el movimiento lateral y puede persistir durante mucho tiempo.
Otras recomendaciones
Se recomienda utilizar el indicador junto con indicadores de rango (por ejemplo, ATR) y un calendario de operaciones.
Cuando utilice marcos de tiempo de M30 a H4, debe considerar cuidadosamente la ciclicidad diaria.
Tenga en cuenta las características específicas del instrumento al elegir un período de tiempo. En el caso de los metales, se recomienda utilizar periodos de tiempo amplios H4, D1
Configuración del indicador
El indicador es muy fácil de configurar, tiene solo dos parámetros principales:
PRICE - selección de precios para análisis. Por defecto, el cálculo se basa en los precios de apertura de la barra.
DEPTH: la profundidad de la historia analizada. A efectos prácticos, debe ser significativo, al menos 100 bares. El valor predeterminado es 240.
SMOOTCH - suavizado de líneas. Desactivado de forma predeterminada, pero puede establecer el período promedio. 13 sería una buena elección
El indicador realiza una cantidad significativa de cálculos y, para un rendimiento óptimo, puede limitar el número de barras calculadas y mostradas.
LÍMIT: si se establece, limita el número de barras calculadas
Buena suerte !
El código fuente se puede proporcionar al comprador final para su revisión.