Dashboard Premium
- Utilidades
- Boris Sedov
- Versión: 1.2
- Actualizado: 25 abril 2023
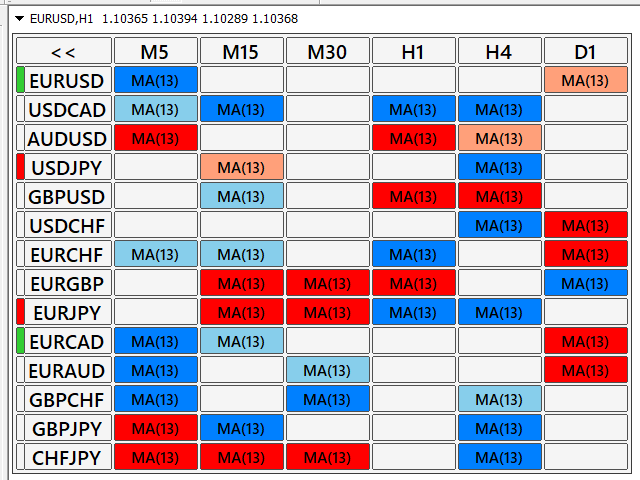
The programmable signal panel analyzes the charts of all available symbols and timeframes and sends a notification about the appearance of a trading signal.
You can program all the necessary signals using the free binding indicator "Signal Collection". The binding indicator is provided with open source code. Thus, it is possible to program all the necessary signals for subsequent use in conjunction with the signal panel. The signal panel can not only analyze charts, but also manage these charts. When the signal panel is placed on the chart, all the signals found will be collected in one place. By clicking on the cell with the found signal, the transition to the corresponding graph is carried out.
Features
Signals of any complexity can be programmed.
Use the "Signal Collection" binding indicator as a template for programming all the necessary signals. You can change the code and connect auxiliary indicators.
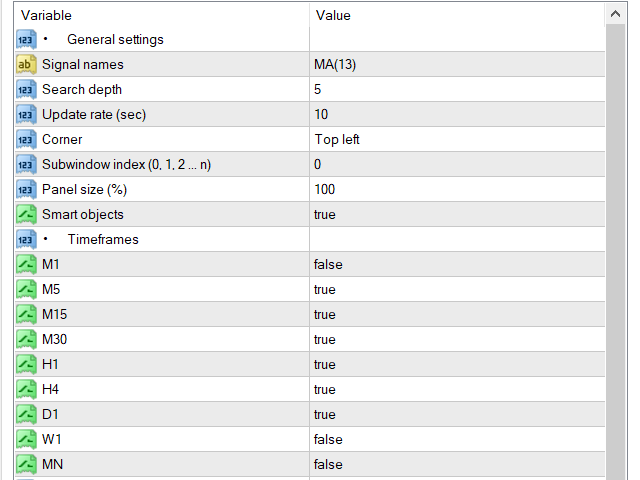
You can adjust the depth of the signal search.
The signal panel can detect the signal on the current forming candle or on the last (right) closed candle. In addition, you can adjust the depth of the search for the last (current) signal. When a signal is found, the corresponding cell is colored in the specified color.
You can switch between different charts in one window.
The panel shows all the signals found in separate cells, clicking on the cell takes you to the corresponding graph in the same window.
A special mode of working with graphic objects is available — Smart objects.
Using this mode makes working with graphical objects more convenient. For example, objects created on the EURUSD chart will be automatically temporarily hidden on the charts of other currency pairs, but as soon as the EURUSD chart is enabled, all objects will be available again.
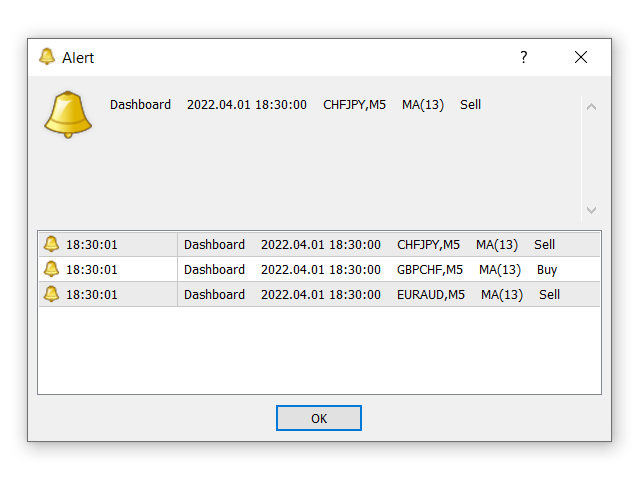
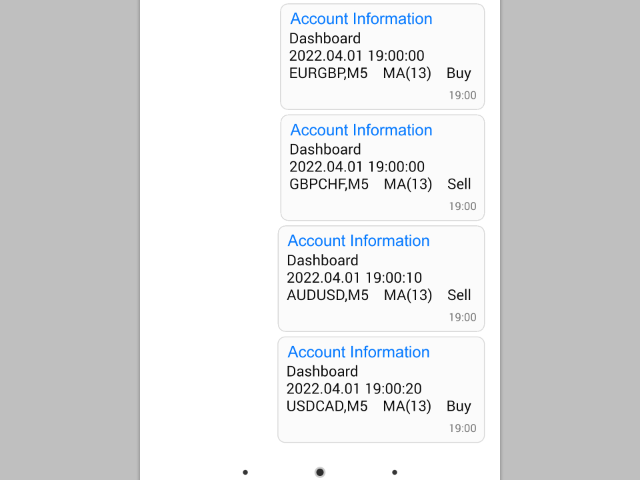
You can configure notifications about the appearance of new signals.
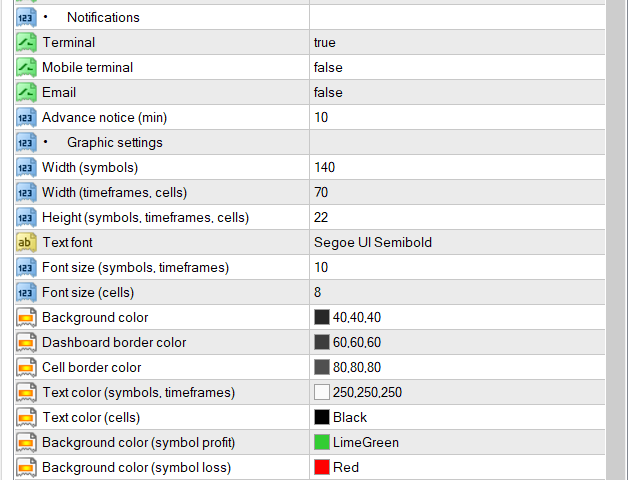
You can individually include notifications in the terminal, mobile terminal (Push Notifications) and e-mail. In addition, you can set up advance notifications by adjusting the time until the closing of the current emerging candle, when the signal can already be considered relevant. Thus, a preliminary notification can be sent a few minutes before the closing of the current emerging candle.
The signal panel is fully interactive.
All the main elements on the signal panel are clickable. You can select the desired tool, make transitions between charts, temporarily hide the panel for the convenience of technical analysis.
Flexible graphics customization is available.
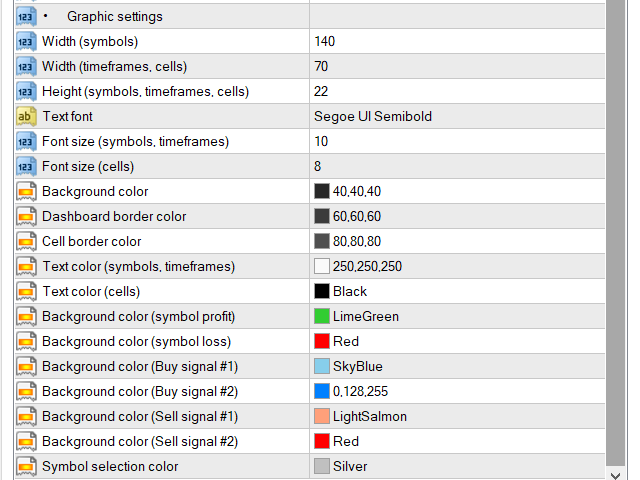
You can specify the sizes and colors of all the elements of the signal panel, as well as scale the panel by specifying the desired scale value as a percentage. All these features make working on monitors with a large screen resolution more convenient.
The signal panel analyzes not only charts, but also open positions.
You can observe the generalized information on open positions directly on the signal panel. Information on open positions is presented in the form of color indicators. The profit for each symbol is highlighted in green, the loss is highlighted in red.
Launch
To operate the signal panel, you need to install a binding indicator "Signal Collection" in the terminal.
Before starting the signal panel, the binding indicator should already be placed on the chart.
To use several different signals, you need to list the names of the signals separated by commas in the corresponding parameter "Signal names".
Example: MA(13), MA(21)
To program the signals, you need to make appropriate changes to the binding indicator file.
if(close[i]>iMA(NULL,0,13,0,MODE_EMA,PRICE_CLOSE,i) &&
   close[i+1]<=iMA(NULL,0,13,0,MODE_EMA,PRICE_CLOSE,i+1)) bf0[i]=low[i];
else if(close[i]<iMA(NULL,0,13,0,MODE_EMA,PRICE_CLOSE,i) &&
        close[i+1]>=iMA(NULL,0,13,0,MODE_EMA,PRICE_CLOSE,i+1)) bf1[i]=high[i];
The following code snippet specifies the most common way to interpreting the price moving average.
When the instrument price rises above its moving average, a buy signal appears, if the price falls below its moving average, what we have is a sell signal.


























Dashboard looks good. I will try use with my strategy. I will update after.
27.12.2023. Boris is very helpful. His helped me with code for my indicator+ Dashborad Premium.
Dashboard works very well