Multi Breakout Pattern
- Indicadores
- Ammar Yaseen
- Versión: 1.0
- Activaciones: 5
BEHOLD!!!
One of the best Breakout Indicator of all time is here.
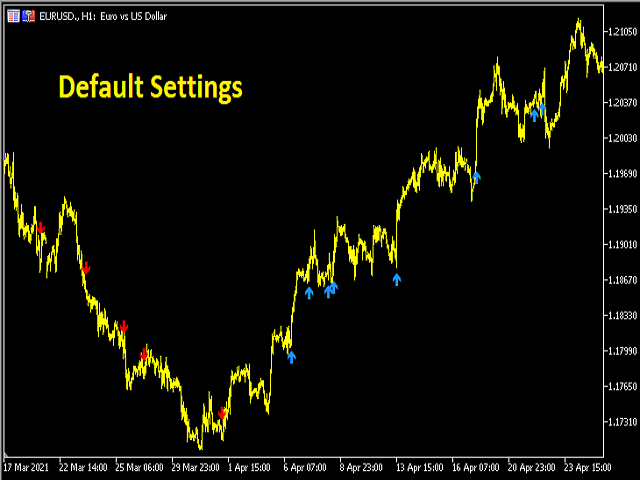
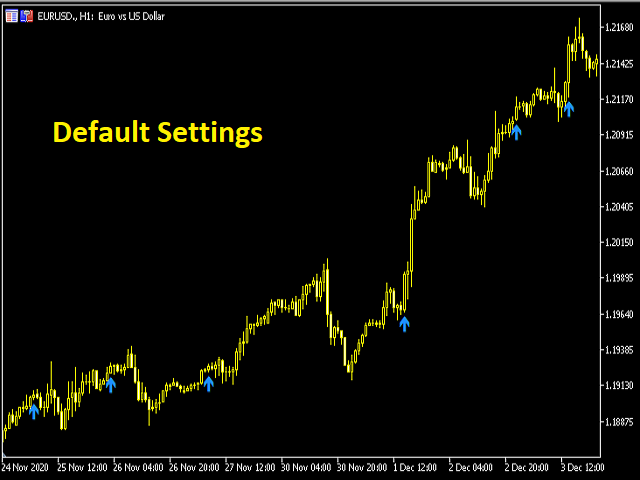
Multi Breakout Pattern looks at the preceding candles and timeframes to help you recognize the breakouts in real time.
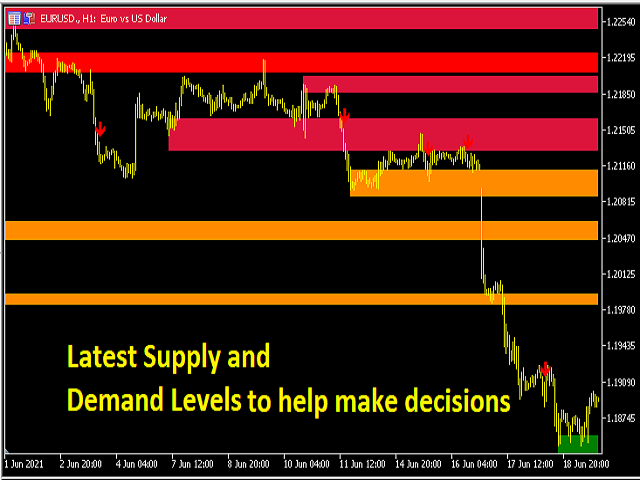
The In-built function of supply and demand can help you evaluate your take profits and Stop losses
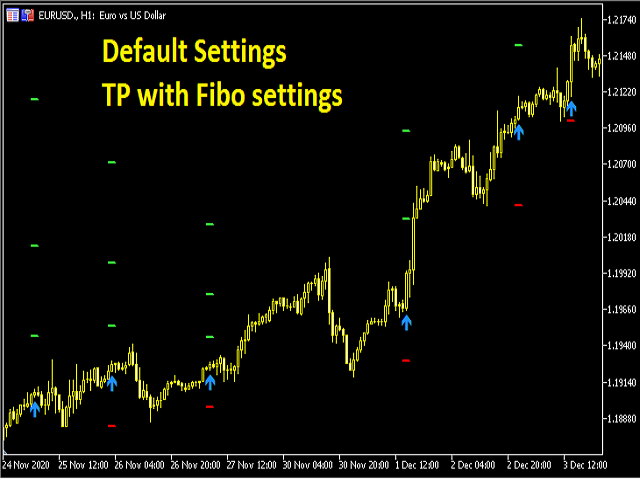
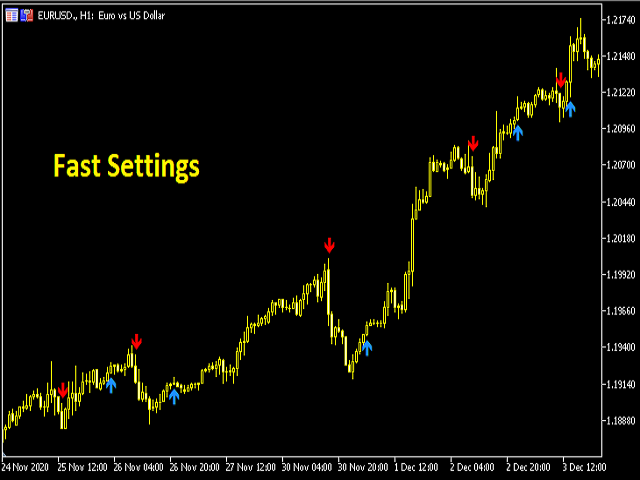
SEE THE SCREENSHOTS TO WITNESS SOME OF THE BEST BREAKOUTS
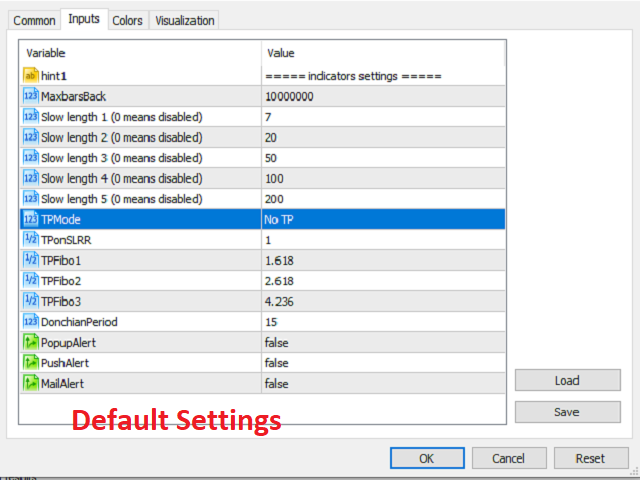
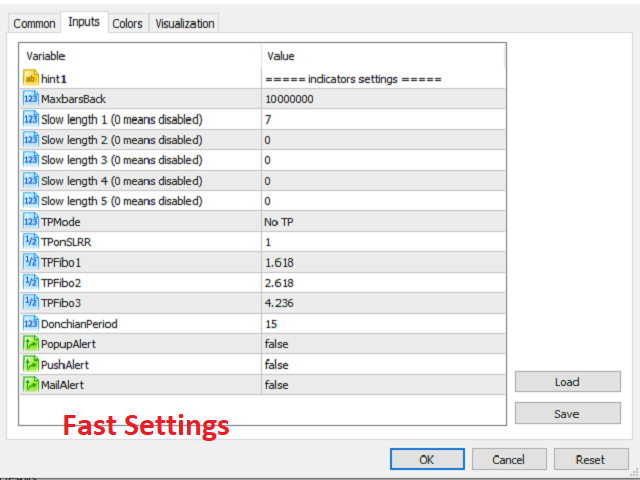
INPUTS
MaxBarsback: The max bars to look back
Slow length 1: Period lookback
Slow length 2: Period lookback
Slow length 3: Period lookback
Slow length 4: Period lookback
Slow length 5: Period lookback
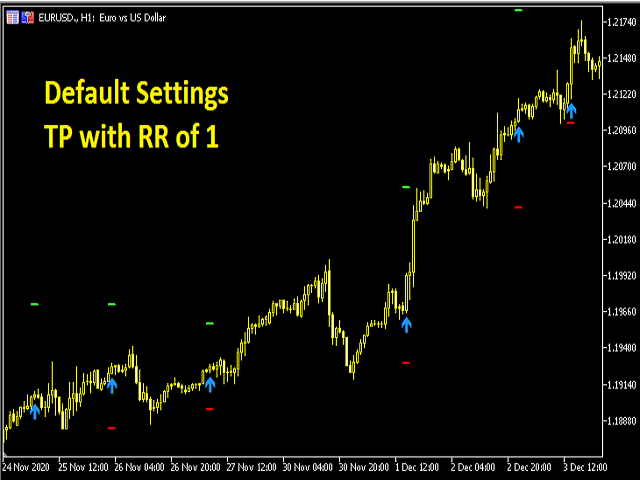
TP Mode: No TP/RR TP/ Fibo TP
No TP: Selection of No TP would not put any Take profit targets
RR TP: Take Profits according to Reward to Risk ratio set in TPonSLRR parameter
FIBO TP: Take Profits set according to Fibonacci Ratios in TPFibo 1, TPFibo 2 and TPFibo 3
TPonSLRR: The Take profits will be set according to Reward to Risk Ratio
TPFibo 1: Fibonacci level 1
TPFibo 2: Fibonacci Level 2
TPFibo 3: Fibonacci Level 3
Donchain Period: Settings for Stop Loss
PopupAlert: true/false
PushALert: true/false
MailAlert: true/false


El usuario no ha dejado ningún comentario para su valoración