Draw Candle Levels
- Indicadores
- Attila Radulovic
- Versión: 1.2
- Actualizado: 29 abril 2023
- Activaciones: 5
You can easily draw horizontal ray line for the open, high, low and close price levels of any candle with this indicator.
Parameters
Mode- Key + click - you should press o, h, l or c keys on the keyboard first, then click on any candle.
- Mouse hover + click - just move your mouse and point to any candle, then press o, h, l or c keys on the keyboard.
Note: in both modes, you should point the horizontal center of the candle for accurate selection. The vertical position of the pointer is irrelevant.
Line Color
The color of the horizontal ray line.
Line width
The width of the horizontal ray line.
Line style
The style of the horizontal ray line.
Line selectable?
Should a line be selectable, or not?
Label mode for lines
- Mode for text labels.
- Disabled: no text labels displayed.
- Above line: text labels always above the lines
- Below line: text labels always below the lines
- Auto select: text labels above/below lines based on price
Label color
Color of the text labels.
Label size
Size of the text labels.
Label font type
Font family of the text labels.

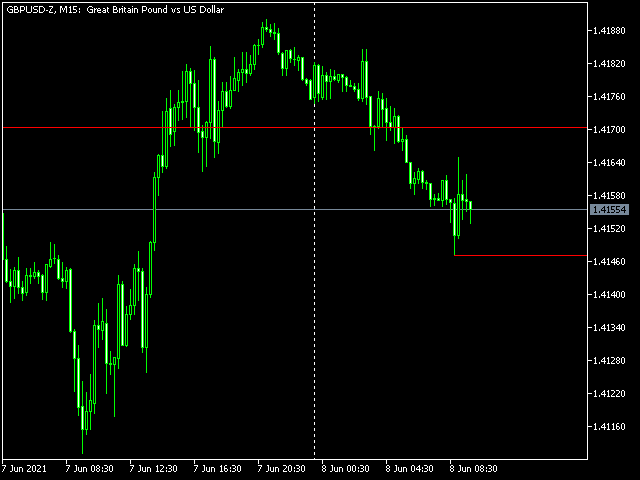













Very useful product that helps draw shorter horizontal rays .The options allow to choose the opening or close or high or low prices to project the lines from.Its very user friendly.I requested Attila to add a feature to display the label detail which he implemented successfully.Highly recommended this product for support and resistance traders.